
Abstract
The performance of photoelectrochemical cell (PEC) strongly depends on the physical properties of photovoltaic material. Polyvinylpyrrolidone (PVP), cetyltrimethylammonium bromide (CTAB) and hexamethylenetetramine (HMT) surfactants were used to modify the morphology nanostructure of ZnO films by a simple technique, namely, ammonia-assisted controlled hydrolysis technique during their growth process. The film treated with PVP, CTAB and HMT produce the nanostructure shape of nanoflower, nanowire and nanorod (NR), respectively. These ZnO samples were utilised as photovoltaic materials in a PEC of FTO (fluorine tin oxide)/ZnO/electrolyte/platinum. It was found that the photovoltaic parameters such as short-circuit current density (Jsc), open-circuit voltage (Voc) and fill factor (FF) are influenced by the morphology in term of shape and particle size and optical property of the ZnO NR. The PEC utilising the ZnO sample treated with HMT surfactant demonstrated the highest Jsc of 0.47 mAcm−2, Voc of 0.46 V, FF of 29.2% and η of 0.06%, respectively, since it possesses the lowest energy gap.
1. Introduction
Other metal oxides such as SnO2, In2O3, Nb2O5, WO3, Fe2O3 and ZnO have also been used as photovoltaic materials in solar cell.[Citation1] ZnO possesses energy band structure (Eg = 3.4 eV) with large exiton binding energy (60 MeV) and physical properties similar to those of TiO2, but its electron mobility is higher by 2–3 orders of magnitude.[Citation2,3] Therefore, ZnO is expected to exhibit faster electron transport with reduced recombination loss. Although the conversion efficiencies (0.4%–5.8%) obtained for ZnO are much lower than the maximum reported to TiO2, ZnO is still thought of as the most promising alternative to TiO2 due to its ease of crystallisation and anisotropic growth.[Citation4]
Modifying the morphology of ZnO nanostructure is the most recent approach to enhance the performance of photoelectrochemical cell (PEC). A desirable morphology of ZnO photovoltaic materials would be the mesoporous channels or nanorods (NRs) aligned in parallel to each other and vertically with respect to the TCO glass current collector. This would facilitate charge diffusion in the pores and the mesoporous film, resulting in better contact to the film surface with electrolyte. In this work, we demonstrated an alternative method for preparing high density, vertically oriented 1D ZnO nanofilms on the fluorine tin oxide (FTO) surface via a 1D crystal growth of nanoseeds under a simple ambient-temperature hydrolysis process of zinc salt in the presence of ammonia with a relatively short growth period.[Citation5] By choosing suitable surfactant,[Citation6–8] the 1D ZnO NRs were successfully synthesised with desired surface morphology. The present method called ammonia-assisted hydrolysis technique should become a potential approach for the preparation of vertically oriented NR ZnO nanofilms on substrate surface for use in solar cell.
The objective of this work is to study the effect of treating ZnO films prepared by a simple technique, which is also called seed mediated growth by polyvinylpyrrolidone (PVP), cetyltrimethylammonium bromide (CTAB) and hexamethylenetetramine (HMT) surfactants on the morphological nanostructure of the films in term of shape and particle size. These ZnO nanostructure samples were then utilised as photovoltaic materials in a PEC of FTO/ZnO/electrolyte/platinum. The effect of particle size of the ZnO nanostructures on the photovoltaic parameters such as short-circuit current density (Jsc), open-circuit voltage (Voc), fill factor (FF) and power conversion efficiency (PCE) are investigated.
2. Experimental
2.1. Materials
The materials used were FTO-coated glass, indium tin oxide (ITO)-coated glass, zinc acetate dihydrate (Zn(CH3COO)2 · 2H2O), ammonia solution (NH3), ethanol, acetone, 2-propanol ammonium hexafluorotitanate, CTAB, HMT and PVP surfactants. All chemicals are analytical grade and were used in their original form without further purification.
2.2. Preparation of ZnO nanoparticle
ZnO nanoseeds on the FTO surface were prepared using an alcohothermal seeding method. A thin layer of ethanoloic solution of 10 mM zinc acetate dihydrate (Zn(CH3COO)2 · 2H2O) on a cleaned FTO surface was firstly prepared by two-steps spin-coating process for 6 and 30 s at a speed of 400 and 3000 rpm, correspondingly. The sample was then dried at 100°C on a hot plate for 15 min. These procedures were repeated for three times in order to get high-density ZnO nanoseeds. The sample was annealed in air at 350°C for 1 h. The growth of ZnO nanostructures from the nanoseeds was carried out by immersing the nanoseeds-attached FTO in vertical position into a 35 ml glass vial containing 10 ml of 0.01 M aqueous solution of zinc acetate dihydrate (Zn(CH3COO)2 · 2H2O) at room temperature. The solution was then mildly stirred during the reaction using a 10 mm magnetic stirrer bar. A 20 μl of 30% ammonia solution (NH3) was then dropped into the growth reaction using a micropipette. The time interval for the addition of NH3 drop was about 1 min. The clear solution of zinc acetate immediately changed to a translucent bluish colour at the first drop for 3 min and then back to clear solution. A tiny whitish suspension was observed when the reaction time was prolonged or a high concentration of ammonia was used. The reaction was left to continue up to 5 min during the growth process. Surfactant treatment is expected to modify the samples morphology. Small quantities of 30 mM CTAB, 0.4 mM PVP and 30 mM HMT surfactants were separately added into the 30 mM zinc precursor. Multiple growth process was applied in these treatments since the effect of surfactant on the morphology using single growth cannot clearly be seen. Multiple growth process was also used to control the length of the NRs that give the optimum morphology.
2.3. Fabrication and performance study of PEC
A liquid electrolyte consists of an organic solvent such as acetonitrile and a redox couple I−/I3− that serves as a redox medium. The electrolyte solution composes of 0.5 M LiI (lithium iodide) mixed with 0.05 M I2 (iodine) and 0.5 M TBP (4-tertiary butyl pyridine) in acetonitrile solvent. The solution was mixed with LiI and I2. The required amount of pure I2 solution and LiI powder was added into acetonitrile solvent. The solution was stirred uniformly until LiI was dissolved thoroughly. Finally, TBP was added to the electrolyte solution. Platinum conductive glass acted as a counter electrode was prepared by sputtering platinum disc on ITO substrate using sputter coater Bio-Rad Microscience Division Sc500 model. Platinum counter electrode was prepared with an area and geometry equal to that of ZnO electrode.
ITO-coated glass substrate as a positive electrode was used in fabricating the PEC. The ZnO2 NR thin films treated with and without surfactant were placed on platinum counter electrode. Both electrodes were separated by a parafilm that acts as a spacer. Several drops of the electrolyte solution were injected onto the ZnO NRs in the clamped structure of the cell. The illuminated area of the cell that serves as its active area was 0.8 cm2. The performance of the PEC in dark and under illumination was characterised by measuring the current–voltage (I–V) curve of the cells. The cell performance in dark was performed to observe the dark current in the cell. The cell was placed in a box in order to minimise the light that could be absorbed in measuring the performance of the cell in dark. The performance study under illumination was performed to study the photovoltaic effect of the cell. The cell was illuminated through the solar simulator slide. Photocurrent-voltage measurements were performed using AM 1.5 Solar Simulator, Keithley high voltage and personal computer. The solar simulator was used to provide the illumination of 100 mW cm−2. Keithley high voltage source was connected to the personal computer as a single system to provide the voltage, recorded and displayed the I–V curves. The operating temperature was 25°C–27°C in humidity of 40%. The I–V curves were measured in a voltage range between −1.0 and +1.0 V for both in dark and under illumination. Each measurement was carried out five times using three ZnO electrodes with similar surfactant treatment to confirm the accuracy of the result. From the I–V curves, the photovoltaic parameters such as open-circuit voltage (Voc) and short-circuit current (Isc) were obtained from the intersection of voltage and current axis, respectively.
3. Results and discussion
shows the x-ray diffraction (XRD) spectra of the ZnO quasi-NRs treated with three surfactants CTAB, PVP and HMT. The XRD pattern for the sample treated with CTAB shows five prominent peaks at 31.7o, 34.4o, 36.25o, 47.5o and 56.5o as shown in (a). According to the Joint Commission for Powder Diffraction Standards (JCPDS) (file no. 79-2205), the spectrum can be indexed as the hexagonal wurtzite structure (cell constant of a = 3.2501 Å and c = 5.2071 Å) of ZnO with the peaks corresponding to (100), (002), (101), (102) and (110) planes, respectively. As evidenced in (b), the sample treated with PVP shows higher intensity peak than the sample treated with CTAB at 34.4o corresponding to (002) plane and no peaks related to other zinc complexes are observed, confirming the phase purity of ZnO nanocrystals. The peaks with asterisks are assigned to the diffraction peaks from the FTO substrate. A similar spectrum was also obtained for the ZnO sample treated with HMT surfactant as shown in (c). The XRD pattern of this sample at (002) plane shows the highest peak than the other samples as shown in (a) and (b). This dominated (002) peak indicates that an upstanding ZnO NR array grows along c-axis. The other peaks present in the XRD pattern shown in (a) indicate that ZnO NR array grows to other axis instead of c.[Citation9,10]
Figure 1. XRD patterns of ZnO NR treated with (a) CTAB, (b) PVP and (c) HMT.
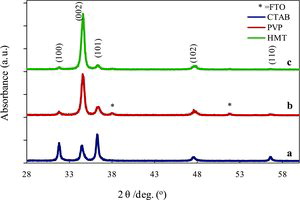
The XRD pattern shows that the addition of surfactant of PVP and HMT into the growth solution produced ZnO NRs crystal having higher growth orientation along c-axis that is perpendicular to the FTO substrate compared with that of ZnO NRs treated with CTAB. This is clearly seen from the presence of dominant and prominent peak of (002) for both samples. The growth orientation takes place to all sides of crystal plane assigned by the three dominant peaks of (100), (002) and (101) plane for ZnO NRs crystal grown with the addition CTAB in the growth solution. The role of surfactant is very important to form a crystallinity modification to the resulting ZnO NRs. Some studies reported that the usage of HMT [Citation11–13] and PVP [Citation14] for ZnO nanostructure modification resulted in ZnO NRs with high c-axis oriented.
shows the field emission scanning electron microscopy (FESEM) images of the ZnO samples treated with surfactant of CTAB, PVP and HMT. Clear difference in the morphology of the samples could be seen in the figure. The samples were observed to have a diversity of morphology structure. The green circles in the FESEM images represent a free-standing ZnO nanostructure grown on the FTO surface. The ZnO nanostructure grown in the solution treated with CTAB as shown in (a1) and 2(a2) shows high-density morphology. Single free-standing rod in the circles shows that ZnO crystal has such fruit star rod morphology with a dot tip of top end and prism like side of the rod. (b1) and 2(b2) shows the ZnO nanostructure grown in the growth solution containing PVP. It is clearly seen that more free standing NRs grown on the surface. However, some of the NRs closely stand and lean to each other. Spacing inter-rod made the porosity of the sample becomes higher. Radial top-end for single rod of ZnO nanocrystal treated with PVP in the green circles is shown in (b2). The sample grown in the growth solution containing HMT produces the ZnO nanostructure with highly compact NR as shown in (c1) and 2(c2). On its surface, it is clearly seen that the presence of short and small NRs were observed on the top end of the ZnO sample.
Figure 2. FESEM images quasi-1D ZnO NRs treated surfactant (a1) CTAB (b1) PVP (c1) HMT in low magnification, and (a2)–(c2) are (a1)–(c1) in high magnification. Insert is the cross section of (a1)–(c1), respectively. The scale bar is 100 nm.
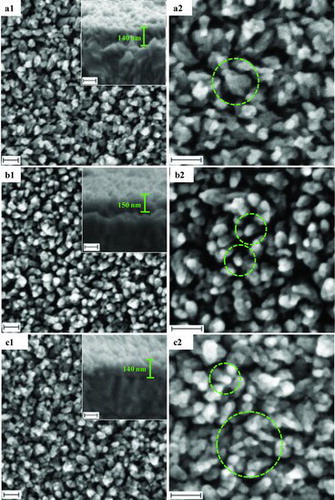
Generally, surfactant could reduce the surface tension of the solution, which decreases the energy needed to form a new phase.[Citation15,16] Therefore, ZnO nanostructure could be formed in a lower super saturation. The surfactants such as CTAB, PVP and HMT are a non-polar chelating agent, preferentially attached to non-polar facets of zincite crystal, thereby cutting off the access of Zn2+ ions to them, leaving only the polar (001) of c-axis face for epitaxial growth.[Citation17] However, the surfactants also modify ZnO NRs morphology entirely including end tip of NRs. In conclusion, the synthesised ZnO NRs should be smaller in diameter, be able to modify its morphology and enhances the nanofilm surface area. Three types of surfactant used in this work, namely CTAB, PVP and HMT, have different molecular weight (MW). The descending order of the MWs is PVP > CTAB > HMT corresponding with 55.000, 364.45 and 140.19 gmol−1. The difference in MW is playing role to sort of the capping on the surface of ZnO nanostructure.[Citation18] PVP is the largest polymer molecule surfactant, will cap bigger surface area, giving a few access for Zn nuclei to grow further. Smoother rounded top end rod was observed in the ZnO treated with PVP as shown in (b1) and 2(b2). Furthermore, the HMT with the lowest MW would produce smaller surface area of the sample, hence giving higher access to Zn nuclei to grow further. This condition formed rough surface morphology and results in the presence of fuses on the top end of the NRs as shown in the green circle of (c2). In conclusion, the three surfactants used in this work were able to modify the surface morphology of ZnO nanostructure effectively in descending order, HMT, CTAB and PVP.
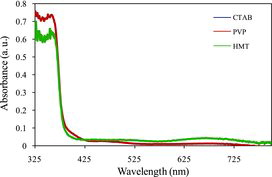
shows the optical absorption spectra of the ZnO nanostructure treated with three kind of surfactant, namely CTAB, PVP and HMT. The patterns of the spectra are almost the same. The absorbance of ZnO-treated HMT samples in the spectral range of 325–400 nm is lower than those treated with CTAB and PVP, respectively. In the region (λ < 400 nm), all samples show the highest absorption. This is reasonable, since ZnO sample treated HMT shows highly compact ZnO surface morphology as shown in (c1) and 2(c2). Thus, more photons could be absorbed by ZnO film.
Figure 3. UV-visible spectra of ZnO nanostructure treated with various surfactants.
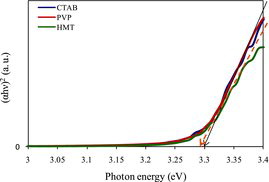
shows the plots of direct energy gap as a function of photon energy for the surfactant treated ZnO samples in term of (αhν)2 versus photon energy. From the figure, it is seen that slight difference in the energy gap of the ZnO samples. The energy gap of the sample treated with HMT is slightly lower than the other samples. This result is correlated to the UV–Vis optical absorption shown in , whereas there is a small difference in the absorption pattern at the wavelengths greater than 525 nm. Energy gap consistently changes by changing the absorption pattern which was also reported by another researcher.[Citation19] The relationship between the absorption patterns with the energy gap is expressed by the equation of (αhν)2 = ED (hν − Eg), where α, h, ν, ED and Eg are the absorption coefficient, Plank constant, frequency, and energy constant gap, respectively. Since the frequency is inversely proportional to the wavelength, thus the energy gap is also inversely proportional to the wavelength; therefore, the sample with higher absorption at larger wavelength possesses a lower energy gap. Another factor that affects the change in the energy gap is the crystallite size of the sample. The sample with smaller crystallite size has larger energy gap. This relationship was described by Lin et al. (2005),[Citation20] where the sample of ZnO quantum dot with a smaller diameter has a larger energy gap for the diameter varied from ∼ 3.5 to 12 nm. This result has been confirmed using a mass effective model based on Coulomb interaction and the data calculated using the model agreed well with the experimental data. The relationship between the crystallite size and the energy gap of the ZnO samples prepared with various surfactants is illustrated in .
Table 1. Crystallite size and energy gap for the ZnO samples prepared with various surfactants.
Figure 4. Direct energy gap as a function of photon energy for the surfactant treated ZnO samples.
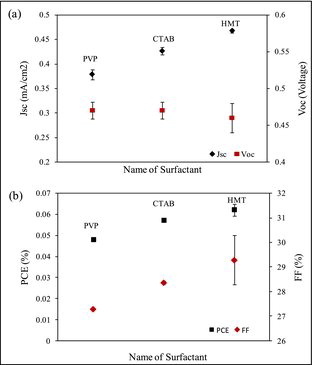
shows the J–V curves of the PEC utilising ZnO NRs grown with various surfactant. From the dark current curve, it can be concluded that the device demonstrates rectification property since the current in forward bias is much larger than in reverse bias. If the device exhibits rectification property, the quite significant photocurrent can thus be expected. The figure shows the cell utilising ZnO NRs treated with HMT generated the highest output power, followed by the cell with CTAB and PVP surfactants. (a) shows the Jsc and Voc as a function of surfactant. The figure shows the cell utilising ZnO NRs treated with HMT demonstrated the highest Jsc compared with the cell utilising ZnO treated with CTAB and PVP. The highest Jsc was 0.47 mAcm−2, the highest Voc was 0.46 V and the highest FF and η were 29.2% and 0.06%, respectively. It is also observed that the Voc of the three cells is almost the same, although the Voc of the cell of ZnO treated HMT shows slightly lower than the other two cells. (b) shows the FF and η as a function of surfactant. It shows the cell utilising ZnO NRs treated with HMT demonstrated the highest FF and η compared with the cell utilising ZnO treated with CTAB and PVP, respectively.
Figure 5. J–V curves of the cell utilising ZnO samples treated with various surfactants.
Figure 6. (a) Short-circuit current density and open-circuit voltage as a function of surfactant and (b) power conversion efficiency and fill factor as a function of various surfactant.
In the PEC utilising of ZnO NRs treated with HMT, the reaction between the ions in electrolyte with ZnO occurred most effectively. This might be due to the smooth surface morphology and highly compact ZnO NRs caused more ions reacted with ZnO NRs at electrolyte–ZnO interface. As evidenced from FESEM micrograph, the addition of HMT into the growth solution produced highly compact ZnO NRs morphology with prominent tip at the top end of the NRs. The result was also supported by the optical absorption spectra and the estimated band gap of ZnO nanostructure treated with HMT is the lowest (3.28 eV). Furthermore, this ZnO sample possesses the highest optical absorption in the visible region (>400 nm). Therefore, the number of electron–hole pairs generated in this cell is bigger than the other two cells. Thus, the performance of the cell in term of photocurrent has been improved. The photovoltaic performance of the PEC from this work was higher than that reported by Rahman et al. (2012) in [Citation21] which they reported the effect of surfactant, namely CTAB, HMT and PVP, on TiO2 nanostructure morphology and optical properties. The TiO2 samples were then utilised in a PEC of ITO/TiO2/electrolyte/platinum and the cell utilising HMT surfactant performed the highest Jsc and Voc of 57.5 μAcm−2 and 0.38 V, respectively.
4. Conclusions
Surface modification was carried out by using various surfactants, such as CTAB, HMT and PVP, during the growth process. Small amount of particular surfactant affected the structure, morphology and optical properties of the ZnO samples. The sample treated with HMT shows highly compact and high crystallinity, thus possess the highest absorption in the visible region and the lowest Eg. The PEC utilising the ZnO sample treated with HMT surfactant demonstrated the highest Jsc of 0.47 mAcm−2, Voc of 0.46 V, FF of 29.2% and η of 0.06%, respectively.
Acknowledgements
This work was supported by The Ministry of higher Education of Malaysia under research grant FRGS 011010118.
References
- Gratzel M. Photoelectrochemical cells. Nature. 2001;414:338–344.
- Zhang Q, Dandeneau CS, Zhou X, Cao G. ZnO nanostructures for dye-sensitized solar cells. Adv Mater. 2009;21:4087–4108.
- Grätzel M. Conversion of sunlight to electric power by nanocrystalline dye-sensitized solar cells. J Photochem Photobiol A: Chem. 2004;164:3–14.
- Grätzel M. Recent advances in sensitized mesoscopic solar cells. Acc Chem Res. 2009;42:1788–1798.
- Umar AA, Rahman MYA, Taslim R, Salleh MM, Oyama M. A simple route to vertical array of quasi-1D ZnO nanofilms on FTO surfaces: 1D-crystal growth of nanoseeds under ammonia-assisted hydrolysis process. Nanoscale Res Lett. 2011;6:564–575.
- Hu Y, Qian H, Liu Y, Du G, Zhang F, Wang L, Hu X. A microwave-assisted rapid route to synthesize ZnO/ZnS core-shell nanostructures via controllable surface sulfidation of ZnO nanorods. CrystEngComm. 2011;13:3438–3443.
- Wang S-F, Tseng T-Y, Wang Y-R, Wang C-Y, Lu H-C, Shih W-L. Effects of preparation conditions on the growth of ZnO nanorod arrays using aqueous solution method. Int J Appl Ceramic Technol. 2008;5:419–429.
- Sun M, Du Y, Hao W, Xu H, Yu Y, Wang T. Fabrication and wettability of ZnO nanorod array. J Mater Sci Technol. 2009;25:53–57.
- Mane RS, Lee W-J, Lokhande CD, Cho BW, Han S-H. Controlled repeated chemical growth of ZnO films for dye-sensitized solar cells. Curr Appl Phys. 2008;8:549–553.
- Jang J-H, Park J-H, Oh S-G. Effects of dodecyl sulfate anionic surfactants on the crystal growth of ZnO through hydrothermal process. J Ceram Process Res. 2009;10:783–790.
- Liu T-Y, Liao H-C, Lin C-C, Hu S-H, Chen S-Y. Biofunctional ZnO nanorod arrays grown on flexible substrates. Langmuir. 2006;22:5804–5809.
- Liu X, Jin Z, Bu S, Zhao J, Yu K. Preparation of ZnO nanorods and special lath-like crystals by aqueous chemical growth (ACG) method. Mater Sci Eng B. 2006;129:139–143.
- Zhu S, Chen X, Zuo F, Jiang M, Zhou Z, Hui D. Controllable synthesis of ZnO nanograss with different morphologies and enhanced performance in dye-sensitized solar cells. J Solid State Chem. 2013;197:69–74.
- Sui X, Liu Y, Shao C, Liu Y, Xu C. Structural and photoluminescent properties of ZnO hexagonal nanoprisms synthesized by microemulsion with polyvinyl pyrrolidone served as surfactant and passivant. Chem Phys Lett. 2006;424:340–344.
- Sun XM, Chen X, Deng ZX, Li YD. A CTAB-assisted hydrothermal orientation growth of ZnO nanorods. Mater Chem Phys. 2003;78:99–104.
- Rai P, Jo J-N, Lee I-H, Yu Y-T. Fabrication of flower-like ZnO microstructures from ZnO nanorods and their photoluminescence properties. Mater Chem Phys. 2010;124:406–412.
- Baruah S, Dutta J. Hydrothermal growth of ZnO nanostructures. Sci Technol Adv Mater. 2009;10:013001–103018.
- Zandi S, Kameli P, Salamati H, Ahmadvand H, Hakimi M. Microstructure and optical properties of ZnO nanoparticles prepared by a simple method. Physica B. 2011;406:3215–3218.
- Yogamalar NR, Srinivasan R, Bose AC, Multi-capping agents in size confinement of ZnO nanostructured particles. Opt Mater. 2009;31:1570–1574.
- Lin K-F, Cheng H-M, Hsu H-C, Lin L-J, Hsieh W-F. Band gap variation of size-controlled ZnO quantum dots synthesized by sol–gel method. Chem Phys Lett. 2005;409:208–211.
- Rahman MYA, Umar AA, Roza L, Salleh MM. Effect of optical property of surfactant-treated TiO2 nanostructure on the performance of TiO2 photoelectrochemical cell. J Solid State Electrochem. 2012;16:2005–2010.