Abstract
Glyoxalic acid was determined by electrochemical cyclic voltammetry method using copper germanate (CuGeO3) nanowires as the modified glassy carbon electrode (GCE) materials. The CuGeO3 nanowire modified GCE exhibited good detection performance for glyoxalic acid in neutral solution. The intensities of two anodic peaks vary linearly with the increase of the scan rate from 25 to 200 mVs−1 and glyoxalic acid concentration from 0.001 to 2 mM. The detection limit was 8.5 μM and 0.78 μM for cvp1 and cvp2 with the correlation coefficient of 0.991 and 0.998, respectively. The CuGeO3 nanowire modified GCE exhibited good reproducibility and stability.
1. Introduction
Glyoxalic acid is a kind of compound with a wide application in the fields of perfumery, pharmaceutical analysis, flavour and agrochemical industries. It was also used in the manufacture of intermediates, such as p-hydroxyphenyl glycine when derivatives of the acrylamidoglycolic acid prepared from glyoxalic acid were used in coatings and paints for automobiles.[Citation1] Therefore, it is necessary to analyse glyoxalic acid owing to the wide applications of glyoxalic acid in different fields. Tanenbaum et al.[Citation2] showed a specific analysis method for glyoxalic acid in micromolar quantities. The excess phenylhydrazine hydrochloride was added into the glyoxalic acid by the method. The mixture was then made strongly acidic and an oxidising agent was added. The appearance of a bright red colour indicated a positive test. Kramer et al.[Citation3] also reported a quantitative colourimetric method for the detection of glyoxalic acid which was based on the formation of intensely coloured 1,5-diphenylformazancarboxylic acid obtained from the mild oxidation of glyoxalic acid phenylhydrazone in the presence of excess phenylhydrazine. The linear range is 1–100 μM and the detection limit is 1 μM. However, the reported methods[Citation4,5] are insensitive and too tedious and time-consuming for the analysis of glyoxalic acid. Therefore, it is important to analyse the glyoxalic acid with low detection limit, rapid response and low cost.
Glassy carbon electrodes (GCEs) modified with different nanoscale materials have been used to directly detect different biological molecules by the electrochemical method due to the excellent sensitivity, rapid response, good convenience and low cost.[Citation6–8] The accurate detection of the concentration is of considerable importance, but the reliable sensing of glyoxalic acid by the conventional methods has been hindered. In our past research, copper germanate (CuGeO3) nanowires attracted special research interest because CuGeO3 nanowires exhibited excellent electrochemical properties for potential applications in nanoscale electrochemical sensors originated from the large surface area and special electronic structure.[Citation9] CuGeO3 nanowires on GCE surface mediate the final heterogeneous chemical oxidation or reduction of the target materials when the converted copper irons can be continuously recovered by the electrochemical oxidation or reduction. The CuGeO3 nanowires modified GCE exhibited good electrochemical detection ability for ascorbic acid and tartaric acid.[Citation10,11] Similar to ascorbic acid and tartaric acid, glyoxalic acid is also an important biological molecule for the application in perfumery, pharmaceutical analysis, flavour and agrochemical industries. Therefore, these stimulate our interest for the research of the electrochemical detection of the glyoxalic acid using CuGeO3 nanowire modified GCE.
In the paper, CuGeO3 nanowires were used as the GCE modified materials for the electrochemical detection of glyoxalic acid by cyclic voltammetry method. The linear range, detection limit, stability and reproducibility of the CuGeO3 nanowire modified GCE for the electrochemical detection of glyoxalic acid were analysed. The CuGeO3 nanowires provide the feasibility for the sensitive and fast process for the detection of glyoxalic acid.
2. Experimental procedure
2.1. Preparation of the CuGeO3 nanowire modified GCE
The CuGeO3 nanowires were synthesised by the hydrothermal deposition process which was described elsewhere.[Citation12] The hydrothermal deposition temperature and growth time were 250 ℃ and 12 h, respectively. The CuGeO3 nanowire suspension was prepared by dispersing 10 mg CuGeO3 nanowires in 10 mL dimethylformamide (DMF) solvent with sufficient ultrasonication for about 1 h until a relatively uniform nanowire suspension was obtained. Prior to modification, a GCE with the diameter of 3 mm was polished to a mirror using polish paper and alumina pastes of 0.5 μm, and cleaned thoroughly in an ultrasonic cleaner with alcohol and water sequentially. A CuGeO3 nanowire modified GCE was prepared by coating 10 μL nanowire suspension on the surface of bare GCE by the injector and dried for about 0.5 h using infrared lamp in air. Then the CuGeO3 nanowire modified GCE was obtained.
2.2. Characterisation methods
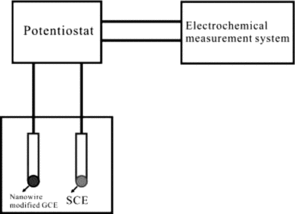
Scanning electron microscopy (SEM) observation was performed using JEOL JSM-6490LV SEM with a 15-KV accelerating voltage. Glyoxalic acid was purchased from Sinopharm Chemical Reagent Co., Ltd. of China which was analytical grade. Electrochemical (EC) measurement was performed in a model CHI6046 electrochemical working station. The schematic of the electrochemical working station is shown in . The CuGeO3 nanowire modified GCE served as the working electrode. Platinum plate and saturated calomel electrode (SCE) served as the counter electrode and reference electrode, respectively. All potentials in the study were reported with respect to SCE. Cyclic voltammograms (CVs) were recorded from −1.0 to 1.0 V at a potential scan rate of 50 mVs−1 in the mixed solution of 0.1 M KCl and glyoxalic acid with different concentrations.
3. Results and discussion
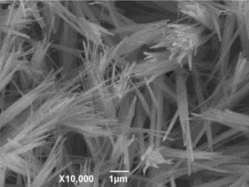
The surface state of the CuGeO3 nanowire modified GCE was shown in . The diameter of the CuGeO3 nanowires was from 50 nm to 200 nm. The CuGeO3 nanowires could form a dense film on the surface of the GCE by the dipping and drying process. Therefore, the glassy carbon substrate of the CuGeO3 nanowire modified GCE might have no effect on the electrochemical responses of the glyoxalic acid.
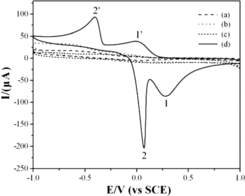
The electrochemical behaviours of glyoxalic acid at the CuGeO3 nanowire modified GCE in the potential range of −1.0–1.0 V had been analysed by the cyclic voltammetry method. indicated the CVs in 0.1 M KCl solution with and without glyoxalic acid at bare GCE and CuGeO3 nanowire modified GCE with a potential scan rate of 50 mVs−1. No electrochemical signals were observed from the CVs of the bare GCE in 0.1 M KCl solution with and without glyoxalic acid ((a) and (b)). No electrochemical CV peaks were also shown from the CV curves at the CuGeO3 nanowire modified GCE in 0.1 M KCl solution without glyoxalic acid ((c)). The result showed that the bare GCE and CuGeO3 nanowires had no electrochemical activity in 0.1 M KCl solution without glyoxalic acid. However, two pairs of electrochemical CV peaks were observed from the CV curve at the CuGeO3 nanowire modified GCE in the mixed solution of 0.1 M KCl and 2 mM glyoxalic acid. Two anodic CV peaks (cvp1, cvp2) at 0.28 V and 0.07 V, and two cathodic peaks (cvp1′, cvp2′) at −0.01 V and −0.41 V were observed, respectively ((d)). These CV peaks could only be observed from KCl solution with glyoxalic acid at the CuGeO3 nanowire modified GCE. Therefore, it was considered that the electrochemical CV peaks originated from the glyoxalic acid. CuGeO3 nanowires played an essential effect for the generation of the CV peaks. As we know, a reversible electrochemical reaction the CV recorded has certain well-defined characteristics. (i) The voltage separation between the current peaks is 60/n. (ii) The positions of peak voltage do not alter as a function of the scan rate. (iii) The ratio of the peak currents is equal to one. (iv) The peak currents are proportional to the square root of the scan rate. First of all, the data did not show above feathers which the reversible process should carry. Therefore, the electrochemical reaction of glyoxalic acid at the CuGeO3 nanowire modified GCE was considered to be a semi-reversible process. Two anodic CV peaks (cvp1, cvp2) were located at 0.20 V and 0.02 V from the CV curve of 2 mM ascorbic acid.[Citation10] And two anodic CV peaks (cvp1, cvp2) were located at 0.18 V and 0.02 V from the CV curve of 2 mM tartaric acid.[Citation11] Therefore, the potentials of the electrochemical CV peaks for anodic CV peaks were very different from those of the CV peaks in 2 mM tartaric acid and ascorbic acid solution showing different electrochemical activity in glyoxalic acid solution.
Figure 3. CVs of the bare GCE in 0.1 M KCl solution in absence (a) and presence (b) of 2 mM glyoxalic acid. CVs of the CuGeO3 nanowire modified GCE in 0.1 M KCl solution in absence (c) and presence (d) of 2 mM glyoxalic acid, scan rate, 50 mVs−1.
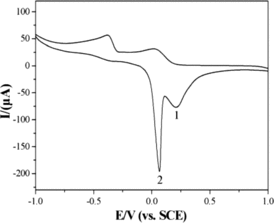
The experiments using the initial potential scan direction and different reversal potential were conducted in order to understand whether the anodic and cathodic peaks obtained from the CV curve were semi-reversible electrochemical reaction process. The intensities and potentials of the electrochemical CV peaks maintained same when changing the initial potential scan direction. However, the intensities of the electrochemical CV peaks changed very slightly when the potential scan reversed at different positive potential. Therefore, it was considered that the cvp1 and cvp2 were generated from the potential of cvp1′ and cvp2′, respectively.
The electrochemical behaviours of different biological molecules, such as tartaric acid and ascorbic acid at the CuGeO3 nanowire modified GCE exhibited two pairs of semi-reversible electrochemical CV peaks.[Citation10,11] Cvp1-cvp1′ was considered to be the oxidation and reduction process between tartaric acid and tartrate, ascorbic acid and dehydroascorbic acid, respectively. Similarly, cvp1-cvp1′ obtained from CuGeO3 nanowire modified GCE in glyoxalic acid solution was also considered to be the electrochemical oxidation and reduction process. Shende et al.[Citation13] showed that glyoxalic acid could be easily oxidised to be oxalic acid under the wet air oxidisation conditions. Richardson et al.[Citation14] also reported the oxidisation process of glyoxalic acid to oxalic acid. At the CuGeO3 nanowire modified GCE, CuGeO3 nanowires might participate in the reduction of glyoxalic acid. Therefore, cvp1-cvp1′ was considered to contribute to the oxidation and reduction process between glyoxalic acid and oxalic acid. The equation of the reducing reaction process for cvp1 and cvp1′ may be as follow: CuGeO3 nanowires+2H2C2O4 (glyoxalic acid) →CuGeO3 nanowires+2C2H2O3 (oxalic acid) + O2.
The adsorption and desorption behaviour of cysteine had been researched by impedance spectroscopy showing the adsorption and desorption behaviour of cysteine and cystine at the surface of gold electrode, respectively.[Citation15] The electrochemical responses of the tartaric acid and ascorbic acid at the CuGeO3 nanowire modified GCE also showed adsorption and desorption process.[Citation10,11] It was considered that the same thing happen to glyoxalic acid. Therefore, cvp2-cvp2′ was also assigned to be the adsorption and desorption process of glyoxalic acid and oxalic acid at the CuGeO3 nanowire modified GCE.
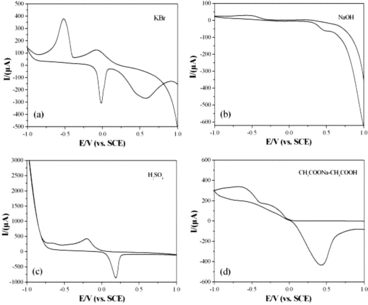
showed the electrochemical behaviours of the glyoxalic acid at the CuGeO3 nanowire modified GCE under various electrolytes with different pH value. KBr, NaOH (pH = 12), H2SO4 (pH = 2) and CH3COOH-CH3COONa (pH = 5) were used as the electrolytes in order to analyse the role of the electrolytes on the electrochemical behaviours. In neutral KBr solution with 2 mM glyoxalic acid, the electrochemical CV curve of the glyoxalic acid ((a)) was similar as that in KCl solution. However, the CV peak potential shifted to more negative direction indicating good electrocatalytic performance. The potential for cvp1 and cvp2 was +0.56 V and −0.02 V, respectively. In addition, the slightly difference on the intensities of CV peaks was also shown. No electrochemical CV peaks were shown in the alkaline solution ((b)). Glyoxalic acid was considered to react with NaOH to form sodium glyoxalic acid in alkaline solution. Therefore, the electrochemical reaction process from glyoxalic acid and oxalic acid was inhibited in alkaline solution. The result showed that the CuGeO3 nanowires had no electrochemical activity in alkaline solution. However, a broad and strong anodic peak appeared instead of cvp1 and cvp2 obtained in neutral solution when the experiments were conducted in acidic solution ((c) and (d)). The anodic peak potential located between the potential of cvp1 and cvp2. The CV peak intensity increased obviously with the increase of the acidity in the electrolytes. A broad cathodic peak was also shown between the potential of cvp1′ and cvp2′ in acidic solution. Therefore, it was considered that the hydrogen ions might participate in the electrochemical reaction of the glyoxalic acid which was similar to that of other biological molecules at the CuGeO3 nanowire modified GCE. In acidic condition, the cvp1 intensity increased greatly with the decrease of pH value and overlapped with cvp2. Only one pair of broad and strong CV peaks were obtained.
Figure 4. CVs of the CuGeO3 nanowire modified GCE in the mixed solution of 2 mM glyoxalic acid and different electrolytes. Scan rate, 50 mVs−1. (a) KBr, (b) NaOH, (c) H2SO4, (d) CH3COONa-CH3COOH.
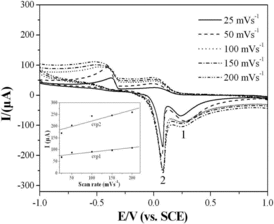
Previous reports[Citation16,17] showed that scan rate played important role on the electrochemical responses of biological molecules at different modified GCEs. The effect of the scan rate on the electrochemical behaviours of the glyoxalic acid at the CuGeO3 nanowire modified GCE has been researched using the scan rate from 25 to 200 mVs−1. showed the CV curves of 2 mM glyoxalic acid in 0.1 M KCl solution at the CuGeO3 nanowire modified GCE. The potentials of the anodic and cathodic CV peaks for the glyoxalic acid were very similar. However, with the scan rate increasing from 25 to 200 mVs−1, the intensities of the CV peaks increased obviously. The role of the scan rate on the current of the CV peaks was also analysed which was shown in the bottom-left part of . There was a linear relationship between the anodic current and scan rate in the range of 25–200 mVs−1. The adsorption process took the feather of linear relationship between the anodic current and scan rate.[Citation18,19] Therefore, the result showed that the kinetic of the overall process was controlled by an adsorption process. Therefore, scan rate can promote the electrochemical reaction between glyoxalic acid and oxalic acid which is similar to that of tartaric acid and ascorbic acid at the CuGeO3 nanowire modified GCE.[Citation10,11]
Figure 5. CVs of the CuGeO3 nanowire modified GCE in the mixed solution of 0.1 M KCl and 2 mM glyoxalic acid using different scan rates. The inset in the bottom-left part is the calibration plots of the intensities of anodic peaks against the scan rate.
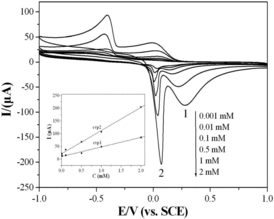
The linear range and detection limit were determined by series of different CV curves of glyoxalic acid with different concentrations at the CuGeO3 nanowire modified GCE. showed the CVs of glyoxalic acid in the concentration range from 0.001 to 2 mM. The bottom-left part of showed the calibration plots of the intensities of anodic peaks and the glyoxalic acid concentration. The intensities of the CVs of the glyoxalic acid at the CuGeO3 nanowire modified GCE increased obviously with the increase of the glyoxalic acid concentration. The linear range, correlation coefficient and detection limit of the glyoxalic acid were analysed in the concentration range from 0.001 to 2 mM which was shown in . The linear range is 0.01–2 mM and 0.001–2 mM for cvp1 and cvp2, respectively. The correlation coefficient is 0.991 and 0.998 for cvp1 and cvp2, respectively. The detection limit is 8.5 μM and 0.78 μM for cvp1 and cvp2, respectively at a signal-to-noise ratio of 3. Comparing with the detection limit of the glyoxalic acid by other methods,[Citation2,3] the CuGeO3 nanowire modified GCE takes the advantage of low detection limit.
Table 1. Analytical data of the glyoxalic acid.
Figure 6. CVs of the glyoxalic acid with different concentrations at the CuGeO3 nanowire modified GCE. KCl, 0.1 M, scan rate, 50 mVs−1. The inset in the bottom-left part is the calibration plots of the intensities of anodic peaks against the concentrations of the glyoxalic acid.
The relative standard deviation (RSD) was 6.44% and 2.69% for cvp1 and cvp2, respectively when the same CuGeO3 nanowire modified GCE repeated the detection of 2 mM glyoxalic acid for the 20th time in 0.1 M KCl solution (). The CuGeO3 nanowires could be adsorbed firmly on the GCE. Therefore, the reproducibility and stability of the CuGeO3 nanowire modified GCE were good which could contribute to the structure stability. The CuGeO3 nanowire modified GCE could be used at least for two weeks with only slightly decline in the electrochemical signal.
4. Conclusions
In summary, the electrochemical detection performance for glyoxalic acid using the CuGeO3 nanowire modified GCE has been researched by cyclic voltammetry method. The electrochemical behaviours of glyoxalic acid at the modified GCE showed that two pairs of semi-reversible electrochemical CV peaks were observed. Two anodic CV peaks (cvp1, cvp2) were located at 0.28 V and 0.07 V, and two cathodic peaks (cvp1′, cvp2′) were observed at −0.01 V and −0.41 V, respectively. The intensity of the CV peaks increased linearly with the increase of glyoxalic acid concentration ranging in 0.001–2 mM and scan rate ranging in 25–200 mVs−1. The linear range and detection limit were 0.01–2 mM, 0.001–2 mM and 8.5 μM, 0.78 μM for cvp1 and cvp2, respectively. CuGeO3 nanowires had no electrochemical activity in alkaline solution, and the CV peak intensity increased obviously with the increase of the acidity of the electrolytes.
Acknowledgements
This work was supported by the Natural Science Foundation of the Education Bureau of Anhui Province of China (KJ2012Z038), Natural Science Foundation of Anhui Province of China (1308085ME72) and Postgraduate Supervisor Innovation Fund Project by Anhui University of Technology (D201101).
References
- Yadav GD, Gupta VR. Synthesis of glyoxalic acid from glyoxal. Process Biochem. 2000;36:73–78.
- Tanenbaum M, Bricker CE. Microdetermination of free formaldehyde. Anal Chem. 1951;23:354–357.
- Kramer DN, Klein N, Baselice RA. Quantitative determination of glyoxalic acid. Anal Chem. 1959;31:250–252.
- Johnson GRA, Scholes G, Weiss J. Chemical action of ionsing radiations in solution. Part XI. The action of free radicals, produced by X-rays, on lactic acid in aqueous solution with particular reference to the effect of molecular oxygen. J Chem Soc. 1953;616:3091–3099.
- Metzler DE, Snell EE. Some transamination reactions involving vitamin B61. J Am Chem Soc. 1952;74:979–983.
- Guth U, Vonau W, Zosel J. Recent developments in electrochemical sensor application and technology-a review. Meas Sci Technol. 2009;20:042002.
- Yuan DS, Zhou TX, Zhou SL, Zou WJ, Mo SS, Xia NN. Nitrogen-enriched carbon nanowires from the direct carbonization of polyaniline nanowires and its electrochemical properties. Electrochem Commun. 2011;13:242–246.
- Szunerits S, Coffinier Y, Galopin E, Brenner J, Boukherroub R. Preparation of boron-doped diamond nanowires and their application for sensitive electrochemical detection of tryptophan. Electrochem Commun. 2010;12:438–441.
- Dong YP, Pei LZ, Chu XF, Zhang WB, Zhang QF. Electrochemical behavior of cysteine at a CuGeO3 nanowires modified glassy carbon electrode. Electrochim Acta. 2010;55:5135–5141.
- Pei LZ, Xie YK, Cai ZY, Yang Y, Pei YQ, Fan CG, Fu DG. Electrochemical behaviors of ascorbic acid at copper germanate nanowire modified electrode. J Electrochem Soc. 2012;159:K55–K60.
- Cai ZY, Pei LZ, Yang Y, Pei YQ, Fan CG, Fu DG. Electrochemical behavior of tartaric acid at CuGeO3 nanowire modified glassy carbon electrode. J Solid State Electrochem. 2012;16:2243–2249.
- Pei LZ, Zhao HS, Tan W, Yu HY, Chen YW, Zhang QF, Fan CG. Low temperature growth and characterizations of single crystalline CuGeO3 nanowires. CrystEngComm 2009;8:1696–1701.
- Shende RV, Mahajani VV. Kinetics of wet air oxidation of glyoxalic acid and oxalic acid. Ind Eng Chem Res. 1994;33:3125–3130.
- Richardson KE, Tolbert NE. Oxidation of glyoxylic acid to oxalic acid by glycolic acid oxidase. J Biol Chem. 1963;236:1280–1284.
- Hager G, Brolo AG. Protonation and deprotonation of cysteine and cystine monolayers probed by impedance spectroscopy. J Electroanal Chem. 2009;625:109–116.
- Li Y, Zhan SH. Electrochemical behaviors of ascorbic acid and uric acid in ionic liquid. J Disp Sci Technol. 2008;29:1421–1425.
- Xia C, Ning W. A novel bio-electrochemical ascorbic acid sensor modified with Cu4(OH)6SO4 nanorods. Analyst. 2011;136:288–292.
- Sehlotho N, Nyokong T. Electrocatalytic oxidation of thiocyanate, L-cysteine and 2- mercaptoethanol by self-assembled monolayer of cobalt tetraethoxy thiophene phthalocyanine. Electrochim Acta. 2006;51:4463–4470.
- Davis J, Moorcroft M, Wilkins SJ, Compton RG, Cardosi MF. Electrochemical detection of nitrate and nitrite at a copper modified electrode. Analyst. 2000;125:737–742.

