
Abstract
Polyethyleneimine (PEI) conjugates with a range of nanocarbons (NCs) have been prepared, and their performances with regard to carbon dioxide absorption and liberation are compared. PEI-functionalised multi-walled carbon nanotubes (PEI-MWNTs) prepared by the reaction of branched PEI (25,000 Da) with F-MWNTs in the presence of pyridine, showed a lower CO2 capacity at 25 °C (5 wt%, 1.1 mmol CO2/g adsorbent) as compared to PEI-SWNTs (9.2 wt%, 2.1 mmol CO2/g adsorbent), consistent with the interior layers of the MWNTs adding weight to the base NC without adding functionality. PEI-functionalised graphite/graphene was prepared by three routes: fluorinated graphite intercalation compounds, prepared from natural graphite powder, were reacted with PEI in EtOH with pyridine; exfoliated natural graphite powder was reacted with Boc–Phe(4-N3)–OH, and subsequently PEI to give PEI-Phe(4-N-G); graphite oxide (GO) was reacted with PEI in the presence of NEt3 to give PEI-GO. The CO2 capacity of PEI-GO at 25 °C (8 wt%, 1.8 mmol CO2/g adsorbent) was comparable to that of PEI-SWNTs making GO a valid and cheaper alternative to the SWNT scaffold. The temperature of CO2 desorption of the PEI-NCs was 75 °C, providing a lower energy load for regeneration compared to current amine-based scrubbing units. The rate of CO2 uptake is seen to depend on the curvature of the NC substrate.
1. Introduction
In 1997 the United Nations introduced the Kyoto protocol, the goal of which was to mandate the largest greenhouse gas emitters in the world to reduce their emissions of the four main gases responsible for an increase in the greenhouse effect: CO2, CH4, N2O, and SF6. Among the greenhouse gases, carbon dioxide is not the most damaging of the greenhouse gases when compared in equal concentrations; however, the concentration of CO2 in the atmosphere is the highest of the greenhouse gases. There are several ways that CO2 is emitted into our atmosphere, including the burning of fossil fuels, chemical reactions (e.g., the manufacture of cement), along with natural sources such as volcanic eruptions.
Carbon capture and sequestration (CCS) refers to technologies to both capture CO2 from a point source and store it, thereby preventing it from entering the atmosphere.[Citation1] There are several possibilities for storage of CO2. Another option for the use of captured CO2 is in the area of enhanced oil recovery (EOR).[Citation2] Troublingly, the scope of global CO2 emissions (estimated to be 23.5 GtCO2 yr−1) makes any CCS approach seem overwhelming and difficult to realise in an economically viable manner.[Citation2] However, there is one area of carbon capture that is localised in scope and has a high potential economic, environmental, and safety impact: the removal of CO2 from natural gas. The presence of CO2 in natural gas is one of the main causes (along with associated water) of corrosion in gas pipelines. The US Department of Transportation Office of Pipeline Safety has estimated that CO2-based corrosion is responsible for 15% of pipeline accidents, resulting in over $3million annual damage, as well as many fatalities.[Citation3] Thus, this application offers a worthwhile challenge to the development of new carbon capture technologies.
In general there are several different types of carbon capture techniques under investigation. These systems utilise adsorption, absorption, membrane diffusion, and cryogenic distillation as their mechanisms of action. However, each system has particular drawbacks. In the case of CO2 adsorption from natural gas streams, the regeneration temperature ofthe system should be as low as possible to avoid energy penalties associated with regeneration.[Citation4]
The adsorption process for the capture of CO2 is based upon the ability of CO2 to adsorb into pores or onto the surface of the particular sorbent, such as zeolites, molecular sieves, or activated carbons. However, several are the drawbacks to an adsorption-based system. The adsorption processes can only handle relatively low concentrations of CO2.[Citation5] Furthermore, water can have a dramatic influence on the adsorption capacities due to competitive adsorption between water and CO2.[Citation6] In the case of natural gas sources, water content can vary significantly, and the CO2 content can vary from as low as 0.9% in the Groningen in The Netherlands to as high as 46.2% in the Uch reservoir in Pakistan.[Citation7] There are several different types of membranes in development for the capture of CO2,[Citation5] as well as cryogenic distillation, which is an energy intensive process.[Citation8]
The best present commercial process for the large-scale capture involves monoethanolamine (MEA), which is an aqueous-based capture technique generally composed of a 30% solution of MEA in water. The CO2 source is passed through a liquid amine to form a carbamate (Equation (1)), among other possible species.[Citation9]
(1) While there are advantages to this method, such as scalability, there are also several drawbacks. The CO2 loading capacity of a general MEA scrubber system is ca. 7 wt%. While an increase in the concentration of MEA does lead to a higher gravimetric capacity, it also causes the system to become corrosive. In addition, in order to regenerate the MEA scrubber, the solution needs to be heated to 120 °C, a manipulation that is responsible for up to 75% of the total operating cost of the system.[Citation4] In order to make a CO2 scrubber system more economically viable, a lower temperature regeneration system is required. Furthermore, as the MEA system is solvent based, the solution has to be constantly pumped from one tower to another for absorption and regeneration. The solvent used also has to be constantly replaced due to evaporation, as the system has to be heated to high temperatures ca. 120 ºC to regenerate the scrubber. A second option for the deployment of amines is to tether them to a solid support, and different materials have been investigated.[Citation10]
Efforts have been made to improve on the traditional amine system by using ionic liquids,[Citation11] as well as making solid supported amines.[Citation12–17] However, there is no significant decrease in the desorption temperature of the CO2. We have recently reported that when polyethyleneimine (PEI, I) was covalently bonded to single-walled carbon nanotubes (SWNTs) the CO2 uptake was enhanced as compared to the polymer itself.[Citation18] Based upon these initial results we have proposed that other high surface area carbon nanomaterials such as multi-walled carbon nanotubes (MWNTs), graphene, and other nano-graphite materials should provide the potential for further improvements in absorption uptake. A secondary goal of this research was to understand the effect of the carbon nanomaterial structure in activating the PEI and determining if it is the carbon surface in general or SWNTs in particular. Finally, it is important to find a more economically viable source of carbon nano-support than SWNTs to facilitate scale-up and testing.
2. Experimental procedure
2.1. Materials
Branched PEI (Mw = 25,000 Da) (Aldrich), EtOH (Decon Labs), pyridine (Aldrich), triethylamine (Aldrich), ortho-dichlorobenzene (EMD), chloroform (Aldrich), N,N′-dicyclohexylcarbodiimide (Aldrich), Boc-Phe(4-N3)-OH (Chem Impex International), natural graphite powder 99.999% pure (Alfa Aesar) and multi-walled nanotubes (Baytubes) were all used as received. All water was ultrapure, obtained from a Millipore Milli-Q ultraviolet (UV) water filtration system. Fluorinated multi-walled carbon nanotubes (F-MWNTs) were prepared by the previously reported method.[Citation19] Graphite oxide (GO) was obtained with the Tour method.[Citation20]
2.2. Characterisation
Characterisation was performed using an FEI XL30 Schottky field-emission environmental scanning electron microscope (ESEM) with energy dispersive X-ray (EDX) spectroscopy capability and a JEOL 6500F thermal field-emission scanning electron microscope. These were used at an accelerating voltage of 5 kV. Samples were mounted with carbon tape onto aluminium microscopy specimen mounts (Electron Microscopy Sciences). Before imaging, insulating samples were sputter-coated (Plasma Sciences CRC 100 sputter coater) with a thin layer of gold or chromium to prevent charging. X-ray photoelectron spectra (XPS) were acquired on a PHI 5700 ESCA system (Physical Electronics) at 15 kV, using an aluminium target and an 800 μm aperture. Samples were pressed into indium metal. Transmission electron microscopy (TEM) was performed with a JEOL 2010 instrument at 100 kV utilising a JEOL FasTEM system. Samples were dropped onto Cu grids with lacy carbon film (Electron Microscopy Sciences) and allowed to dry thoroughly before imaging. Raman spectroscopy on solids (both 633 and 514 nm excitation) was performed using a Renishaw Invia Raman microscope. Samples were mounted on double-sided tape. Attenuated total reflectance infrared spectroscopy (ATR-IR, 4000–600 cm−1) of solids was obtained using a Nicolet Nexus 670 FT-IR with a diamond window. UV–visible (UV-vis) spectra (200–1400 nm) were collected using a Cary 5000 UV/vis-NIR spectrometer using quartz cuvettes. Atomic force microscopy (AFM) was performed using a Veeco Nanoscope IIIA. Thermal analysis was performed on a Seiko TG/DTA 200 using aluminium pans.
2.3. Synthesis of PEI-MWNT
Covalent functionalisation of MWNTs was achieved through the reaction of branched PEI with F-MWNTs by dispersing F-MWNTs (20 mg) in EtOH (25 mL) with probe sonication for 20 minutes. Concurrently 500 mg of PEI was dispersed in EtOH. These solutions were combined in a 100 mL round-bottomed flask fitted with a condenser and a magnetic stir bar. Pyridine (1 mL) was added to the reaction mixture and the reaction was brought to reflux, ca. 24 hours, with continuous stirring. Upon completion of the reaction, MWNT recovery was achieved by filtration of the reaction mixture through a 0.2-μm membrane polytetrafluoroethylene (PTFE) filter (Cole Parmer). The filtrate was washed with copious amounts of absolute EtOH followed by deionised water to remove pyridine and any unreacted polymer.
2.4. Reaction of PEI with fluorinated graphite
Natural graphite powder was fluorinated in a custom-built fluorination reactor, using a flow gas of 10% fluorine in nitrogen.[Citation19] The flow rate was set to 15 sccm. In addition a flow of 2% H2 in nitrogen was introduced into the reactor at a flow rate of 10 sccm. Once the reaction was complete, the F2 and H2 were turned off and the reactor was then purged with Ar at 1000 sccm for a period of about 15 min. Vacuum was then pulled on the system for a period of 15 min. Argon was then flowed back into the reactor and the reactor was opened and the sample was removed. Freshly fluorinated graphite intercalation compounds (GICs) (100 mg) were dispersed in EtOH (100 mL) via bath sonication. Branched PEI (500 mg) was dispersed in EtOH via bath sonication. The two solutions were combined and pyridine (ca. 1 mL) was added to the reaction. The reaction was heated to reflux temperature with constant stirring for five days. After vacuum filtration through a 0.2-μm pore size PTFE filter and washing with EtOH and deionised water, the sample was oven dried at ∼120ºC.
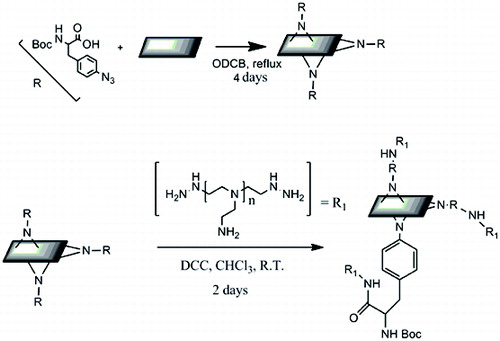
2.5. Synthesis of PEI-Phe(4-N-G)
Initially natural graphite powder (100 mg) was exfoliated into ortho-dichlorobenzene (50 mL) via probe sonication for approximately two hours. Boc–Phe(4-N3)–OH (100 mg, II) was added with vigorous stirring and the solution was brought to reflux for a period of four days. The product was recovered via filtration through a 0.2-μm pore size PTFE filter. The Phe-modified graphite was then dispersed in chloroform (50 mL), to this solution N,N′-dicyclohexylcarbodiimide (DCC, 100 mg) was added and allowed to stir for approximately two hours. Concurrently, branched PEI (1.0 g) was solubilised in chloroform. These two solutions were then combined and vigorously stirred for a period of 24 hours at room temperature. The product was recovered via vacuum filtration through a 0.2-μm PTFE filter and washed with copious amounts of chloroform to remove any unreacted DCC or PEI.
2.6. Reaction of PEI with graphite oxide
Branched PEI (1.0 g) was dispersed in EtOH (100 mL) via bath sonication. To this solution was added triethylamine (200 μL). Concurrently, GO (100 mg) was dispersed in water (100 mL). The two solutions were added together and heated to reflux for a period of five to seven days with constant stirring. Recovery of the PEI-GO was achieved by filtering the product solution through a 0.2-μm PTFE filter paper and washed with copious amounts of EtOH and H2O. For CO2 absorption experiments, the recovered PEI-GO was allowed to dry in an oven at 120 °C for a period of one hour to remove any water or residual CO2.
2.7. CO2 absorption
CO2 absorption experiments were carried out on a Seiko TG/DTA 200 using atmospheric pressure CO2. The general procedure for the absorption experiments is described as follows. PEI-functionalised nanocarbons (PEI-NCs), 5–10 mg, were loaded into an aluminium thermogravimetric analysis (TGA) pan and placed on the balance arm of the TGA. The chamber was sealed and purged with a steady flow of Ar (80 sccm). The temperature of the system was ramped from room temperature to 110 °C at a rate of 5 °C min−1 in order to de-gas and dehydrate the sample. After the mass decrease stabilised to a constant weight, the gas in the system was changed to CO2 (20 sccm). Upon changing gases an immediate increase in weight was observed indicating that the PEI-NCs were adsorbing the CO2. The CO2 flow was continued until constant weight was attained. To determine the effects of the temperature, the sample was brought to the desired temperature value after a constant weight had been reached.
3. Results and discussion
In our studies of PEI-SWNTs [Citation18] we investigated the effects of the PEI molecular weight on the CO2 absorption capacity. It was found that the use of higher molecular weights (i.e., 25,000 Da) gave the highest absorption as measured by the CO2:PEI ratio. As a consequence of this, we have used 25,000 Da molecular weight branched PEI in all the present studies to provide a suitable comparison with the PEI-SWNTs.
3.1. PEI-MWNT
Our previous synthesis of PEI-SWNTs involved the reaction of fluorinated-SWNTs (F-SWNTs) with an ethanol solution of PEI in the presence of pyridine.[Citation18] Proof of covalent attachment of amine functions to fluorinated SWNTs has also been given previously.[Citation21] In our current study, the same approach was initially taken with MWNTs (see Section 2).
The Raman spectra of as received MWNTs and PEI-MWNTs are shown in . As may be seen from the spectra, the D:G ratio actually decreases from 0.94 to 0.50 after PEI functionalisation. This is an opposite trend to that seen when SWNTs are modified by the same method.[Citation18] We speculate that the fluorination process actually ‘cleans’ the raw MWNTs via the removal by pyrolysis of small amounts of amorphous carbon that are present in the crude raw MWNT sample. This would occur in a similar manner to which nanotubes can be cut via fluorination and subsequent pyrolysis. Despite the apparent decrease in the D:G ratio suggesting a decrease in the sp3:sp2 carbon ratio the XPS studies indicate the presence of nitrogen, which was not present in the raw MWNT XPS spectrum (). Furthermore, the presence of a peak associated with C–N at 286.2 eV in the C1s region indicates the presence of PEI ().
Table 1. XPS elemental analysis of PEI-functionalised nanocarbon (NC) materials and calculated weight percentage of NC determined by TGA.
Figure 1. Raman spectra at 633 nm of (a) MWNTs and (b) PEI-MWNTs.
Figure 2. C1s X-ray photoelectron spectrum of PEI-MWNTs showing the presence of C–N bonding at 286.2 eV.
The surface coverage of the PEI polymer on the MWNTs was visualised by AFM and TEM. AFM analysis of a typical individual PEI-MWNT, after spin coating from aqueous solution onto a cleaved mica substrate, shows the polymer coating in patches on the MWNT (). The presence of polymer coating was also confirmed with TEM (). A similar structure was observed for the PEI-SWNTs.[Citation18] We have suggested that this regional functionalisation is in part a consequence of the band-like fluorination.[Citation22] The height difference between unfunctionalised and functionalised regions is 5 nm (Figure S1 available via the article website), which is the same delta as observed in PEI-SWNTs.[Citation18] SEM analysis of PEI-MWNTs shows what looks like large globular aggregatedstructures ((a)). Closer analysis reveals that each large aggregate is composed of bundled PEI-MWNTs ((b)). Such bundling would be expected if regions of the MWNTs remained unfunctionalised.
Figure 3. (Colour online) AFM image of a PEI-MWNT showing polymer ‘globules’ on the nanotube.
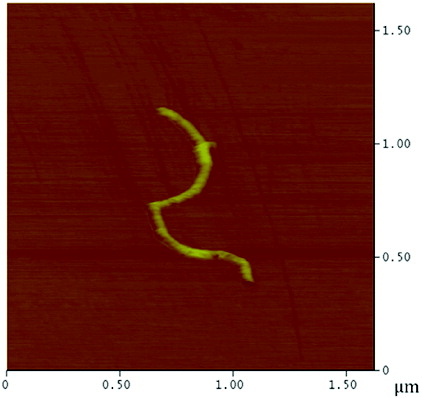
Figure 4. TEM image of PEI-MWNT.
Figure 5. SEM analysis of PEI-MWNTs showing (a) large aggregates each composed of bundles of PEI-MWNTs (b).
As with PEI-SWNTs, carbon dioxide is adsorbed by the PEI-MWNTs. The CO2 capacity at atmospheric pressure and 25 °C of PEI-MWNTs was determined by TGA. As can be seen from the TGA curve (), the absorption capacity of PEI-MWNTs is ca. 5 wt% by weight (or as is ordinarily stated 1.1 mmol CO2/g adsorbent), which is lower than the capacity achieved with PEI-SWNTs (see ).
Table 2. Absorption efficiency of PEI-functionalised nanocarbon materials.
Figure 6. TGA showing CO2 absorption capacity of PEI-MWNT (∼5 wt%).
However, it is expected that, even with similar PEI coverage, the absorption capacity of the PEI-MWNTs would be less than that of the PEI-SWNTs since the interior layers of the MWNTs are not functionalised and hence add weight to the base NC without adding functionality (potential CO2 absorption). Despite the lower absorption capacity for the PEI-MWNTs as compared to the single-walled analogues, the temperature of desorption is similar (i.e., 75 °C). This result suggests that the enhanced effects of the carbon nanomaterial observed for PEI-SWNTs over the free polymer are indeed a function of the carbon surface irrespective of the size (surface curvature) of the nanotube.
The absorption of CO2 by the PEI-NC materials appears to follow a first-order rate kinetics in the initial 30 min. From the appropriate plot (), the rate constant (k1) may be determined, where mt is the weight of adsorbent + CO2 at time t and m0 is the starting weight of the adsorbent without CO2 (). The slope of the line is positive since the absorption rate is expressed in terms of weight of product, i.e., adsorbed CO2. It is interesting to note that the adsorption rate constant for PEI-MWNTs is lower than that for PEI-SWNTs ().
Figure 7. Determination of the rate coefficient (2.67 × 10⁻⁵ s−1) for the CO2 absorption by PEI-MWNTs (R2 = 0.998).
While MWNTs are significantly cheaper than SWNTs and showed similar reactivity, MWNTs are still relatively expensive in comparison to other NC materials, such as graphite. To further reduce the overall cost of the system several PEI-graphite carbon materials were synthesised.
3.2. PEI-GIC
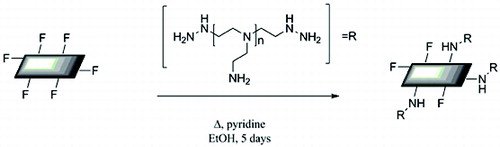
The fluorination of GICs is proposed to result in ionic (rather than covalent) interaction between carbon and fluorine.[Citation23] These ionic carbon fluorine bonds are very labile so characterisation and further reactions need to be carried out rapidly to avoid fluorine loss (as evidenced by the etching of their glass containers from the HF by-product). Fluorination of natural graphite powder [Citation19] resulted in a material of composition C:F = 11–21. Freshly fluorinated GICs dispersed in EtOH were reacted with an EtOH solution of PEI in the presence of pyridine () to yield PEI-functionalised GIC (PEI-GIC).
Scheme 1. Reaction of PEI with fluorinated graphite intercalation compounds (GICs).
The Raman spectrum of pristine graphite has no D band ((a)) that is indicative of a defect-free graphitic starting material (i.e., low carbon sp3 content). The appearance of a small D peak after fluorination indicates a low degree of functionalisation (b). The D:G ratio observed upon fluorination (0.11) does not change significantly upon reaction with PEI (0.16), see (c). Unlike GO and other functionalised graphenes (see below), there is no loss of the two-dimensional (2D) peak, ca. 2700 cm−1, indicating no basal plane functionalisation had occurred during fluorination or subsequent reaction with PEI. This should mean a low degree of functionalisation, which is confirmed by TGA showing only 5% of the total mass of PEI-GIC, which is due to the polymer ().
Figure 8. Raman spectra (514 nm) of (a) graphite, (b) F-GIC, and (c) PEI-GIC.
The XPS analysis () indicates the removal of fluorine and the attachment of PEI, as envisaged by the appearance of an N1s signal and the presence of a shoulder in the C1s peak associated with the aliphatic C-NHR amine groups in the PEI at 286.3 eV (Figure S2 available via the article webpage). However the percentage of nitrogen in the sample is quite low (ca. 4%) when compared to PEI-SWNTs and PEI-MWNTs.
Estimating the average size of the PEI-graphites proved to be difficult due to the fact that both graphene-like materials and large aggregates were produced. After solubilisation in water by bath and probe sonication, the samples were spin coated onto a cleaved mica substrate for AFM analysis and onto RCA–cleaned silicon for SEM imaging. As is typified by the TEM image in , the majority of the PEI-GIC was a graphene-like material with an average sheet size of 1–2 μm. We believe the reason for this is due to the minimal functionalisation achieved by the GIC method. This results in a minimal coverage by PEI leading to only the smallest sizes being solubilised. Further evidence comes from AFM analysis with only small sheets being visible (Figure S3).
Figure 9. STEM image of PEI-GIC showing the presence of PEI (appearing as black shapes and confirmed by EDX).
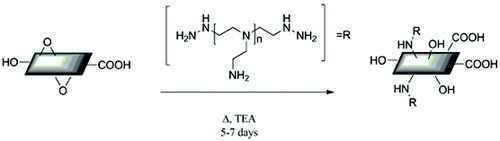
The strain induced by the curvature in SWNTs and MWNTs is a driving force for the reaction of amines with fluorinated NCs. This strain is not present in fluorinated graphitic materials and hence the reaction does not proceed to the same degree as with F-SWNTs and F-MWNTs. Another reason for the lack of PEI functionalisation is due to the difficulty in controlling the fluorination at low temperatures (<400 °C). When graphite is fluorinated at low temperatures, no covalent bonds are formed between the carbons on the basal plane of graphite with fluorine. Instead, a ‘semi-ionic’ bond is formed. This leads to a much less reactive material when compared to F-SWNTs and F-MWNTs, as in these systems covalent bonds are formed, which make neighbouring carbon more electrophilic due to the electronegativity of fluorine. The increase in the D:G ratio after fluorination ((a) and (b)) is probably due to covalent bonds between fluorine and the carbons on the edge of the graphite sheets. Since the entire basal plane will not be functionalised, the edges allow for attachment of PEI but in very low concentrations. This conclusion was confirmed by synthesising graphite epoxide,[Citation24] and then reacting it with PEI. Previous studies [Citation24] have shown that when graphite epoxide is synthesised the oxidation takes place on the edges of the sheet and not on the basal plane. The product of reactions with PEI showed a similar degree of functionalisation by TGA to PEI-GICs, indicating that PEI was only added to the edges and not the basal plane.
Although the PEI-GICs do show uptake of CO2 (), the amount is very low at less than 1% by weight (). We believe this is due to the reactivity of the F-GIC and difficulties in controlling the fluorination reaction and hence the PEI content. One important observation, however, is that the rate of CO2 absorption is over a magnitude slower than that for either PEI-MWNTs or PEI-SWNTs (). Given that the rate should not be dependent on the amount of functionalisation per NC, it is possible that the location of the PEI on the GIC results in insufficient activation of the PEI.
Figure 10. TGA showing the CO2 absorption capacity of PEI-GIC (∼1 wt%).
3.3. PEI-Phe(4-N-G)
To overcome the low density of functionalisation of PEI-GIC, a different graphitic starting material must be used that allows for the functionalisation of the entire graphite sheet rather than just the edges. Previous work in the Barron lab has shown that exfoliated graphite can be highly functionalised using azide modified phenylalanine.[Citation25] Azido starting materials can be decomposed into highly reactive nitrenes capable of high-density functionalisation of the basal plane of graphite. Our initial attempt involved converting some of the amine groups of branched PEI to azides. The first step was to synthesise the diazo transfer reagent, imidazole sulfonyl azide, which allows for the conversion of primary amines to azides.[Citation26] Our goal was that 10% of the primary amines would be converted to azides; however, due to the large molecular weight of the PEI this modification proved challenging. While the presence of azido moieties was detectable by FTIR (a band at 2100 cm−1 associated with the azide asymmetric stretch), the reaction with exfoliated graphite proved totally unsuccessful. Therefore, instead of the azido-PEI route, it was decided to use a modified version of the previously published method [Citation25] to functionalise graphite (G) with Boc–Phe(4-N3)–OH. The PEI was then coupled onto the Boc–Phe(4-N-G)–OH using a DCC coupling reaction (), see Section 2.
Scheme 2. Synthesis of PEI-Phe (4-N-G) from aza-Phe and exfoliated graphite (Phe is Boc protected at the alpha nitrogen).
As can be seen from the XPS spectra (), the modification of graphite with Boc-Phe-azide was successful as is evidenced large C–N contribution in the C1s signal and the presence of significant oxygen in the spectrum, which comes from the carboxylic acid in Phe and in the Boc protecting group (). DCC coupling of PEI onto Boc-Phe(4-N-G) has been achieved (see Experimental) and was confirmed by XPS, which shows that the presence of amine nitrogen (C-NHR) increases significantly from 27.8% to 56.1%, consistent with the addition of PEI. Furthermore, in the O1s spectrum of PEI-Phe(4-N-G) the signal from the carboxylic acid, 533.3 eV, decreases from 37.0% to 10.1%, indicating successful DCC coupling ((d)). While TGA further confirms a high degree of functionalisation (ca. 57% PEI, see Table 1), we note that this number is an estimate since the Boc-Phe is also decomposing in the same temperature window as PEI, and thus will overestimate the PEI content.
Figure 11. High-resolution C1s (a and c) and O1s (b and d) spectra of phenylalanine modified graphite (a and b) and PEI-Phe(4-N-G) (c and d).
The AFM analysis of PEI-Phe(4-N-G) ( and S4) shows multilayer graphite-like material. Sectional analysis indicates a height of ∼150 nm, which suggests graphite rather than graphene. Small aggregates were observed with X–Y dimensions ranging from 2 to 20 μm, which is larger than those observed for PEI-GICs. We propose that this is due to the higher degree of functionalisation, and hence larger flakes can be solubilised. The AFM image also shows PEI on the surface of sheets while also showing chains of PEI linking multiple sheets. SEM imaging of PEI-Phe(4-N-G) appears to confirm the AFM results, with many large aggregates visible ().
Figure 12. (Colour online) AFM image of PEI-Phe(4-N-G) with PEI linkages.
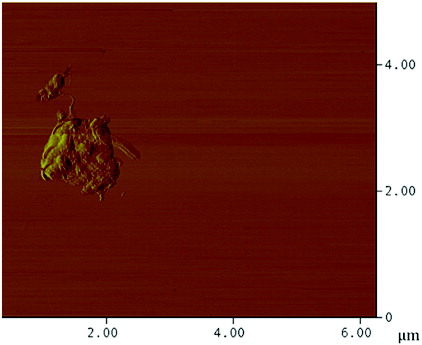
Figure 13. SEM analysis showing large aggregates of PEI-Phe(4-N-G).
As can be seen from the TGA in the absorption capacity is ca. 6 wt% (). The CO2 capacity of PEI-Phe(4-N-G) is on the scale of what was achieved with PEI-SWNTs and at least confirmed that graphitic structures could be promising as the scaffold for functional polymers. It is also worth noting that the rate of CO2 adsorption is lower than for MWNTs. The trend of PEI-SWNT > PEI-MWNT > PEI-Phe(4-N-G) suggests that the rate of CO2 uptake is controlled in part by the curvature of the NC substrate. As with PEI-SWNT and PEI-MWNT, desorption of CO2 occurs at 75 °C, confirming the lower temperature of regeneration of PEI-NCs.
Figure 14. TGA curve showing the CO2 absorption potential of PEI-Phe(4-N-G) (6 wt%).
Although the PEI coverage on Phe-modified graphite is extensive, almost 25% nitrogen content from XPS (), the overall cost effectiveness of this process is questionable as many expensive reagents, DCC and azido-Phe, are required. This makes the possible scale-up of this process unrealistic. Given the low reactivity of GICs and the expensiveness of the Phe-graphite substrate, we chose to explore an inexpensive highly reactive graphite substrate, graphite oxide.
3.4. PEI-GO
The presence of epoxides and hydroxyl groups on the basal plane and carboxylic acids around the perimeter of the sheet make GO extremely hydrophilic. The sources of the GO can be various, including commercial sources and those prepared by the methods of Hummer and Offeman,[Citation27] and Tour and co-workers.[Citation20] In these experiments, GO prepared using the Tour method was used. The reaction of GO with an appropriate molecular weight PEI in the presence of triethylamine (to ensure the majority of the PEI is un-protonated) in ethanol yields PEI-functionalised GO (PEI-GO), (see Experimental).
Scheme 3. PEI addition to exfoliated GO in refluxing ethanol.
The Raman spectrum () of PEI-GO shows a slight increase in the D:G ratio (0.85) as compared to the GO (0.71), consistent with the proposed reaction. However, the reappearance of a broad 2D peak (2700 cm−1) is consistent with the product being a multilayer graphite material rather than individual graphene sheets.
Figure 15. Raman spectra (514 nm) of (a) GO and (b) PEI-GO.
The XPS analysis of PEI-GO shows the presence of significant nitrogen and TGA indicates a PEI content of approximately 43% (). This figure will, however, be slightly inflated due to the fact that some of the oxygen containing groups will burn off concurrently with PEI. The high-resolution C1s spectra of GO and PEI-GO () show a loss of intensity of the epoxide peak (286.7 eV) observed in GO ((a)), and the presence of a new peak (285.9 eV) associated with the aliphatic C-NHR amine groups in the PEI in PEI-GO.[Citation18] This is indicative of the modification of GO with PEI. In summary, the degrees of PEI functionalisation for different graphite-like substrates follow the order PEI-GO ∼ PEI-Phe(4-N-G) > PEI-GIC (). To provide a direct comparison, the percentage of NC is shown rather than the percentage of PEI, due to the concurrent thermal decomposition of other organic species, carboxyl and hydroxyl groups in the case of PEI-GO and Boc-Phe in the case of PEI-Phe(4-N-G).
Figure 16. XPS C1s spectra of (a) GO and (b) PEI-GO indicating functionalisation of GO by PEI.
The AFM imaging of PEI-GO () shows 0.5–1.5 μm particles composed of multilayer sheets of a thickness between 30–50 nm. As can be seen from the image, functionalisation occurs on the basal plane of graphite and the edges. SEM imaging () suggests large aggregates of graphite sheets. We surmise that the reason for these large aggregates is due to the fact that as well as PEI, there are several other moieties present on GO, carboxylic acids, and hydroxyls. This will impart optimum solubility on the material allowing for large aggregates to be soluble, which is in contrast to PEI-GIC.
Figure 17. (Colour online) AFM image of PEI-GO showing PEI globules on the surface of GO.
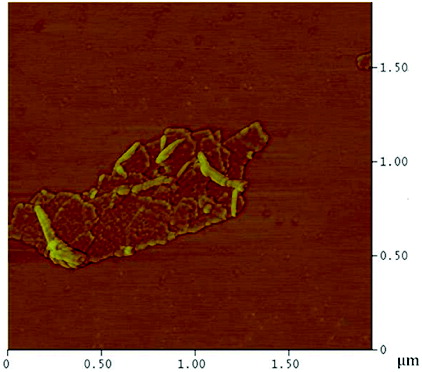
Figure 18. SEM image of PEI-GO showing large aggregate structures.
The potential absorption of carbon dioxide by the PEI-GO was investigated by TGA. As can be seen from , once CO2 is introduced, the mass increases significantly until a stable maximum is reached. Once the carrier gas is switched back to Ar at 75 °C, a mass loss occurs back to the original mass for the PEI-GO. The equilibrium absorption is dependent on temperature and pressure, with higher pressure possibly leading to higher uptake. The initial rate of absorption is comparable to that of PEI-Phe(4-N-G), see , however, the shape of the PEI-GO absorption curve is different to all other absorption runs.
Figure 19. TGA curve showing the CO2 absorption potential of PEI-GO (∼8 wt%).
This is possibly due to the free amines on PEI hydrogen bonding with remaining oxygen containing groups on GO, meaning the breaking of additional hydrogen bonds is required before absorption can occur. The CO2 absorption capacity of PEI-GO, 8 wt%, was very similar to that of PEI-SWNTs, 9 wt% (see ) and could be achieved at a significantly lower cost than SWNTs. Although some reagents and processing are required to generate the reactive GO material, the starting materials are of an overall low cost.
Several PEI-modified substrates have been developed and characterised in the last decade.[Citation28] A comparison of CO2 absorption performance of PEI-GO and three different kinds of PEI-impregnated mesoporous silica substrates [Citation29] is given in . The absorption capacity of PEI-GO is comparable to that of KIT-6-PEI at 25 °C.
Table 3. Comparison of CO2 absorption capacities of PEI-GO and PEI-impregnated mesoporous silica substrates (100% CO2).
4. Conclusions
While graphene and nano-graphites provide similar scale, properties, and reaction pathways as carbon nanotubes, they do so at a fraction of the cost. Regardless of the novel electronic properties of graphene, it also presents an inexpensive, large surface area scaffold for the covalent attachment of organic molecules. Covalent functionalisation provides a robust material for use as a scaffold and as a means of incorporating additional functionality.
We can make two interesting observations based upon the result of this work. First, the low regeneration temperature of the PEI-NC conjugates is general, and we propose, therefore, that it is indeed a function of the extreme hydrophobic nature of the carbon nanotube causing the polyamine to externalise and hence offer a greater number of active sites to the atmospheric CO2. This would suggest that alternative high surface area carbon substrates could show promise.
The second observation is that the rate of reaction (i.e., the rate of CO2 uptake) appears to be dependent on the identity of the carbon nanomaterial. PEI-functionalisation on the edge of graphene sheet is the slowest, presumably because the PEI is minimally affected by the carbon surface. Next is the surface functionalised graphene (i.e., the flat surface), followed by MWNTs, and finally SWNTs being the most rapid (see ). This suggests that the curvature of the NC substrate is important in enhancing the activity of the associated PEI.
Supplemental data
Supplemental data for this article can be accessed via the article webpage.
Supporting Informatin
Download MS Word (319.7 KB)Acknowledgements
This work was supported by the Robert A. Welch Foundation (C-0002) and Apache Corporation, Inc. The authors declare no competing financial interests.
References
- Mikkelsen M, Jørgensen M, Krebs FC. The teraton challenge: a review of fixation and transformation of carbon dioxide. Energy Environ Sci. 2010;3:43–81.
- Metz B, Davison O, de Coninck H, Loos M, Meyer L, editors. Carbon dioxide capture and storage. Intergovernmental Panel on Climate Change. Cambridge (UK): Cambridge University Press; 2005.
- Koch GH, Brongers MPH, Thompson NG, Virmani YP, Payer JH. Corrosion costs and preventive strategies in the United States, FWHA-RD-01-156. Washington (DC): U.S. Department of Transportation, Federal Highway Administration; 2002.
- Rao AB, Rubin ES. Identifying cost-effective CO2 control levels for amine-based CO2 capture systems. Ind Eng Chem Res. 2006; 45:2421–2429.
- Choi S, Drese JH, Jones CW. Adsorbent materials for carbon dioxide capture from large anthropogenic point sources. ChemSusChem. 2009;2:796–854.
- Brandani F, Ruthven DM. The effect of water on the adsorption of CO2 and C3H8 on type X zeolites. Ind Eng Chem Res. 2004;43:8339–8344.
- Bahadori A, Mokhatab S, Towler BF. Rapidly estimating natural gas compressibility factor. J Nat Gas Chem. 2007;16:349–353.
- Aaron D, Tsouris C. Separation of CO2 from flue gas: a review. Sep Sci Technol. 2005;40:321–348.
- Kim CJ, Savage DW. Kinetics of carbon-dioxide reaction with diethylaminoethanol in aqueous-solutions. Chem Eng Sci. 1987;42:1481–1487.
- D’Alessandro DM, McDonald T. Toward carbon dioxide capture using nanoporous materials. Pure Appl Chem. 2011;83:57–66.
- Bates ED, Mayton RD, Ntai I, Davis JH, Jr. CO2 capture by a task-specific ionic liquid. J Am Chem Soc. 2002;124:926–927.
- Allada R, Moloney P, Anderson M, Smith F, Arepalli S, Yowell L, Chattopadhyay J, Shah K, Billups WE, Filburn T. Nanoscale materials for human spaceflight applications: regenerable carbon dioxide removal using single-wall carbon nanotubes. Proceedings of 36th International Conference on Environmental Systems; 2006 Jul 17; Norfolk (VA); 2006.
- Leal O, Bolívar C, Ovalles C, García JJ, Espidel Y. Reversible adsorption of carbon dioxide on amine surface-bonded silica gel. Inorg Chim Acta. 1995;240:183–189.
- Kuwahara Y, Kang D-Y, Copeland JR, Bollini P, Sievers C, Kamegawa T, Yamashita H, Jones CW. Enhanced CO2 adsorption over polymeric amines supported on heteroatom-incorporated SBA-15 silica: impact of heteroatom type and loading on sorbent structure and adsorption performance. Chem Eur J. 2012;15:16649–16664.
- Bollini P, Brunelli NA, Didas SA, Jones CW. Dynamics of CO2 adsorption on amine adsorbents. 2. Insights into adsorbent design. Ind Eng Chem Res. 2012;51:15153–15162.
- Choi S, Watanabe T, Bae T-H, Sholl DS, Jones CW. Modification of the Mg/DOBDC MOF with amines to enhance CO2 adsorption from ultradilute gases. J Phys Chem Lett. 2012;3:1136–1141.
- Chaikittisilp W, Khunsupat R, Chen TT, Jones CW. Poly(allylamine)-mesoporous silica composite materials for CO2 capture from simulated flue gas or ambient air. Ind Eng Chem Res. 2011;50:14203–14210.
- Dillon EP, Crouse CA, Barron AR. Synthesis, characterization, and carbon dioxide adsorption of covalently attached polyethyleneimine-functionalized single-wall carbon nanotubes. ACS Nano. 2008;2:156–164.
- Mickelson ET, Huffman CB, Rinzler AG, Smalley RE, Hauge RH, Margrave JL. Fluorination of single-wall carbon nanotubes. Chem Phys Lett. 1998;296:188–194.
- Marcano DC, Kosynkin DV, Berlin JM, Sinitskii A, Sun Z, Slesarev A, Alemany LB, Lu W, Tour JM. Improved synthesis of graphene oxide. ACS Nano. 2010;4:4806–4814.
- Zeng L, Alemany LB, Edwards CL, Barron AR. Demonstration of covalent sidewall functionalization of single wall carbon nanotubes by NMR spectroscopy: side chain length dependence on the observation of the sidewall sp(3) carbons. Nano Res. 2008;1:72–88.
- Zhang L, Zhang J, Schmandt N, Cratty J, Khabashesku VN, Kelly KF, Barron AR. AFM and STM characterization of thiol and thiophene functionalized SWNTs: pitfalls in the use of chemical markers to determine the extent of sidewall functionalization in SWNTs. Chem Commun. 2005;5429–5431.
- Nakajima T, editor. Fluorine-carbon and fluoride-carbon materials: chemistry, physics, and applications. Boca Raton (FL): CRC Press; 1995.
- Chattopadhyay J, Mukherjee A, Hamilton CE, Kang J, Chakraborty S, Guo WH, Kelly KF, Barron AR, Billups WE. Graphite epoxide. J Am Chem Soc. 2008;130:5414–5415.
- Strom TA, Dillon EP, Hamilton CE, Barron AR. Nitrene addition to exfoliated graphene: a one-step route to highly functionalized graphene. Chem Commun. 2010;46:4097–4099.
- Goddard-Borger ED, Stick RV. An efficient, inexpensive, and shelf-stable diazotransfer reagent: imidazole-1-sulfonyl azide hydrochloride. Org Lett. 2007;9:3797–3800.
- Hummers WS, Offeman RE. Preparation of graphene oxide. J Am Chem Soc. 1958;80:1339–1339.
- Yu CH, Huang CH, Tan CS. A review of CO2 capture by absorption and adsorption. Aeros Air Qual Res. 2012;12:745–769.
- Son W-J, Choi J-S, Ahn W-S. Adsorptive removal of carbon dioxide using polyethyleneimine-loaded mesoporous silica materials. Microporous Mesoporous Mater. 2008;113:31–40.