
Abstract
Amorphous silica has been used in a wide variety of industrial and consumer applications. Nanosized silica is being considered a potentially ideal nanomaterial for biomedical and biotechnological applications. In the present study, hierarchical oxidative stress paradigms of nanoparticle toxicity were assumed to evaluate the toxicity of amorphous silica nanoparticle in human healthy lung cells, L-132. The cells were exposed to varied concentrations viz. 0, 100, 200, 300, 400 and 500 μg/ml of silica nanoparticle for 24 h. Different parameters of cytotoxicity, oxidative stress and pro-inflammatory markers were assessed. Silica nanoparticle exposure showed concentration-dependent decrease in cell viability, increase in reactive oxygen species with depletion of antioxidant enzyme activity, induction of inteleukin-8 and cyclooxygenase-2 expression and subsequent DNA damage in L-132 cells. The results indicated that amorphous silica nanoparticle followed hierarchical oxidative stress model and generated oxidative stress which provoked the pro-inflammatory response and caused necrosis in human lung cells.
1. Introduction
The properties that make nanomaterials attractive for commercial and medical use may also enhance their biological reactivity and toxicity. Indeed, materials classically considered biologically inert, such as amorphous silica, titanium dioxide and gold have been reported to cause exacerbated biological responses when used at the nanoscale.[Citation1–5] Silica (SiO2) is one of the most abundant oxides present in ambient air, typically in crystalline or amorphous forms and comprises (up to 8%) all total airborne nanoparticles.[Citation6] Silica nanoparticles (SiO2-NPs) are produced on an industrial scale as additives to cosmetics, drugs, printer toners, varnishes and food. In addition, nanosilica is being developed for a variety of biomedical and biotechnological applications.[Citation7–11] Barik et al. [Citation12] recently reviewed the impact of nanosilica on basic biology, medicine and agro-nanoproducts.
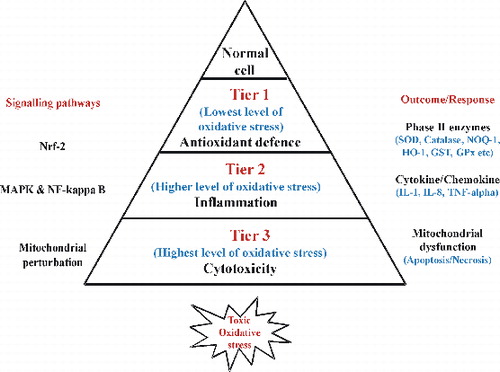
Numerous studies on nanoparticle toxicity, with various cell types and nanoparticle types, reported oxidative stress as one of the most important toxicity mechanisms related to nanoparticle exposure.[Citation13–16] Moreover, the hierarchical oxidative stress model provides an interlinked range of cellular responses to study nanomaterial oxidant injury. The hierarchical model of oxidative stress was proposed to illustrate a mechanism for nanoparticle-mediated oxidative stress.[Citation17,18] According to this model, cells and tissues respond to increasing levels of oxidative stress via antioxidant enzyme systems upon nanoparticle exposure. At the lowest level of oxidative stress (Tier 1), there is induction of protective antioxidant and detoxification enzymes (phase II enzyme) by the transcription factor, Nrf2.[Citation19,20] Examples of phase II enzymes include heme oxygenase 1 (HO-1), glutathione-S-transferase isoenzymes, nicotinamide adenine dinucleotide phosphate (NADPH) quinone oxidoreductase, catalase, superoxide dismutase (SOD) and glutathione peroxidase. At higher level of oxidative stress (Tier 2), this protective response transitions to pro-inflammatory responses.[Citation20] Pro-inflammatory effects are initiated by the redox-sensitive mitogen-activated protein (MAP) kinase and NF-κB cascades that are responsible for the expression of cytokines, chemokines and adhesion molecules, and many of these are involved in the inflammatory process of the lungs.[Citation19–22] At the highest level of oxidative stress (Tier 3), a perturbation of inner membrane electron transfer and the open/closed status of the mitochondrial permeability transition pore (PTP) trigger cellular apoptosis and cytotoxicity, also known as toxic oxidative stress. These hierarchical oxidative stress paradigms were successfully applied by Xiao et al. [Citation20] to study the effect of diesel exhaust particles on macrophage cell line. Another study by Xia et al. [Citation23] has also adopted tiered test strategy to study metal oxide nanoparticle toxicity. Thus, oxidative stress paradigm represents one of the best toxicological paradigms for screening for nanoparticle toxicity. The pro-inflammatory responses induced by nanoparticles have also been suggested as one of the toxic mechanisms.[Citation24] One of the pro-inflammatory cytokines, interleukin-8 (IL-8), induced by ultrafine particle exposure is a potent neutrophil chemoattractant that plays an important role in pathogenic responses in the human lung. In addition, cyclooxygenase-2 (COX-2) has been implicated in the synthesis of pro-inflammatory cytokines from particle-exposed alveolar macrophage and bronchial epithelial cells.[Citation25] Recently, a few types of nanoparticles such as titanium dioxide and carbon black have been demonstrated to exhibit pro-inflammatory effects on epithelial cells in vitro.[Citation16]
There is a growing body of evidence that amorphous SiO2-NPs can cause toxic effects and inflammation in lung cells.[Citation26–28] SiO2-NPs were known to generate reactive oxygen species (ROS) and the generated ROS triggered the pro-inflammatory responses both in vivo and in vitro.[Citation24] However, the information on the pro-inflammatory response induced by amorphous SiO2-NPs is very sparse and its relation to the oxidative stress in the context of hierarchical oxidative stress model is not very clear. Therefore, the present study was aimed to evaluate the oxidative stress and inflammatory response of human lung epithelial cells on exposure to SiO2-NPs.
Human healthy lung epithelial cells, L-132, were selected in the present study because inhalation is one of the major routes of exposure for nanoparticles. As the present investigation was aimed to study the effects of nanoparticles on humans in normal conditions, L-132 cell line, which represents normal human lung epithelial cells, was selected. The cytotoxicity was assessed by [3-(4,5-dimethyl thiazol-2-yl)-2,5-diphenyl tetrazolium bromide] (MTT) and lactate dehydrogenase (LDH) leakage assays while the oxidative stress was assessed by examining the formation of ROS and status of antioxidant enzymes. In addition to this, pro-inflammatory response was studied by expression study of IL-8 gene and COX-2 protein.
2. Materials and methods
2.1. Chemicals and reagents
SiO2-NPs (∼10–20 nm) were procured from Sigma-Aldrich (cat. no. 637238), Dulbecco's-modified Eagle's medium (DMEM), foetal bovine serum (FBS), penicillin–streptomycin–neomycin antibiotic mixture, MTT, 2,7-dichlorofluorescin diacetate (DCFH-DA), o-phthalaldehyde (OPT), lactic acid, pyruvic acid, NADPH, glutathione reduced (GSH), 2-thiobarbituric acid (TBA), 1,1,3,3-tetramethoxypropane, pyrogallol, hydrogen peroxide and sodium dodecyl sulphate (SDS) were obtained from Sigma-Aldrich (Sigma-Aldrich, MO, USA).
2.2. Particle preparation and characterisation
SiO2-NPs were suspended in DMEM at a concentration of 4 mg/ml and probe sonicated (Ultrasonic Homogenizer, Biologics Inc., USA) at 30 W for 10 min (1 min pulse on and 1 min pulse off for 10 min). For size measurement, sonicated 4 mg/ml SiO2-NP stock solution was then diluted to 100 μg/ml working solutions. Transmission electron microscopy (TEM) was used to characterise the size and shape of SiO2-NPs. A drop of aqueous SiO2-NP suspension was placed onto a carbon-coated copper grid, air dried and observed with TEM at an accelerating voltage of 120 kV (Model 1200EX, JEOL Ltd, Tokyo, Japan). The analysis was performed three times and the average particle size was calculated using Image J software program. ZetaPALS (Brookhaven Instruments Corporation, Holtsville, NY) was used to determine the hydrodynamic size and zeta potential of SiO2-NP suspension in cell culture medium.
2.3. Cell culture and exposure to SiO2-NPs
The human healthy lung epithelial cell line (L-132) was obtained from National Centre for Cell Sciences, Pune, India, and cultured in DMEM supplemented with 10% FBS and 100 U/ml penicillin–streptomycin at 5% CO2 and 37 °C. At 80% confluence, cells were harvested using 0.25% trypsin and were sub-cultured into 25 cm2 flasks, 6-well plates or 24-well plates according to experiments. Cells were allowed to attach the surface for 24 h prior to exposure. Stock suspension of SiO2-NPs (4 mg/ml) in DMEM was serially diluted to concentrations of 100, 200, 300, 400 and 500 μg/ml. Based on the results of screening study (data not shown) done with different concentrations of particle and previous reports,[Citation15] a concentration range was selected. Following exposure, cells were harvested to determine cytotoxicity, oxidative stress and inflammation. For each experiment, the particle suspension was freshly prepared, diluted to appropriate concentrations and immediately applied to the cells. Culture medium without SiO2-NPs served as control in each experiment.
2.4. Cell viability assay
To assess the effect of SiO2-NPs on viability of L-132 cells, MTT assay was performed.[Citation29] Briefly, L-132 cells were cultured in 24-well plates at the density of 1 × 10⁵ cells/well and then, incubated with particles (100–500 μg/ml) for 24 h. Following exposure, the cells were incubated with 20 μl of MTT solution (5 mg/ml) for 4 h. Mitochondrial dehydrogenases of viable cells reduce the yellowish water-soluble MTT to water-insoluble formazan crystals, which were solubilised with dimethyl sulphoxide (DMSO). The medium was then removed and 200 μl of DMSO was added into each well to dissolve formazan crystals, metabolite of MTT. After thorough mixing, optical density at 570 nm was detected by microplate reader (μQuant, Bio-Tek, USA). Control values (without SiO2-NPs) were set at 100% viable and all values were expressed as a percentage of the control and TC-50 (particle concentration inducing 50% cell mortality) concentration was calculated using GraphPad Prism software.
2.5. LDH leakage assay
Another parameter of cell viability in terms of cell membrane damage and release of LDH to the cell culture medium was assessed by LDH leakage assay.[Citation30] Released LDH catalyses the oxidation of lactate to pyruvate with simultaneous reduction of NAD+ to NADH. The rate of NAD+ reduction was measured as an increase in absorbance at 340 nm. The rate of NAD+ reduction was directly proportional to LDH activity in the cell medium. After exposure of SiO2-NPs to L-132 cells, cell culture supernatant was collected for LDH analysis. The decrease in absorbance every minute for 5 min was recorded at 340 nm (μQuant, Bio-Tek, USA) and the amount of LDH released is represented as LDH activity (U/l) in culture media.
2.6. Measurement of cellular ROS
The ROS was determined using 2′,7′-DCFH-DA.[Citation31] DCFH-DA passively enters the cell where it reacts with ROS to form the highly fluorescent compound dichlorofluorescein (DCF). The cells were pre-loaded with 10 μM DCFH-DA at 37 °C for 40 min in the dark. The cells were then washed and incubated with particle suspension for 2 h at 37 °C. After the particle exposure, cells were washed, scraped and pulse sonicated for 15 s (1 s on, 1 s off). The supernatant was collected by centrifugation at 5000g for 15 min at 4 °C. The intensity of DCF fluorescence was measured using a plate reader (FLx 800, Bio-Tek, USA) at an excitation and emission wavelengths of 485 and 530 nm, respectively.
2.7. Determination of intracellular reduced glutathione (GSH)
To determine generation oxidative stress condition, cellular content of GSH was quantified by the fluorometric assay of Hissin and Hilf.[Citation32] The assay is based on the reaction of GSH and fluorescent reagent, OPT. The fluorescence was measured at 360 and 420 nm of excitation and emission wavelengths, respectively, on a plate reader. After 24 h exposure to SiO2-NPs, the cells were scraped, pelleted and washed in phosphate buffered saline (PBS). The cells were homogenised in 200 μl of phosphate-ethylene diamine tetraacetic acid (EDTA) buffer pH 8.0 and 80 μl of 20% metaphosphoric acid. The cell homogenate was centrifuged at 16,000 rpm at 4 °C for 30 min. The assay was performed by taking 100 μl supernatants and mixing it with 800 μl of phosphate-EDTA buffer containing 100 μl OPT (10 mg/ml in methanol). After thorough mixing and incubation at room temperature for 15 min, fluorescence was measured at 360 nm excitation and 420 nm emission using a plate reader (FLx 800, Bio-Tek, USA). Results were expressed as nmol GSH/mg of cellular protein.
2.8. Antioxidant enzyme activity
According to hierarchical oxidative stress model (), Tier 1 includes induction of phase II enzymes, therefore SOD and catalase activities were measured to evaluate the effect of oxidative stress on antioxidant enzymes. After exposing the cells for 6 h with particle suspension, cells were washed with PBS, scraped, lysed, sonicated for 15 s (1 s on, 1 s off) on ice and centrifuged at 12,000g for 15 min at 4 °C. The supernatant (cell lysate) was removed and the protein concentration was measured using bicinchoninic acid (BCA) protein assay kit (cat. no. 23225, Pierce, USA). The activities of different antioxidant enzymes were then measured in the cell lysates.
Figure 1. The hierarchical oxidative stress model. At the lowest level of oxidative stress (Tier 1), phase II antioxidant enzymes are induced via transcriptional activation of the antioxidant response element by Nrf2 to restore cellular redox homeostasis. At higher level of oxidative stress (Tier 2), activation of the MAPK and NF-κB cascades induces pro-inflammatory responses. At the highest level of oxidative stress (Tier 3), perturbation of the mitochondrial PTP and disruption of electron transfer (mitochondrial dysfunction) result in cellular apoptosis or necrosis.
The activity of SOD was measured according to the method of Marklund and Marklund.[Citation33] The assay is based on the ability of SOD enzyme to inhibit autoxidation of pyrogallol. Aliquots of cell lysates were used to measure SOD by quantifying the inhibition of pyrogallol autoxidation at 420 nm. The reaction mixture consisted of 2.0 ml 50 mM Tris-HCl (pH 8.2), and 20–30 μl of cell lysates. The reaction was initiated by adding 20 μl pyrogallol (10 mM, pH 7.4). Activity was expressed as the amount of enzyme capable of inhibiting the rate of pyrogallol autoxidation by 50%, which is equal to one unit, per mg protein.
The activity of catalase enzyme was measured according to the method of Aebi.[Citation34] The assay is based on decomposition of H2O2 to give H2O and O2 by catalase. An appropriate volume of cell lysate containing 50 μg protein was mixed with 1 ml of 50 mM potassium phosphate buffer (pH 7.0) containing 10 mM H2O2 in 1 ml quartz cuvette. The decrease in absorbance of H2O2 was followed at 240 nm for 4 min. Catalase activity was calculated from the slope of the H2O2 absorbance curve and normalised to protein concentration.
2.9. Determination of lipid peroxidation (LPO)
One of the parameters of oxidative stress in terms of LPO was assessed by the thiobarbituric acid reactive substances (TBARS) assay. It detects mainly malondialdehyde (MDA), an end product of the peroxidation of polyunsaturated fatty acids and related esters. MDA was measured by slight modification of the method of Ohkawa et al.[Citation35] After 24 h exposure of SiO2-NP, cells were scraped and washed two times by Tris-HCl buffer (400 mM, pH 7.3). A 200 μl aliquot of cell suspension was subsequently mixed with 800 μl of LPO assay cocktail containing 0.4% (w/v) TBA, 0.5% (w/v) SDS, 5% (v/v) acetic acid, pH 3.5, and incubated for 60 min at 95 °C. The sample was cooled using tap water and centrifuged at 5000 rpm for 15 min. The absorbance of the supernatants was read at 532 nm (μQuant, Bio-Tek, USA) against a standard curve prepared using the MDA standard (10 mM 1,1,3,3-tetramethoxypropane in 20 mM Tris-HCl, pH 7.4). Results were calculated as nmol of MDA/mg of cellular protein.
2.10. Gene expression analysis
According to hierarchical oxidative stress model (), Tier 2 results in inflammation through production of cytokine and chemokine. Hence the effect of SiO2-NPs in the context of inflammation was studied by gene expression analysis of chemokine IL-8. It was evaluated in a concentration- and time-dependent manner. Cells were exposed to 100–500 μg/ml of SiO2-NP for 24 h and for time-dependent study, cells were exposed for different time periods viz. 6, 18, 24 and 48 h with TC-50 concentration (312.5 μg/ml) of SiO2-NPs. Total RNA was isolated using RNeasy Mini Kit (cat. no. 74104, Qiagen, USA). The concentration and integrity of RNA were measured using nanodrop spectrophotometer (Synergy HT-1, Bio-Tek, USA) prior to the experiment. The enhanced avian HS RT-PCR kit (cat. no. HSRT-100, Sigma, USA) was used for the amplification of IL-8 and 18s-rRNA gene, according to the manufacturer's instructions. Amplified cDNA products were separated on 1.2% agarose gel by electrophoresis. The primer sequences of amplified genes are shown in .
Table 1. Primer sequence of interleukin-8 (IL-8) and 18s-rRNA gene used in this study.
2.11. Western blot assay
According to hierarchical oxidative stress model (), Tier 2 results in inflammation through production of cytokine and chemokine. Protein expression of COX-2 was observed as an additional parameter to ensure the effect of SiO2-NPs in relation to its inflammatory potential. Its expression was determined in a concentration- and time-dependent manner. L-132 cells were exposed to different concentrations (0, 100, 200, 300, 400 and 500 μg/ml) of SiO2-NP for 24 h. Time-dependent expression was also carried out by exposing L-132 cells with TC-50 concentration of SiO2-NP (312.5 μg/ml) for 6, 18, 24 and 48 h. After exposure, cells were washed and lysed in lysis buffer (1% Triton X-100, 50 mM Tris-HCl, pH 8.0, 150 mM NaCl, 10 mM EDTA, 1 mM phenylmethylsulphonyl fluoride supplemented with protease cocktail inhibitors). Total proteins were achieved by centrifuging (15,000g for 15 min at 4 °C), and protein concentrations were determined using BCA protein assay kit (cat. no. 23225, Pierce, USA). The protein samples were separated by 12% SDS gels and transferred to polyvinylidene difluoride membranes (Millipore Corporation, USA). After blocking with 5% non-fat dry milk, the membranes were incubated with dilute solution (1:1000) of primary antibodies including anti-COX-2 (cat. no. sc-19999, Santa Cruz, USA) and anti-β-actin (cat. no. sc-130301, Santa Cruz, USA) overnight at 4 °C. After washing with tris buffered saline-Tween 20 (TBST), the membranes were incubated with goat anti-mouse IgG-HRP conjugated secondary antibody (cat. no. P0447, DakoCytomation, Denmark) at room temperature for 1.5 h. The protein bands were detected using an enhanced chemiluminescence peroxidase substrate kit (cat. no. CPS 1120, Sigma-Aldrich, USA). The membranes were exposed to X-ray film.
2.12. Determination of mitochondrial membrane potential
According to hierarchical oxidative stress model (), at Tier 3 mitochondrial dysfunction occurs that can be evaluated by measuring mitochondrial membrane potential. To measure mitochondrial dysfunction, its membrane potential was measured using rhodamine 123 dye (cat. no. 555505, Calbiochem, Germany). It is a cationic fluorescent probe which distributes across mitochondrial membranes with respect to the membrane potential.[Citation36,37] Briefly, cells were seeded with equal density in each well of 6-well plates (4 × 10⁵ cells per well) and incubated for 24 h at 37 °C. Then cells were exposed to 0, 100, 200, 300, 400 and 500 μg/ml of SiO2-NPs for 24 h. After exposure, the cells were resuspended in Krebs–Henseleit buffer (pH 7.4) containing rhodamine 123 (1.5 μM). After incubation for 10 min at 37 °C, cells were pelleted and rhodamine 123 accumulation was determined by subtracting the fluorescence of the supernatant from the fluorescence of the initial 1.5 μM rhodamine 123 solution. Fluorescence was measured on a plate reader (FLx 800, Bio-Tek, USA) with the excitation wavelength at 498 nm and the emission wavelength at 525 nm.
2.13. Detection of DNA damage
To evaluate the toxic oxidative stress effect () of SiO2-NPs on DNA of L-132 cells, DNA damage analysis was carried out. The cells were exposed to SiO2-NPs (100, 200, 300, 400 and 500 μg/ml) for 24 h and were collected into tubes and washed with PBS. The cells were incubated for 3 h in lysis buffer (20 mM Tris-HCl, pH 8.0, 5 mM EDTA, 0.1 M NaCl, 0.5% SDS and 100 μg/ml RNase) at 37 °C. After incubation, phenol:chloroform (1:1) mixture was used to extract DNA. By adding an equal volume of ice-cold absolute isopropanol DNA was precipitated. DNA was dissolved in 50 μl of 1 X Tris-EDTA buffer (10 mM Tris, 1 mM EDTA, pH 8.0). 20 μg of DNA was loaded onto 1.5% agarose gel; electrophoresis was carried out at 60 V for 2 h with tris-borate-EDTA (TBE) as the running buffer. DNA in the gel was visualised under ultraviolet light.[Citation38]
2.14. Statistics
All data are represented as mean ± SEM (standard error of mean). Statistical analysis was performed for the experiments conducted in at least triplicate using one-way analysis of variance (ANOVA) followed by Dunnett test. Results with p < 0.05 were considered as statistically significant. The TC-50 value was calculated using GraphPad Prism software (logarithmic transformation of X-values and non-linear regression sigmoidal dose–response analysis with variable slope with bottom and top constrains set at 0 and 100, respectively). Values are given ±95% confidence intervals.
3. Results
3.1. Characterisation of nanoparticles
TEM analysis was performed to determine the morphology and size of the particles. The particles were nearly spherical and cubical in shape (). The primary sizes of the particles estimated from TEM image and the average hydrodynamic size of SiO2-NPs in cell culture medium measured using ZetaPALS were shown in .
Table 2. Particle characterisation.
Figure 2. Transmission electron micrograph of silicon dioxide nanoparticles. Scale bar is 100 nm.
3.2. Cytotoxicity and LDH leakage
The cytotoxicity assessed by MTT assay showed concentration-dependent decrease in cell viability following exposure to SiO2-NPs ((A)). Significant decrease (p < 0.01) in cell viability from 77% to 31% was observed at concentration from 200 to 500 μg/ml. The TC-50 (particle concentration causing 50% cell mortality) value calculated using GraphPad Prism software was found to be 312.5 μg/ml. Other parameter of cytotoxicity was assessed by LDH leakage assay. Cell membrane damage was reflected in LDH release from cells into the culture medium. LDH levels following 24 h exposure to SiO2-NPs increased significantly (p < 0.01) with increase in concentration as compared to control cells ((B)).
Figure 3. Effect of SiO2-NPs on (A) cell viability and (B) LDH leakage in L-132 cells. Control cells cultured in particle-free medium were run in parallel to the exposed groups. Values were the mean ± SEM from three independent experiments. Significance indicated by: **p < 0.01 versus control.
3.3. ROS generation and GSH reduction
The ability of SiO2-NPs to induce intracellular oxidant production was assessed using DCF fluorescence assay. A concentration-dependent increase in the fluorescence intensity of oxidised DCF was observed ((A)). DCF intensity after 2 h exposure to SiO2-NPs at concentration from 200 to 500 μg/ml increased significantly from 41% to 88% as compared to control ((A)). As ROS level increased, antioxidant GSH level decreased and in (B), this decrease in levels of GSH was corresponding with increase in concentration of SiO2-NPs. The level of intracellular GSH decreased from 0.33 to 0.10 nmol GSH/mg proteins as compared to control GSH of 0.55 nmol GSH/mg protein.
Figure 4. Effect of SiO2-NPs on (A) ROS generation, (B) GSH level and (C) MDA level in L-132 cells. Control cells cultured in particle-free medium were run in parallel to the exposed groups. Values were the mean ± SEM from three independent experiments. Significance indicated by: **p < 0.01 versus control.
3.4. Antioxidant enzyme activity
To investigate the ability of SiO2-NPs to alter the activity of cellular antioxidants, L-132 cells were exposed to different concentrations (0–500 μg/ml) of SiO2-NPs for 6 h and the activity of SOD and catalase enzymes was assessed. Significant differences (p < 0.01) were found in the activity of SOD and catalase (). A concentration-dependent decrease in both the enzyme activities was observed.
Table 3. Cellular antioxidant enzyme activities following exposure to SiO2-NPs.The activity of superoxide dismutase and catalase were measured and normalised to protein concentration. Data are expressed as mean ± SEM of three replicates.
3.5. Lipid peroxidation (LPO)
LPO was measured in terms of MDA in L-132 cells. MDA levels were significantly (p < 0.01) increased after exposure to SiO2-NP for 24 h ((C)). The MDA levels were elevated by 1.5–2.0 fold at concentrations of 200–500 μg/ml as compared to the control groups (p < 0.01).
3.6. Pro-inflammatory markers
To determine if exposure to SiO2-NPs can induce an inflammatory response in L-132 cells, we measured the levels of the pro-inflammatory genes IL-8 and COX-2 using RT-PCR and western blot method, respectively. The expression of two inflammatory factors IL-8 and COX-2 in L-132 was enhanced after SiO2-NP exposure. It was observed that the expression of IL-8 was increased in a concentration- ((A)) and time-dependent manner ((B)). The expression was seen from a concentration of 200 μg/ml and at an early time point of 6 h and increased up to 48 h. While COX-2 protein expression was observed at higher concentrations, i.e. 400 and 500 μg/ml of SiO2-NPs ((C)). The time-dependent study showed induction of COX-2 expression at a later time, i.e. after 18 h of exposure which significantly increased up to 48 h ((D)).
Figure 5. Effects of SiO2-NPs on mRNA levels of IL-8 gene and COX-2 protein expression in L-132. (A) Concentration-dependent effect on IL-8 gene. (B) Time-dependent effect on IL-8 gene. 18s-rRNA was used as housekeeping gene. (C) Concentration-dependent effect on COX-2 protein. (D) Time-dependent effect on COX-2 protein. The β-actin was used as a loading control.
3.7. Measurement of mitochondrial membrane potential
After 24 h exposure to varying doses (0–500 μg/ml) of SiO2-NPs, accumulation of rhodamine 123 was determined. It was found to be decreased as a function of concentration of SiO2-NPs. At concentration from 200 to 500 μg/ml, rhodamine 123 accumulation decreased from 84% to 55% as compared to control ().
Figure 6. Effect of SiO2-NPs on mitochondrial membrane potential in L-132 cells. Control cells cultured in particle-free medium were run in parallel to the exposed groups. Values were the mean ± SEM from three independent experiments. Significance indicated by: **p < 0.01 versus control.
3.8. DNA damage analysis
L-132 cell exposed to SiO2-NPs for 24 h showed DNA damage (). Exposure of SiO2-NPs caused DNA damage at higher concentrations (viz. 400 and 500 μg/ml) which was observed in the form of smearing in agarose gel.
Figure 7. DNA damage of L-132 cells on exposure to SiO2-NPs for 24 h.
4. Discussion
In the present study, toxicity of amorphous SiO2-NPs (∼10–20 nm) was determined using human healthy lung epithelial cells, L-132. The physicochemical characteristics of SiO2-NPs were characterised using TEM and zeta potential analysis. The average size of nano SiO2 particles was in agreement with the size provided by the supplier. Dynamic light scattering (DLS) analysis revealed a larger hydrodynamic size in cultured medium indicating agglomeration in aqueous media which was further corroborated by zeta potential measurement of −36.74 mV indicating a stable suspension. To minimise the effects of particles aggregation, suspension of SiO2-NPs was always freshly prepared and sonicated before each experiment.
MTT assay showed that amorphous SiO2-NP exposure significantly reduced cell viability of human healthy lung epithelial cells in a dose–response manner. LDH leakage assay was further carried out to confirm the reduction in cell viability. When plasma membrane integrity is disrupted, LDH leaks into culture media and its extracellular level is elevated.[Citation30] Thus, observed increase in LDH levels as a function of concentration of SiO2-NPs indicated disruption of membrane integrity of cells.
It is a well-accepted fact that oxidative stress is the most important toxicity mechanism related to nanoparticle toxicity.[Citation13–16] Some researchers have proposed the hierarchical oxidative stress model to provide an interlinking of cellular responses to nanomaterial-induced oxidant injury.[Citation20,Citation23] In the present study, a series of experiments were conducted to study the role of oxidative stress in SiO2-NP toxicity and to substantiate its pattern to hierarchical oxidative stress model (). The results of the present study were in agreement with hierarchical oxidative stress model. According to the hierarchical oxidative stress hypothesis, the first tier of oxidative stress includes activation of the antioxidant response element in the promoters of phase II genes by the transcription factor, Nrf2. This leads to the induction of phase II enzymes such as HO-1, NQO1, SOD, catalase, etc.[Citation19,20] The SiO2-NP exposure generated oxidative stress as evidenced by increase in ROS and depletion of GSH level. The LPO further confirmed the induction of oxidative stress. The activities of phase II antioxidant enzymes viz. SOD and catalase were found reduced, suggesting the induction of oxidative stress. If the Tier 1 () protection fails to restore cellular redox equilibrium, escalation of the level of oxidative stress activates pro-inflammatory signalling pathways such as the Jun kinase and NF-κB cascades.[Citation20] NF-κB induces transcription of pro-inflammatory mediators resulting in inflammation. During nanoparticle-mediated lung injury, ROS activate NF-κB to modulate the production of pro-inflammatory mediators tumor necrosis factor (TNF)-α, IL-8, IL-2 and IL-6 from macrophages and lung epithelial cells.[Citation39] This is consistent with our observation that exposure of L-132 cells to SiO2-NPs induced IL-8 gene expression and COX-2 protein expression. IL-8 is a chemokine which plays a key role in activation and recruitment of neutrophils to the site of inflammation.[Citation40] Results demonstrated induction of IL-8 gene expression as a function of concentration and time after exposure of SiO2-NPs. Similar increase in IL-8 production was found in primary human lung fibroblasts [Citation41] and endothelial cells by Peters and co-workers [Citation42] and supports the findings. COX-2 is an inducible isoform of cyclooxygenase, responsible for the synthesis of prostaglandins which play major role in inflammation.[Citation43] Thus, increased expression of COX-2 with the higher concentration of SiO2-NP suggests its role in prostaglandin production propagating the inflammation cascade. O’Reilly et al. [Citation41] had also reported up-regulation of the early inflammatory mediator COX-2, by amorphous silica in primary human pulmonary fibroblasts and supports the findings. Thus, the results of inflammatory response study substantiate Tier 2 of oxidative stress model (). Further, dysfunction in mitochondria and DNA analysis showed decrease in mitochondrial membrane potential and DNA damage in L-132 cells, respectively. This substantiates Tier 3 of hierarchical oxidative stress model, indicating toxic oxidative stress (). Other in vitro studies have also detected DNA damage due to oxidative stress and intracellular formation of ROS, but no mechanistic details were investigated.[Citation44]
Thus, in conclusion, exposure of amorphous SiO2-NPs generated extensive oxidative stress in human lung epithelial cells that invoked induction of pro-inflammatory markers contributing to necrotic cell death. The study further indicated that SiO2-NPs followed the hierarchical oxidative stress model () to exhibit the toxicity.
Acknowledgements
We acknowledge Advanced Instrumentation Research Facility (AIRF), Jawaharlal Nehru University (JNU), New Delhi, India, for nanoparticle characterisation by TEM. The hydrodynamic size and zeta potential measurements of particles were performed using facilities at Centre for Nanoscience and Engineering (CeNSE), funded by the Department of Information Technology, Govt. of India and Institute of Science, Bangalore, India.
References
- Bermudez E, Mangum JB, Wong BA, Asgharian B, Hext PM, Warheit DB, Everitt JI. Pulmonary responses of mice, rats, and hamsters to subchronic inhalation of ultrafine titanium dioxide particles. Toxicol Sci. 2004;77:347–357.
- Ferrin J, Oberdorster G, Penney DP. Pulmonary retention of ultrafine and fine particulates in rats. Am J Respir Cell Mol Biol. 1992;6:535–542.
- Goodman CM, McCusker CD, Yilmaz T, Rotello VM. Toxicity of gold nanoparticles functionalized with cationic and anionic side chains. Bioconjug Chem. 2004;15:897–900.
- Kaewamatawong T, Kawamura N, Okajima M, Sawada M, Morita T, Shimada A. Acute pulmonary toxicity caused by exposure to colloidal silica: particle size dependent pathological changes in mice. Toxicol Pathol. 2005;33:743–749.
- Oberdorster G, Oberdorster E, Oberdorster J. Nanotoxicology: an emerging discipline evolving from studies of ultrafine particles. Environ Health Perspect. 2005;113:823–839.
- Balduzzi M, Diociaiuti M, De Berardis B, Paradisi S, Paoletti L. In vitro effects on macrophages induced by noncytotoxic doses of silica particles possibly relevant to ambient exposure. Environ Res. 2004;96:62–71.
- Vijayanathan V, Thomas T, Thomas TJ. DNA nanoparticles and development of DNA delivery vehicles for gene therapy. Biochemistry. 2002;41:14085–14094.
- Hirsch LR, Stafford RJ, Bankson JA, Sershen SR, Rivera B, Price RE, Hazle JD, Halas NJ, West JL. Nanoshell-mediated near-infrared thermal therapy of tumors under magnetic resonance guidance. Proc Natl Acad Sci USA. 2003;100:13549–13554.
- Ravi Kumar MN, Sameti M, Mohapatra SS, Kong X, Lockey RF, Bakowsky U, Lindenblatt G, Schmidt CH, Lehr M. Cationic silica nanoparticles as gene carriers synthesis, characterization and transfection efficiency in vitro and in vivo. J Nanosci Nanotechnol. 2004;4:876–881.
- Moghimi SM, Hunter AC, Murray JC. Nanomedicine: current status and future prospects. FASEB J. 2005;19:311–330.
- Slowing II, Vivero-Escoto JL, Wu CW, Lin VS. Mesoporous silica nanoparticles as controlled release drug delivery and gene transfection carriers. Adv Drug Deliv Rev. 2008;60:1278–1288.
- Barik TK, Sahu B, Swain V. Nanosilica-from medicine to pest control. Parasitol Res. 2008;103:253–258.
- Shvedova AA, Castranova V, Kisin ER, Schwegler-Berry D, Murray AR, Gandelsman VZ, Maynard A, Baron PJ. Exposure to carbon nanotube material: assessment of nanotube cytotoxicity using human keratinocyte cells. Toxicol Environ Health A. 2003;66:1909–1926.
- Green M, Howman E. Semiconductor quantum dots and free radical induced DNA nicking. Chem Commun (Camb). 2005;1:121–123.
- Lin W, Huang YW, Zhou XD, Ma Y. In vitro toxicity of silica nanoparticles in human lung cancer cells. Toxicol Appl Pharmacol. 2006;217:252–259.
- Monteiller C, Tran L, MacNee W, Faux S, Jones A, Miller B, Donaldson K. The pro-inflammatory effects of low-toxicity low-solubility particles, nanoparticles and fine particles, on epithelial cells in vitro: the role of surface area. Occup Environ Med. 2007;64:609–615.
- Huang Y, Wu C, Aronstam R. Toxicity of transition metal oxide nanoparticles: recent insights from in vitro studies. Materials. 2010;3:4842–4859.
- Li N, Xia T, Nel AE. The role of oxidative stress in ambient particulate matter-induced lung diseases and its implications in the toxicity of engineered nanoparticles. Free Radic Biol Med. 2008;44:1689–1699.
- Li N, Hao M, Phalen RF, Hinds WC, Nel AE. Particulate air pollutants and asthma. A paradigm for the role of oxidative stress in PM-induced adverse health effects. Clin Immunol. 2003;109:250–265.
- Xiao GG, Wang M, Li N, Loo JA, Nel AE. Use of proteomics to demonstrate a hierarchical oxidative stress response to diesel exhaust particle chemicals in a macrophage cell line. J Biol Chem. 2003;278:50781–50790.
- Nel A, Xia T, Madler L, Li N. Toxic potential of materials at the nanolevel. Science. 2006;311:622–627.
- Chan K, Kan YW. Nrf2 is essential for protection against acute pulmonary injury in mice. Proc Natl Acad Sci USA. 1999;96:12731–12736.
- Xia T, Kovochich M, Liong M, Madler L, Gilbert B, Shi H, Yeh JI, Zink JI, Nel AE. Comparison of the mechanism of toxicity of zinc oxide and cerium oxide nanoparticles based on dissolution and oxidative stress properties. ACS Nano. 2008;2:2121–2134.
- Park EJ, Park K. Oxidative stress and pro-inflammatory responses induced by silica nanoparticles in vivo and in vitro. Toxicol Lett. 2009;184:18–25.
- Becker S, Mundandhara S, Devlin RB, Madden M. Regulation of cytokine production in human alveolar macrophages and airway epithelial cells in response to ambient air pollution particles: further mechanistic studies. Toxicol Appl Pharmacol. 2005;207:269–275.
- Napierska D, Thomassen LC, Lison D, Martens JA, Hoet PH. The nanosilica hazard: another variable entity. Part Fibre Toxicol. 2010;7:39.
- Choi SJ, Oh JM, Choy JH. Toxicological effects of inorganic nanoparticles on human lung cancer A549 cell. J Inorg Biochem. 2009;103:463–471.
- Wottrich R, Diabate S, Krug HF. Biological effects of ultrafine model particles in human macrophages and epithelial cells in mono- and coculture. Int J Hyg Environ Health. 2004;207:353–361.
- Denizot F, Lang R. Rapid colorimetric assay for cell growth and survival: modifications to the tetrazolium dye procedure giving improved sensitivity and reliability. J Immunol Methods. 1986;89: 271–277.
- Wroblewski F, LaDue JS. Lactate dehydrogenase activity in blood. Proc Soc Exp Biol Med. 1955;90:210–213.
- Wan CP, Myung E, Lau BH. An automated micro-fluorometric assay for monitoring oxidative burst activity of phagocytes. J Immunol Methods. 1993;159:131–138.
- Hissin PJ, Hilf R. A fluorometric method for determination of oxidized and reduced glutathione in tissues. Anal Biochem. 1976;74:214–226.
- Marklund S, Marklund G. Involvement of superoxide anion radical in autoxidation of pyrogallol and a convenient assay of superoxide dismutase. Eur J Biochem. 1974;47:469–474.
- Aebi H. Catalase in vitro. Methods Enzymol. 1984;105:121–126.
- Ohkawa H, Ohishi N, Yagi K. Assay for lipid peroxides in animal tissues by thiobarbituric acid reaction.Anal Biochem. 1979;95:351–358.
- Wu EY, Smith MT, Bellomo G, Montet DD. Relationships between the mitochondrial transmembrane potential, ATP concentration, and cytotoxicity in isolated rat hepatocytes. Arch Biochem Biophys. 1990;282:358–362.
- Emaus RK, Grunwald R, Lemasters JJ. Rhodamine 123 as a probe of transmembrane potential in isolated rat-liver mitochondria: spectral and metabolic properties. Biochim Biophys Acta. 1986;850:436–448.
- Allen RT, Hunter WJ 3rd, Agrawal DK. Morphological and biochemical characterization and analysis of apoptosis. J Pharmacol Toxicol Methods. 1997;37:215–228.
- Byrne JD, Baugh JA. The significance of nanoparticles in particle-induced pulmonary fibrosis. McGill J Med. 2008;11:43–50.
- Huber AR, Kunkel SL, Todd RF 3rd, Weiss SJ. Regulation of transendothelial neutrophil migration by endogenous interleukin-8. Science. 1991;254:99–102.
- O’Reilly KM, Phipps RP, Thatcher TH, Graf BA, Van Kirk J, Sime PJ. Crystalline and amorphous silica differentially regulate the cyclooxygenase prostaglandin pathway in pulmonary fibroblasts: implication for pulmonary fibrosis. Am J Physiol Lung Cell Mol Physiol. 2005;288:L1010–L1016.
- Peters K, Unger RE, Kirkpatrick CJ, Gatti AM, Monari E. Effects of nano-scaled particles on endothelial cell function in vitro: studies on viability, proliferation and inflammation. J Mater Sci Mater Med. 2004;15:321–325.
- Claria J. Cyclooxygenase-2 biology. Curr Pharm Des. 2003;9:2177–2190.
- Petersen EJ, Nelson BC. Mechanisms and measurements of nanomaterial-induced oxidative damage to DNA. Anal Bioanal Chem. 2010;398:613–650.