
Abstract
With the expansion in the production of shale oil and gas, there is a desire to obtain detailed information of the downhole environment resulting from hydraulic fracturing (fracking). Nanomagnetite (nMag) has been proposed as a suitable contrast agent for magnetic imaging. In order to determine its suitability, 15 nm oleic acid-stabilised magnetite nanoparticles were synthesised and the magnetic susceptibility was measured and compared against two types of proppant. Although frac sand is diamagnetic (−0.20 × 10⁻⁵ SI), ceramic proppant is paramagnetic (25.7 × 10⁻⁵ SI) due to the presence of Fe2O3. The quantity of the nanoparticles that would be required for differentiation against the background levels in the proppant pack was calculated to be 0.269 g/L for sand and 1.01 g/L for ceramic, which correlates to a minimum of 15,000 kg and 56,000 kg per well, respectively. In order to determine the contrast with the reservoir rock itself, the magnetic susceptibility was mapped for cores from two typical shale gas reservoirs (Harrison and Rackley, Arkansas), which show a general low level of paramagnetism (ca. 45 × 10−5 SI). However, regions are observed with higher susceptibility (>200 × 10−5 SI) necessitating the use of 242,000 kg nMag per well in order to provide contrast with the reservoir.
1. Introduction
Shale gas represents the largest fraction of natural gas in the continental United States. With an estimated 482 trillion cubic feet of hydrocarbon,[Citation1] shale gas has the potential to be the primary energy source for power generation in the USA for the coming decades.[Citation2–4] The ability to extract shale gas economically has been achieved by the use of horizontal drilling techniques and hydraulic fracturing. Hydraulic fracturing (also known as ‘fracing’ or ‘fracking’) uses water, proppant (sand or ceramic particles), and chemicals, pumped at high pressures into the well bore, to induce fracturing of the shale, creating permeability so the gas can migrate into the well bore and to the surface.
In order to maximise the recovery of oil and gas, it is important to obtain information on the extent of the fracture flow characteristics of the rock within the hydraulically fractured reservoir.[Citation5] Characterisation has traditionally been accomplished using techniques such as seismic measurements and nuclear magnetic resonance well logging; however, these methods have limitations and new methods are being investigated, including: conductive polymers,[Citation6] active or passive devices,[Citation7] or proppant tracking materials.[Citation8] The low porosity and permeability of many oil and gas reservoirs, even after hydraulic fracturing, means that any sensor or tracer material must have a size sufficiently small to allow for its transport through the fractured rock formation. Nanoparticles (NPs) offer potential because one can change the surface properties to allow mobility [Citation9] and their core may have a range of properties that can be sensed or reported. As such, NPs represent a potential sensor/tracer material and a number of mechanisms have been suggested for detection.[Citation10]
There has been significant research into the use of magnetite as a tracer in biological applications, such as in magnetic resonance imaging (MRI), taking advantage of the magnetic properties of the nanomagnetite (nMag) in order to create a large contrast between the particles and the surrounding tissue.[Citation11–15] The non-toxic nature of nMag would also have an advantage on environmental grounds [Citation16] and so it has been proposed that it should be possible to scale up this technology to the size of a reservoir using magnetic nanoparticles and a large magnetic source and receiver.[Citation10] This approach has merit since it is already known that studying the magnetic anisotropy of the reservoir source rocks can give a good understanding of the characteristics and structure of such formations.[Citation17]
Given that the function of the proppant is to hold open the cracks that are formed in the source rock (shale) during the frac process, the presence of a nanosensor would be most likely associated with the proppant pack. Thus, it is important to ascertain if nMag may be distinguished from typical proppant materials. The most common proppant is high quartz sand such as the hydraulic fracturing sand (frac sand) used herein; however, due to the low crush strength of sand, ceramic particles are often used as proppant and so we have also used a typical high density ceramic proppant (CarboHSP). In addition, since the resolution of the measurement will be lower than the size of the propped fractures (>300 nm depending on the size of the proppant particle), then in order to differentiate the nMag from the background rock, the concentration of nMag must be sufficient to allow differentiation from the source rock itself, which is known to contain paramagnetic clays and small, single-domain or multi-domain ferrimagnetic particles in the rock.[Citation18–20] The present study is aimed at determining the relative concentration (and hence quantity) of nMag that would be needed to detect its presence. We have previously developed methods to characterise minerals and rock formations using low field magnetic susceptibility [Citation19–22] and so, in the present study, we have used this technique to determine the relative signal from nMag in the presence of typical proppant materials and compared it to real shale gas core samples.
2. Experimental procedure
2.1. Materials
Chemicals used were iron (III) acetylacetonate (97%, Sigma Aldrich), oleic acid [CH3(CH2)7CH = CH(CH2)7CO2H] (90%, Sigma Aldrich), oleylamine [CH3(CH2)7CH = CH(CH2)8NH2] (>70%, Sigma Aldrich), 1,2-hexadecanediol [HDD, CH3(CH2)13CH(OH)CH2OH] (Sigma Aldrich), benzyl ether (98%, Sigma Aldrich), ethanol (200 proof, Decon Laboratories Inc.), hexanes (mixture of isomers, Sigma Aldrich), nitric acid (ACS Reagent, 70%, Sigma Aldrich), and NANOpure water™ (ThermoScientific). Sand was obtained from Unimin (Accupack, 20–40 mesh). CarboHSP (20–40 mesh) was obtained commercially. All materials were used as received.
2.2. Characterisation
Size determination of the nanoparticles was achieved by small angle X-ray scattering (SAXS) using a Rigaku SmartLab X-Ray diffractometer using a Cu-Kα radiation source. Samples were prepared by sealing a concentrated nanoparticle solution in hexanes into a 1 mm ‘Glass Number 50 Capillary’ tube (Hampton Research Inc.) and the data was resolved using Rigaku's NANO-Solver. Inductively coupled plasma-optical emission spectroscopy (ICP-OES) measurements were obtained on a Perkin Elmer Optima 4300 DV. Samples were prepared by digesting 0.5 mL of concentrated nanoparticle solution in 9.5 mL of concentrated nitric acid. An aliquot of the digested solution (0.5 mL) was diluted into 9.5 mL of NANOpure™ water. ICP standards were obtained from Inorganic Adventures and diluted using NANOpure™ water. Images were obtained using a JEOL 2010 transmission electron microscope (TEM) on ultrathin carbon type-A support film (Ted Pella).
2.3. Nanoparticle synthesis
The nanoscale magnetite was synthesised using a thermal decomposition reaction.[Citation23,24] To iron (III) acetylacetonate (706 mg, 2.00 mmol), in a 100-mL round-bottomed flask with a stir bar, oleic acid (0.951 mL, 1.50 mmol), oleylamine (0.987, 1.50 mmol), 1,2-hexadecanediol (0.388 g, 3.00 mmol), and benzyl ether (37.5 mL) was added. The solution was heated to 200 °C under argon with constant stirring and held for 2 hours, before being heated to reflux and held for 1 hour. The solution was cooled to room temperature and then the nanoparticles were precipitated with ethanol (40 mL). The nanoparticles were centrifuged and washed with ethanol three times before air drying overnight, with a yield of 85%. The nanoparticles were then suspended in hexane (15 mL) in a 20-mL scintillation vial.
2.4. Magnetic measurements
Sand or CarboHSP was spread evenly into a 10.5″ x 10.5″ plastic tray, 0.5″ deep. In the test, a 5 × 5 grid was prepared with 30, 60, 90, 120, and 150 μL of a nanoparticle solution (1.23 × 10⁻⁴ mmol Fe, 9.5 g/L) dropped into the five columns, respectively. Each row was a duplicate. The grid was covered with a layer of thin plastic wrap, so as to not contaminate the probe. The plastic wrap was first tested to see if there was any signal change; there was not.
In addition, a beaker was filled with sand 1-cm deep. Nanoscale magnetite (30 μL) was added to the beaker and a measurement was taken. The probe was covered with a thin layer of plastic wrap. Then sand (0.1 cm) was added to the beaker and another measurement was taken, with the probe wrapped in a fresh layer of plastic wrap. Further 0.1-cm layers of sand were added and measurements were undertaken until a diamagnetic signal (indicating just sand) was obtained.
Quantification versus the proppant was determined by placing nMag (2.50 mL, 9.50 g/L) into each of two 20 mL scintillation vials. Sand was added to one vial until only a small amount of nanoscale magnetite solution was not covered. The same procedure was repeated with CarboHSP. In addition, an aliquot of nanoscale magnetite solution was diluted to both half and quarter concentration and then added to two 20 mL scintillation vials (2.50 mL; 4.75 g/L, 2.38 g/L, respectively). Sand and CarboHSP were added to the vials in the same manner as before. The relative quantities for each sample are given in . All four vials were placed in a fume hood, uncapped, to let the hexanes evaporate. Once there was no visible liquid, the vials were gently heated to ensure dryness (40 °C). After cooling, the contents of each of the vials was mixed thoroughly and then placed into a quarter of a segregated plastic Petri dish and spread out evenly. In addition, a comparable quantity of sand and CarboHSP was put into quarters of a segregated plastic Petri dish. The low field volume magnetic susceptibility of the mixtures was then measured with a handheld probe magnetic susceptibility device (an MS2E Sensor, by Bartington Instruments). The probe was zeroed between each data point. Both the background (air) and the sample (sand, CarboHSP, and sand/nanoparticle or CarboHSP/nanoparticle solution) measurement were recorded. Sand and proppant measurements were taken between each solution spot. Solution measurements were taken in the middle of the solution spot. It should be noted that volume magnetic susceptibility is unitless; however, we have used the notation ‘SI’ to indicate that the International System of Units was used in the calculation.
Table 1. Summary of experimental quantities for nMag/proppant samples.
2.5. Magnetic measurements on shale core samples
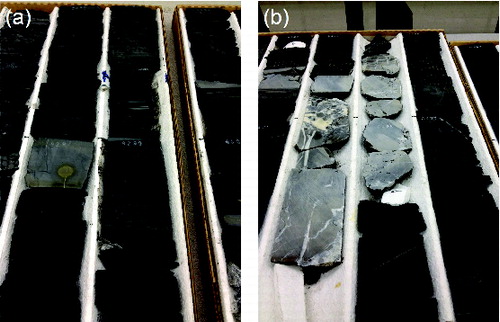
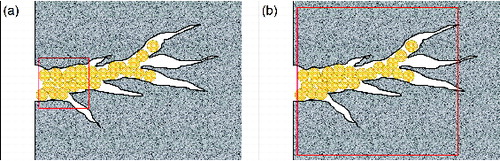
Testing was conducted at Weatherford Laboratories (Houston, TX). Slabbed cores were supplied by Southwest Energy Company (Houston, TX). The two cores used in the experiments were the Harrison core from Faulkner County, Arkansas and the Rackley core from Cleburne County, Arkansas. The Harrison core had a total length of 359 feet (122 m), starting at a depth of 4240 feet (1445 m) and ending at 4599 feet (1567 m). The Rackley core had a total length of 713 feet (243 m), starting at a depth of 1970 feet (671 m) and ending at 2683 feet (914 m). Using the same handheld magnetic susceptibility probe as for the nanoparticles on sand experiment, measurements were taken by placing the handheld probe on the surface of the core at ambient temperature. On average, measurements were obtained every 4 feet. Some measurements were taken closer together, a few millimetres apart, when a large volume magnetic susceptibility was detected. Other measurements were much further apart, due to missing sections of the core. A background reading, the shale core volume magnetic susceptibility, and the corresponding depth were recorded. The instrument was zeroed every 48 feet and the detector was wiped, so as to remove any accumulation of material from the core. Visual variations in the composition of the cores can be seen in .
Figure 1. Visual variations in the (a) Harrison and (b) Rackley cores can be observed, suggesting compositional differences.
3. Results and discussion
A typical magnetite nanoparticle (nMag) synthesis was chosen for the present studies involving the thermal decomposition of iron (III) acetylacetonate [Fe(acac)3] in the presence of a suitable capping agent.[Citation23,24] While we have shown that the identity of the surface functionalisation is important in controlling the mobility of a nanoparticle through a reservoir or proppant pack material,[Citation9] in the present case an oleic acid functionality was chosen so that solutions in hexane could be prepared. The choice of hexane ensured that the solvent could be readily evaporated leaving the nMag dispersed upon the proppant material. shows the size distribution of the nMag to be within the range of 5–20 nm with an average of 11.8 nm, as determined by SAXS. This is consistent with the TEM image shown in , which gives the particle size range of 6–23 nm and an average of 15 nm. Similar sized particles have been previously reported as MRI contrast agents.[Citation11–16]
Figure 2. Size distribution obtained via SAXS of the magnetite nanoparticles in hexane (9.5 g/L).
Figure 3. Representative TEM image of the magnetite nanoparticles used in this study.
3.1. Detectability of nMag versus proppant
Two proppant materials were chosen for the study: sand and ceramic. To mimic a sand proppant pack, we have employed frac sand (Unimin, 20–40 mesh), which is high purity quartz sand produced from sandstone with smooth round grains ((a)) between 300–600 μm in size and a sphericity of 0.6.[Citation25] As a typical high strength ceramic, we used CarboHSP (20–40 mesh, 400–840 μm) with a supposed sphericity of 0.9, and a bulk density of 2.0 g/cm3 ((b)). The composition of CarboHSP is Al2O3 (83%), SiO2 (5%), TiO2 (3.5%), Fe2O3 (7.0%), and other oxides (1.5%). The presence of iron oxide is expected to result in a significant magnetic susceptibility of the proppant, see below.
Figure 4. SEM images of (a) frac sand and (b) CarboHSP proppants.
Since the core magnetic susceptibility measurements were conducted using a handheld magnetic susceptibility meter (see Section 2), it was appropriate that the same instrument be used for the proppant pack. Prior to investigating the detection limit (signal-to-noise) for the nMag against each proppant, we prepared a sample of nMag infused sand and measured the magnetic susceptibility as a function of the depth under the surface of fresh sand (see Section 2). The plot in shows that with the experimental set-up used, the measured detection is limited to the surface (or within <1 mm of the surface).
Figure 5. Plot of volume magnetic susceptibility of nMag (9.5 g/L)-infused Unimin sand as a function of the depth under the surface of fresh Unimin sand. See Section 2.4. for details.
To determine how much nMag is needed in order to make a clear distinction between the two materials, a series of spots of a known volume of standard solution of nMag was deposited onto a uniformly packed sample of frac sand ((a)). Varying amounts of magnetite nanoparticles (100–500 μL) of a standard solution (9.5 g/L, 1.23 × 10⁻⁴ mmol Fe) were added on top of a layer of uniformly packed sand (see Section 2). The resulting array would mimic the presence of the nanocontrast agent in the proppant pack at different concentrations. The magnetic susceptibility of the array was measured in 1.5-cm increment measurements in order to determine the spatial resolution of the instrument. (b) shows the associated plot of volume magnetic susceptibility as a function of distance for the array in (a). shows the correlation between the position of the array and the magnetic susceptibility measurement.
Figure 6. (a) Photograph of an array of different volumes of a standard solution (1.23 × 10⁻⁴ mmol Fe, 9.5 g/L) of nMag adsorbed onto frac sand and (b) the associated plot of volume magnetic susceptibility as a function of distance (see Section 2).
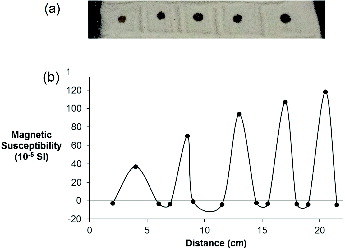
(b) shows that as expected from its high quartz content, the frac sand has a net negative magnetic susceptibility, due to its diamagnetism.[Citation21,22] Furthermore, the usage of nMag with such proppant enables a clear distinction to be made between the two.
A similar set of measurements was made using a uniform pack of ceramic proppant. In this case, the magnetic susceptibility measurements () show that whilst there is a similar relationship of magnetic susceptibility with increasing concentration of the nMag the proppant itself is slightly paramagnetic (25.7 × 10⁻⁵ SI), consistent with the presence of iron oxide as a constituent.
Figure 7. A plot of volume magnetic susceptibility as a function of distance for an array of different volumes of a standard solution (1.23 × 10⁻⁴ mmol Fe, 9.5 g/L) of nMag adsorbed onto CarboHSP (see Section 2).
In order to ascertain the relative quantity of nMag required for differentiation against each of the proppants, samples were prepared by infiltrating a known amount of nMag solution into a known amount of proppant (see Section 2). Using the magnetic susceptibility data in , it is possible to determine the concentration dependency of the magnetic susceptibility, as shown in . These relationships can be used to determine the concentration of nMag that must be present to be able to differentiate nMag within the proppant pack.
Figure 8. Plot of volume magnetic susceptibility of frac sand or CarboHSP proppant and nMag as a function of the concentration of nMag (R2 = 0.996 and 0.986, respectively).
The concentration required for the detection of nMag against a proppant pack can be estimated assuming that the magnetic susceptibility needs to have a value that can be differentiated from the proppant. For example, the magnetic susceptibility of sand is −0.2 × 10⁻⁵ SI and we can assume that a signal of +0.2 × 10⁻⁵ SI can be readily differentiated. From , we can calculate the concentration of nMag must be 0.269 g/L. In a similar manner, if it is assumed that in the case of CarboHSP a signal of 50% greater than the background is needed, then a concentration of nMag of 1.01 g/L is required. Given these numbers, we can estimate the quantity of nMag as a function of the particle concentration as compared to either the mass of proppant (sand or CarboHSP) or the volume of frac fluid used ().
Table 2. Summary of estimated nMag required for detection above the proppant.
Based upon the mass of proppant used () we can estimate the amount of nMag required for each type of proppant (). Given that the cost of proppants vary between $0.22/kg (sand, $0.10/lb) and $1.32/kg (ceramic, $0.60/lb), and that we can estimate the raw material costs for nMag to be ca. $13,600/kg, the added cost ($0.9/kg sand or $3/kg ceramic) would be a significant increase over the proppant costs.
In a typical vertical well, ca. 220,000 kg (100,000 lbs) of proppant are used. In contrast, a multi-stage frac job will use approximately 440,000–660,000 kg of proppant per stage, resulting in a total consumption as high as 5.4 million kg (12 million lbs). Thus, if we assume a value of 440,000 kg (200,000 lbs) for a single stage, the amount of nMag required to allow detection above the background of the sand proppant is calculated from to be 29.6 kg (13.4 lb). In the case of a ceramic proppant, such as CarboHSP, this value would be 101 kg (45.8 lb). With a multi-stage frac job, a total amount of nMag could be as high as 4000 kg.
The estimates above are based upon the relationship of the nMag to the proppant placed in the frac. However, this mass of proppant is placed using a large volume of water (frac fluid) and the proppant does not go to all the areas that are fractured. Thus, we need some estimation of the amount of nMag that would be required to maintain a concentration sufficient for detection based on the volume of water used in the frac fluid. In Texas, estimates of water use for hydraulic fracturing vary from 10,600 m3 (2.8 million gallons) to 21,500 m3 (5.6 million gallons) per well.[Citation26] Taking a value of 3 million gallons and the concentration required, an estimate of the amount of nMag needed for a well based upon the frac fluid volume can be estimated, see .
3.2. Detectability of nMag versus shale gas reservoir rock
In the forgoing discussion, we were simply concerned with the detection of nMag against a background of the proppant ((a)) that creates a pack to maintain permeability of the well. However, the detection of nMag in the borehole will be against a background of not only the proppant, but also the oil/gas, connate fluids, and the reservoir rock itself ((b)). We have previously shown that the petroleum reservoir fluids have a range of components for which the mass susceptibility may be measured;[Citation27] however, their contributions will be lower than that of the proppant or the source rock.[Citation21] In order to ascertain the levels of nMag required to provide a contrast with the reservoir rock, we have measured the magnetic susceptibility of two shale cores (see Section 2): Harrison (Faulkner County, AR) and Rackley (Cleburne County, AR). Both are typical shale gas well reservoirs.
Figure 9. Illustrations of proppant in a fracture, with the highlighted areas showing (a) detection area against a background of the proppant versus (b) detection area against a background of proppant, oil/gas, connate fluids, and reservoir rock.
shows the volume magnetic susceptibility of the core as a function of the reservoir depth. It is clearly seen that the reservoir rock is generally paramagnetic rather than diamagnetic as a function of the mineral composition of typical shales. Paramagnetic clays, like illite (K,H2O)(Al,Mg,Fe)2(Si,Al)4O10[(OH)2,(H2O)], show a small, positive magnetic susceptibility, while iron bearing paramagnetic minerals like siderite (FeCO3) have higher positive magnetic susceptibilities. A small concentration of a ferrimagnetic mineral would also give a significant positive magnetic susceptibility. For both shale cores, there appears a representative background level of the magnetic susceptibility of ca. 45 × 10−5–50 × 10−5 SI. However, there are regions that have magnetic susceptibilities of >200 × 10−5 SI (see ). These regions could be due to higher concentrations of ferrimagnetic particles or due to regions of a paramagnetic mineral like siderite.
Figure 10. Plots of volume magnetic susceptibility (10−5 SI) for (a) Harrison and (b) Rackley shale cores as a function of the reservoir depth (m).
Note: The concentration of nMag (g/L) required for a particular magnetic susceptibility is shown along with background and peak values of the shale cores (dashed lines).
Using the quantitative data discussed above, we can calculate the quantity of nMag required to differentiate from a representative background and the peak values (). The results are given in . A comparison of the concentrations required to be added to a frac fluid in order to differentiate the nMag from the reservoir rock is significantly higher than that needed to differentiate from the proppant. Between 8.64 × 10⁴ and 2.43 × 10⁵ kg per well would be needed with a cost of $1–3 billion per well.
Table 3. Summary of estimated nMag required for detection above the reservoir rock.
4. Conclusions
It is clear that while the quantities of the nMag are high as compared to biomedical applications, this work has demonstrated such materials could theoretically be used as contrast agents in shale gas reservoirs. The particles could be pumped into the well with the fracturing fluid and detected in the well via a volume magnetic susceptibility detector, similar to the one used in the above experiments. Unfortunately, the biggest issue would be the high cost of the quantities required. Two solutions to this are possible. First, the cost predictions used herein do not take into account either costs of manufacture of the nMag (which would increase the cost) or the lowering of costs through bulk manufacturing methods and alternative (cheaper) starting materials; only the cost of the starting materials used were calculated. Thus, significant lowering of costs would clearly be beneficial. Second, it would be useful for any downhole contrast agent to have an even higher magnetic susceptibility than nMag and particularly a higher magnetic susceptibility at downhole reservoir temperatures. It would be especially useful if the magnetic susceptibility were temperature independent across the range of temperatures experienced downhole. Thus, as the susceptibility of the reservoir rock and/or the proppant decreases with increasing temperature,[Citation22] the signal-to-noise will be enhanced. In this regard, the superparamagnetic mixed oxide spinels, Mn(1−x)ZnxFe2O4, are known to have a higher magnetic susceptibility than magnetite making it an ideal candidate and worth further investigation.[Citation28]
Acknowledgements
Financial support of this work was from the Robert A. Welch Foundation (C-0002) and the Welsh Government Sêr Cymru Programme. We thank nanoAlberta, part of Alberta Innovates Technology Futures (for a grant to D.K. Potter to support joint research with A.R. Barron) and FracEnsure, Inc. (for a grant to A.R. Barron to support joint research with D.K. Potter).
References
- Nicot JP, Scanlon BR. Water use for shale-gas production in Texas. US Environ Sci Technol. 2012;46:3580–3586.
- Gregory KB, Vidic RD, Dzombak DA. Water management challenges associated with the production of shale gas by hydraulic fracturing. Elements. 2011;7:181–186.
- Dammel JA, Bielicki JM, Pollak MF, Wilson EJ. A tale of two technologies: hydraulic fracturing and geologic carbon sequestration. Environ Sci Technol. 2011;45:5075–5076.
- Warlick D. Gas shale and CBM development in North America. Oil Gas Finance J. 2006;3:1.
- Sahimi M. Flow and transport in porous media and fractured rock: from classical methods to modern approaches second, revised, and enlarged edition. Weinheim (Germany): Wiley-VCH; 2012.
- Nguyen PD, inventor, Fulton DD, inventor; Halliburton Energy Services, Inc., assignee. Electroconductive proppant compositions and related methods. US patent 7,073,581. 2006.
- Hwang CC, Wang L, Lu W, Ruan G, Kini GC, Xiang C, Samuel ELG, Shi W, Kan AT, Wong MS, Tomson MB, Tour JM. Highly stable carbon nanoparticles designed for downhole hydrocarbon detection. Energy Environ Sci. 2012;5:8304–8309.
- McDaniel RR, inventor, McCarthy SM, inventor, Smith M, inventor; Momentive Specialty Chemicals, Inc., assignee. Methods and compositions for determination of fracture geometry in subterranean formations. US patent 8,129,318. 2012.
- Maguire-Boyle SJ, Garner DJ, Heimann JE, Gao L, Orbaek AW, Barron AR. Automated method for determining the flow of surface functionalized nanoparticles through a hydraulically fractured mineral formation using plasmonic silver nanoparticles. Environ Sci Process Impacts. 2014;16:220–231.
- Barron AR, Tour JM, Busnaina AA, Jung YJ, Somu S, Kanj MY, Potter DK, Resasco D, Ullo J. Big things in small packages. Oilfield Rev. 2010;3:38–49.
- Babes L, Denizot B, Tanguy G, Le Jeune JJ, Jallet P. Synthesis of iron oxide nanoparticles used as MRI contrast agents: a parametric study. J Colloid Interface Sci. 1999;212:474–482.
- Sun C, Lee JSH, Zhang M. Magnetic nanoparticles in MR imaging and drug delivery. Adv Drug Deliv Rev. 2008;60:1252–1265.
- Lee H, Lee E, Kim DK, Jang NK, Jeong YY, Jon S. Antibiofouling polymer-coated superparamagnetic iron oxide nanoparticles as potential magnetic resonance contrast agents for in vivo cancer imaging. J Am Chem Soc. 2006;128:7383–7389.
- Tiefenauer LX, Tschirky A, Kühne G, Andres RY. In vivo evaluation of magnetite nanoparticles for use as a tumor contrast agent in MRI. Magn Reson Imaging. 1996;14:391–402.
- Roca AG, Veintemillas-Verdaguer S, Port M, Robic C, Serna CJ, Morales MP. Effect of nanoparticle and aggregate size on the relaxometric properties of MR contrast agents based on high quality magnetite nanoparticles. J Phys Chem B. 2009;113:7033–7039.
- Jain TK, Reddy MK, Morales MA, Leslie-Pelecky DL, Labhasetwar V. Biodistribution, clearance, and biocompatibility of iron oxide magnetic nanoparticles in rats. Mol Pharm. 2008;5:316–327.
- Hrouda F. Magnetic anisotropy of rocks and its applications in geology and geophysics. Surv Geophys. 1982;5:37–82.
- Cogné JP. TRM deviations in anisotropic assemblages of multidomain magnetite. Geophys J R Astr Soc. 1987;91:1013–1023.
- Stephenson A, Sadikun S, Potter DK. A theoretical and experimental comparison of the anisotropies of magnetic susceptibility and remanence in rocks and minerals. Geophys J R Astr Soc. 1986;84:185–200.
- Potter DK, Stephenson A. Single-domain particles in rocks and magnetic fabric analysis. Geophys Res Lett. 1988;15:1097–1100.
- Potter DK. Magnetic susceptibility as a rapid non-destructive technique for improved petrophysical parameter prediction. Petrophysics. 2007;48:191–201.
- Ali A, Potter DK. Temperature dependence of the magnetic properties of reservoir rocks and minerals and implications for in situ borehole predictions of petrophysical parameters. Geophysics. 2012;77:WA211–WA221.
- Sun S, Zeng H, Robinson DB, Raoux S, Rice PM, Wang SX, Li G. Monodisperse MFe2O4 (M = Fe, Co, Mn) nanoparticles. J Am Chem Soc. 2004;126:273–279.
- Sun S, Zeng H. Size-controlled synthesis of magnetite nanoparticles. J Am Chem Soc. 2002;124:8204–8205.
- Wadell H. Volume, shape, and roundness of quartz particles. J Geol. 1935;43:250–280.
- Rahm BG, Riha SJ. Toward strategic management of shale gas development: regional, collective impacts on water resources. Environ Sci Policy. 2012;17:12–23.
- Ivakhnenko OP, Potter DK. Magnetic susceptibility of petroleum reservoir fluids. Phys Chem Earth. 2004;29:899–907.
- Arulmurugan R, Jeyadevan B, Vaidyanathan G, Sendhilnathan S. Effect of zinc substitution on Co–Zn and Mn–Zn ferrite nanoparticles prepared by co-precipitation. J Magn Magn Mater. 2005;288:470–477.