
Abstract
Copper-doped TiO2 nanoparticles were synthesised using an ultrasonic-assisted sol–gel method with various doping concentrations from 0 to 2.5 at.%. The samples were characterised by X-ray diffraction, UV–vis diffuse reflectance spectroscopy (UV–vis), transmission electron microscopy (TEM), Brunauer–Emmett–Teller surface area determination, and zeta potential. The presence of copper in TiO2 crystal structure was revealed by UV–vis spectra, and the TEM analysis showed that particles are mainly spherical around the size range of 15–20 nm. In addition, doping copper into TiO2 lattice caused a decrease in the surface area due to the aggregation of nanoparticles and a shift of isoelectric point towards lower pH when the dopant concentration increased. The photocatalytic reactivity of these materials was evaluated by the degradation of methylene blue and methyl orange under the UV light. The effect of the initial solution pH on the adsorption capacity and the photocatalytic behaviour of the Cu-doped TiO2 in the decolourisation of these dyes were also studied.
1. Introduction
TiO2 is considered as an efficient photocatalyst for decomposing a large variety of environmental contaminants, such as organic materials, bacteria, and viruses.[Citation1,Citation2] However, the most crucial problem in using TiO2 as a catalyst is the low photoquantum yield in the photocatalysis process that arises from the fast recombination of photogenerated electrons and holes. Moreover, pure TiO2 is inactive under illumination by visible light due to its wide band gap (3.18 eV for anatase form). Hence, it is extremely difficult to make use of the vast potential of the solar photocatalysis because in solar energy applications only ca. 3% of the sunlight is absorbed.[Citation3] By doping metal and non-metal ions, the electronic structure and the optical properties of TiO2 particles are altered in order to improve their response, slow down the recombination rate of the electron-hole pairs, and to enhance the interfacial charge transfer efficiency.[Citation4–6]
Synthesis methods have a great influence on the properties of TiO2 photocatalysts, such as the morphology, structure, surface properties, and phase transformation.[Citation6] Ultrasound is an effective method to create the fine dispersion. The extremely fine-size dispersion increases the surface area available to the reactants, thus improving the chemical reaction by enhanced mass transfer. Using ultrasonic irradiation in synthesising materials resulted in smaller particles and also promoted greater homogeneity in terms of size of the particles.[Citation7] The ultrasonic-assisted sol–gel technique is used during or after the precipitation of the titanium salt/alkoxide precursor in water or the mixture of alcohol and water to form TiO2 nanoparticles within a short time frame. Under ultrasound irradiation, the micro-cavitation bubbles are formed in the liquid environment, develop and explode intensely in an extremely short duration, creating localised hot spots with high temperatures (∼5000 K), high pressures (∼1000 atm), and heating and cooling rates above 1010 K/s. During ultrasonic irradiation of liquid-powder suspensions, cavitation and the shockwaves can create high-speed interparticle collisions. The resultant collisions can cause dramatic changes in the surface morphology, composition, and reactivity.[Citation8,Citation9] Furthermore, the collapse conditions are dependent on the intensity and the frequency of the ultrasound. Operating variables, such as the ultrasonic power density and frequency, reactor size, etc., may have a great impact on the properties and morphology of TiO2 nanoparticles. Thus, by using the ultrasonic-assisted sol–gel synthesis method, these properties of TiO2 can be controlled.[Citation10–12]
This work discusses the synthesis of copper-doped TiO2 photocatalysts with different copper loadings using a sol–gel technique supported by ultrasound and the characterised physical properties of samples including crystalline structure, diffuse reflectance spectra, transmission electron microscopy (TEM), Brunauer–Emmett–Teller (BET) surface area, and zeta potential. The photocatalytic activity of prepared particles was evaluated based on the decolourisation of the anionic methyl orange (MO) dye and the cationic methylene blue (MB) dye under UV light irradiation. Furthermore, the effect of the solution pH on the adsorption behaviour and the photocatalytic degradation of these dyes was also considered.
2. Experimental procedure
2.1. Materials
As starting precursors, the following reagents and apparatus were employed: titanium (IV) isopropoxide (TTIP, Sigma-Aldrich, 97%) as TiO2 source; copper (II) nitrate trihydrate (Sigma-Aldrich, 99%) as dopant source; absolute ethanol (Sigma-Aldrich, ≥ 99,8%) as solvent; acetic acid (Sigma-Aldrich, ≥ 99,8%); diethanol amine (Sigma-Aldrich, 99%); triblock poly(ethylene oxide)-b-poly(propylene oxide)-b-poly(ethylene oxide) copolymers Pluronic P123 (EO20PO70EO20, M = 5800, Sigma-Aldrich); deionised water and an ultrasonic horn (Cole-Palmer, USA, 500 W, 20 kHz).
2.2. Preparation of photocatalysts
Cu-doped TiO2 catalysts were derived via the ultrasonic-assisted sol–gel method according to the procedure used by Khodadadi et al. [Citation13] but P123 was used to replace PEG (poly ethylene glycol). First, TTIP was dissolved in absolute ethanol by stirring for 10 min. This solution was then added dropwise into another solution containing acetic acid, deionised water, and ethanol under magnetic stirring at room temperature. Pluronic P123 at 10 wt% was added into the above solution under vigorous stirring to obtain the TiO2 sol. Second, the dopant solution was prepared by adding a mixture of diethanol amine and ethanol into a copper nitrate salt solution dissolved in ethanol. After that, the dopant solution was added dropwise into the above-obtained TiO2 sol. The resulting transparent colloidal suspension was sonicated for 30 min, and aged at room temperature for 72 h to form the gel. Finally, the obtained gel was dried at 90 °C and ultimately was calcined at 500 °C for 2 h to obtain the final powder. In a typical procedure, the reaction was carried out with the following mole proportions: TTIP/ethanol/CH3COOH/H2O: 1:65:1.6:0.5. The concentration of Cu/Ti atom ratios varied from 0 to 2.5 at.%.
2.3. Characterisation of photocatalysts
The structural characterisation of the TiO2 nanoparticles was investigated by the X-ray diffraction (XRD) (Siemen D5000 diffractrometer) analysis. The measurement conditions were as follows: CuKα radiation (λ = 1.5406 Å) at U = 30 kV and I = 25 mA, 0.03o step size and 1 sec step time from 20o to 70o. The UV–vis diffuse reflectance spectroscopy was measured within the wavelength range of 200–800 nm using Jasco V-530 UV–vis spectrophotometer. The morphology and size of the catalyst samples was characterised by TEM using JEOL-JEM 1010. The specific surface area of the powder photocatalyst was measured using the BET method with a Micromeritics TriStar II 3020 (V1.03) for N2 BET at 77.3 K with a 5 s equilibration interval. The surface charge of the catalyst was examined using Zetasizer Nano Series (Malvern).
2.4. Photocatalytic degradation experiments
The photocatalytic activity of synthesised particles was evaluated by the degradation of MO and MB in suspension form. The experiment was performed with the following conditions: concentration of photocatalyst 2 g/l; MO and MB concentration of 15 mg/l, under continuous stirring condition at room temperature.
At the first stage, the experimental system was placed in the dark for 30 min for the adsorption on the catalyst surface or to break the chain of dyes in the absence of light radiation. Afterwards, the system was irradiated by 365 nm UV lamp (UVP 90-0019-01 Pen-Ray, 4.8 W). Samples were taken periodically, centrifuged, and the UV–vis spectrum peaks at a maximum wavelength λmax = 462 nm (MO) and λmax = 663 nm (MB) to determine the concentration of the solution were measured.
The photocatalytic activity of the synthesised materials was assessed by the reaction rate constant k (min−1). The degradation data showed a kinetic model of type 1: C/C0 = exp (–kt).[Citation14–16] C is the dye concentration (mg/l) in the radiation time t (min) and C0 is the initial concentration of the dye (mg/l).
3. Results and discussion
3.1. X-ray diffraction (XRD)
XRD was used to investigate the phase structure and the phase composition of TiO2 samples. The powdered XRD patterns of copper-doped TiO2 and pure TiO2 were given in . The XRD patterns showed broad peaks of anatase as the dominant phase. The distinctive peaks at 2θ = 25.3o; 37.8o; 47.7o; 54o, and 62.4o, corresponding to the anatase crystal planes, were observed in all the samples.[Citation17] In comparison to undoped TiO2 samples, the intensity of peaks of Cu-doped TiO2 photocatalysts was lower and broader, which suggested a decreasing degree of crystallinity. The possible reason is the substitution of Ti4+ by Cu2+ because of the similarity in ionic radius of Cu2+ (0.73 Å) to that of Ti4+ (0.64 Å). Nair et al. found that a dopant with an oxidation sate of 3+ or lower produced the oxygen vacancies in the lattice of TiO2 to maintain the charge neutrality.[Citation18] Therefore, the substitution of Cu2+ to Ti4+ increases the oxygen vacancies. As the dopant content increased, the diffusion of a few numbers of oxygen vacancies to the interstitial position or to the surface and grain boundary regions created the structural defects that affect the crystallinity of the material.[Citation19] Consequently, the crystallisation of the TiO2 anatase phase is lower and the peak intensity was weaker. Similar behaviours have also been observed in other transitional metals doping systems.[Citation19,Citation20]
Figure 1. XRD patterns of Cu-doped TiO2 catalysts.
No characteristic peaks of the copper oxide crystalline phase appeared in the XRD pattern of Cu-doped TiO2 photocatalyst samples. The reason may be that copper contained in the compound existed in the amorphous form, or the amount of copper was too low to detect by the XRD measurement or most copper ions were inserted into the crystalline structure of TiO2 and located at interstices or occupied some of the Ti lattice sites forming a solid solution of copper–titanium oxides. The obtained results are in accordance with the results from the previous articles.[Citation21]
3.2. UV–vis diffuse reflectance spectroscopy (UV-Vis)
provided the diffuse reflectance spectra of the Cu-doped TiO2 series. According to Colon et al.,[Citation22] the band at 210–270 nm would indicate the O2−(2p) →Cu2+(3d) ligand to the metal charge transfer transition. The absorption peaks shifted from 325 to 355 nm corresponding to the Cu content rise from 0% to 2.50% but there was no change in the position of the absorption edge of TiO2 except for 2.50% Cu–TiO2 sample. It is well known that CuO and Cu2O have electronic band gaps that are 1.7 and 2.1 eV, respectively.[Citation23,Citation24] Therefore, the absorption in the visible region from 400 to 600 nm was attributed to the presence of Cu+ clusters in partially reduced CuO matrix as well as (Cu–O–Cu)2+ clusters. The absorption band at 600–800 nm indicated the crystalline and bulk CuO in octahedral symmetry.[Citation22] This large absorption band increased with the increase in the dopant concentration level. When the copper ion was inserted into the bulk TiO2 or on the surface sites, a rearrangement of the neighbouring atoms occurred to ensure charge balance, resulting in the lattice deformation. The lattice deformation caused by the substitution of Ti4+ by Cu2+ affects the electronic structure of TiO2 crystalline lattice, thus leading to the change in the optical absorption of TiO2.[Citation25]
Figure 2. UV–vis diffuse reflectance spectra of Cu-doped TiO2 catalysts.
3.3. Transmission electron microscopy (TEM)
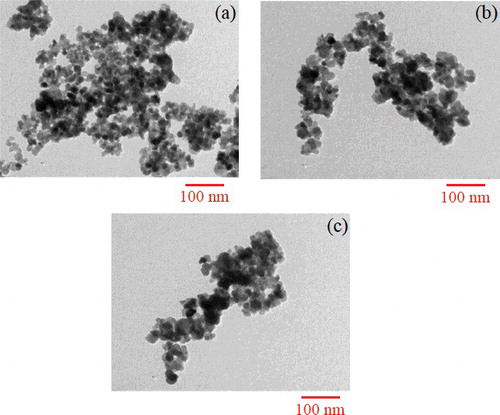
Typical TEM images of the photocatalyst samples () depicted the particle structures to be spherical, and quite similar to each other. The size of the formed nanoparticles was within the range of 15–20 nm. Compared to the previous studies, the particle size of Cu–TiO2 nanoparticles prepared by the ultrasonic-assisted sol-gel method was more homogenous and smaller than that of the doped TiO2 ones using other synthesising methods.[Citation26–29] From the TEM image, it could be observed that the TiO2 nanoparticles were aggregated to form secondary particles with a relatively large size of 25–50 nm when the Cu dopant concentration rose from 0.0% to 0.15% and 2.5%. Moreover, the morphology obtained in TEM images did not indicate the presence of localised deposition of the added metal oxides. It was believed that the doped metal ions were evenly dispersed or incorporated into the crystal structure of TiO2 during the preparation as indicated by the XRD patterns.
Figure 3. TEM micrographs of Cu-doped TiO2 (a) 0% Cu–TiO2; (b) 0.15% Cu–TiO2 and (c) 2.5% Cu–TiO2.
3.4. Zeta potential
Zeta potential measurements were used to elucidate the solid/liquid interfacial charge processes and interactions between particulate surfaces. presented the zeta potential of aqueous dispersion of Cu-doped TiO2 photocatalysts. The pH at which the zeta potential shifted to zero (point of zero charge Pzc), was found at about 6–6.5. Around this pH, the nanoparticles favourably aggregated. The isoelectric point Pzc had a tendency to move towards lower pH as the Cu content increased. The zeta potential measurement revealed that all the Cu-doped TiO2 nanoparticles exhibited the transition from the positive potential at low pH to the negative potential at high pH.
Figure 4. Variation of zeta potential versus pH for selected Cu-doped TiO2 catalysts.
3.5. BET
A specific surface area of the undoped TiO2 catalyst was 79 m2/g, whereas the surface area of the copper-doped TiO2 samples declined from 65 to 38 m2/g when the copper content increased to 0.05% and 2.5%, respectively (). It could be inferred that the copper doping on the TiO2 surface changes the surface area of the catalyst. This decrease might be caused by the aggregation of nanoparticles as observed in TEM images. A similar finding was reported by Ganesh et al.[Citation26]
Table 1. BET surface area of selected Cu-doped TiO2 catalysts.
3.6. Photocatalytic activity
3.6.1. Dark adsorption of MO and MB on the Cu-doped TiO2 surface
The solution pH is the key factor for the photocatalytic reaction and can have an impact on the adsorption of dyes on the photocatalyst surface. showed the relationship between the pH value and the adsorption capacity of MO and MB when using various Cu-doped TiO2. The adsorption capacity of MO on the Cu-doped TiO2 catalyst surface was very high at acidic condition (pH = 3), but decreased when the solution pH went up from 3 to 6, and no adsorption occurred at pH = 9. Adsorption capacity decreased when pH rose due to MO containing negatively charged sulfonate groups. Thus, at acidic conditions, the interaction between a positively charged catalyst surface and negatively charged dyes favours adsorption.[Citation30,Citation31] The results also indicated that the adsorption capacity of MO reduced as the volume of the copper content increased. The reason was that the substitution of Ti4+ by Cu2+ in the TiO2 structure resulted in a more negatively charged surface.[Citation29] Therefore, the adsorption capacity of MO on the Cu-doped TiO2 catalyst decreased because the charge of the catalyst surface was more negatively when the copper dopant concentration was higher.
Table 2. Adsorption amount of methyl orange and methylene blue by using various Cu-doped TiO2.
In contrast, MB is a cationic dye when dissolved in water. Its adsorptive behaviour was opposite to that of MO. At low pH value (pH = 3), the adsorption was not recognised. However, when the solution pH increased from 3 to 9, the larger amount of MB was adsorbed on the catalyst surface and the maximum dye uptake was observed in the pH range of 9. In the acidic medium, positively charged surfaces of the catalyst tended to oppose the adsorption of cationic adsorbate species. When the pH of the dye solution became more basic, the surface tends to acquire negative charge, thereby resulting in an increased adsorption of dyes because of the rising electrostatic attraction between the positively charged dye and the negatively charged catalyst, this finding is in agreement with previously reported results.[Citation32,Citation33] Similar to the above explanation, the charge of the catalyst surface was more negative as the quantity of the copper content went up, thus enhancing the adsorption capacity of the cationic dye, such as MB on Cu-doped TiO2 catalysts.
It is interesting to note that increasing the copper level decreased the adsorbed amount of MO in the acidic and neutral medium but caused a rise in that of MB in the neutral and basic medium, while BET measurements presented a reduction in the surface area of photocatalysts since the dopant concentration increased. These findings led to the conclusion that a reduction in the BET surface area has an insignificant effect on the adsorption capacity of dyes onto the Cu-doped TiO2 catalysts surface.
3.6.2. Photodegradation of MO and MB on the Cu-doped TiO2 surface
The activity of the prepared particles was measured based on the rate constant k of the photocatalytic degradation reaction of MO and MB. Photodegradation kinetic dependence on the dopant content and pH was given in .
Table 3. Rate constant of the decolourisation reaction of methyl orange and methylene blue by using various Cu-doped TiO2.
Results present that the photocatalytic activity of synthesised particles in the decolourisation reaction of MB was significantly higher than that in the decolourisation reaction of MO. As can be seen from the results, the optimal dopant concentration was different for each dye. For MO, the optimal concentration of dopant over Cu was 0.05% and for MB, it was 0.15% in the same experimental conditions.
According to the presented data, at pH = 6, in the degradation of MO, the photocatalytic activity of Cu-doped TiO2 nanoparticles increased when the amount of Cu went up from 0% to 0.05% under the same experimental conditions. However, when the Cu content was raised to 0.15%, the photocatalytic activity declined nearly to that of the undoped sample. In the degradation of MB, the optimal amount of dopants was 0.15% and at this content, the rate constant of the degradation reaction doubled in comparison to the rate of the undoped sample. Beyond this optimal value, the photocatalytic activity declined rapidly if the content of dopant is further increased. When the dopant concentration reached 0.5%, the photocatalytic activity was lower than that of pure TiO2 samples. Choi et al. reported that there appears to be an optimum content of doping ion in TiO2. A metal ion dopant serves not only as a direct mediator of the interfacial charge transfer but also as a recombination centre.[Citation34] At optimal dopant concentration levels, the degradation rate of dyes was highest, which could be attributed to the following factors.
First, Xin et al. suggested that the copper ion deposited on the TiO2 particles could create oxygen vacancies on the surface layer of TiO2 which could effectively trap the photogenerate electrons. While at high concentrations of dopant ions, the excessive oxygen vacancies and Cu species could become the recombination centres of photoinduced electrons and holes, which are detrimental to the photocatalytic activity of the catalyst.[Citation35]
Second, due to the difference in the electron negativity between Ti and Cu, the Ti–O–Cu formed via Cu2+ entering into the shallow surface of TiO2 could promote the charges to transfer, resulting in an increase of the photocatalytic activity.[Citation36]
Third, copper ion doping can cause a lattice deformation and produce defects in the crystal. The defects can inhibit the recombination of electron-hole pairs and enhances the activity.[Citation36] However, when the content of copper ion was higher than its optimal level, an excess amount of copper ion could not diffuse into the TiO2 lattice, but deposits on the surface of TiO2 particles, leading to the hindrance of UV light penetration reaching the surface of TiO2, which could block the active sites of TiO2 and therefore inhibits the photocatalytic activity.[Citation37] On the other hand, it was also reported in the literature that as the metal loading increases, agglomeration of metal particles is believed to occur and decrease the photocatalytic activity of photocatalyst.[Citation27]
Replacement of Cu ions for Ti ions within the TiO2 crystalline matrix resulted in a more negatively charged surface. Consequently, the anionic dyes adsorption capacity reduced and cationic dyes adsorption capacity rose when the dopant content increased. The optimal copper concentration for the photodegradation of MO was very small, just 0.05% due to the low adsorption of MO on the surface of the photocatalyst as Cu was doped into the TiO2 lattice. In this case, an increase in the photoreaction rate was attributed to the effective charge separation of photogenerated electrons and holes pairs. On the other hand, for the removal of MB from aqueous solutions, the optimal dopant content reached 0.15% and the reaction rate constant doubled as compared to that of pristine TiO2, thanks to not only an improvement of the charge separation within the excited photocatalyst but also an increased MB adsorption as the copper content went up.
and showed the photocatalytic activity of catalyst with the optimal copper dopant concentration in the degradation of MO and MB at different kinds of medium (acid, neutral, and base). The adsorptions of MO and MB on Cu-doped TiO2 powders were carried out in dark conditions for 30 min to reach the adsorption equilibrium. By using 0.05% Cu–TiO2, the amount of adsorbed MO after 30 min in dark was 0.23, 0.06, and 0 mg/g at pH 3, 6, and 9, respectively. Besides, the amount of MO was removed in 360 reaction minutes under Ultraviolet A (UVA) irradiation was 100%, 95%, and 71% separately and the k values was 0.0167, 0.0084, and 0.0036 min−1 corresponding to the above pH values. In the case of the MB object, the MB adsorption amount on 0.15% Cu–TiO2 catalyst after 30 min was 0, 1.16, and 7.71 mg/g. At pH 9, MB was completely removed after 30 reaction minutes. At pH 3, it took 300 reaction minutes to treat MB entirely. The k values of photodegradation of MB were 0.0169, 0.0289, and 0.088 min−1 at pH 3, 6, and 9, respectively. The results confirmed that the photocatalytic activity of as-synthesised samples strongly depend on the adsorption of MO and MB molecules on the catalyst surface which is caused by the solution pH.
Figure 5. Photodegradation of methyl orange by 0.05% Cu–TiO2 catalyst as a function of irradiation time: (a) disappearance of MO by adsorption and photocatalysis and (b) rate constant of the decolourisation reaction.
Figure 6. Photodegradation of methylene blue by 0.15% Cu–TiO2 catalyst as a function of irradiation time: (a) disappearance of MB by adsorption and photocatalysis and (b) rate constant of the decolourisation reaction.
4. Conclusion
In summary, copper-doped titanium dioxide photocatalysts were prepared by the combination of the sol–gel process via an ultrasonic technique. Influence of initial pH on the photocatalytic degradation of the anionic dye (MO) and the cationic dye (MB) in the presence of Cu–TiO2 under UVA irradiation was investigated. The results suggested that the adsorption capacity of MB increased with rising pH and copper content, whereas that of MO was favoured at low pH and the dopant concentration. Moreover, the efficiency of dyes photocatalytic reaction went up corresponding to the increase of adsorption capacity because the preliminary adsorption process of dye molecules onto the catalyst surface is an important step for the photocatalytic oxidation to take place. Doping of copper greatly improves the photocatalytic activity of TiO2 in the decomposition of MO and MB under visible light irradiation with an optimal doping concentration of 0.05% and 0.15%. However, when the copper content is higher than the optimal value, the dye removal efficiency declines.
Disclosure statement
No potential conflict of interest was reported by the authors.
Additional information
Funding
References
- Diebold U. The surface science of titanium dioxide. Surf Sci Rep. 2003;48(5–8):53–229.
- Nakano R, Hara M, Ishiguro H, et al. Broad spectrum microbicidal activity of photocatalysis by TiO2. Catalysts. 2013;3(1):310–323.
- Rauf MA, Meetani MA, Hisaindee S. An overview on the photocatalytic degradation of azo dyes in the presence of TiO2 doped with selective transition metals. Desalination. 2011;276(1–3):13–27.
- Linsebigler AL, Lu G, Yates JT. Photocatalysis on TiO2 surfaces: principles, mechanisms, and selected results. Chem Rev. 1995;95(3):735–758.
- Malato S, Fernández-Ibáñez P, Maldonado MI, et al. Decontamination and disinfection of water by solar photocatalysis: recent overview and trends. Catal Today. 2009;147(1):1–59.
- Chen X, Mao SS. Titanium dioxide nanomaterials: synthesis, properties, modifications, and applications. Chem Rev. 2007;107(7):2891–2959.
- Peters D. Ultrasound in materials chemistry. J Mater Chem. 1996;6(10):1605–1618.
- Patil MN, Pandit AB. Cavitation – a novel technique for making stable nano-suspensions. Ultrason Sonochem. 2007;14(5):519–530.
- Suslick KS. Kirk-othmer encyclopedia of chemical technology. 4th ed. New York, NY: John Wiley and Sons; 1998. p. 516–541.
- Duvarci ÖÇ, Çiftçioğlu M. Preparation and characterization of nanocrystalline titania powders by sonochemical synthesis. Powder Technol. 2012;228:231–240.
- Prasad K, Pinjari DV, Pandit AB, et al. Phase transformation of nanostructured titanium dioxide from anatase-to-rutile via combined ultrasound assisted sol–gel technique. Ultrason Sonochem. 2010;17(2):409–415.
- Prasad K, Pinjari DV, Pandit AB, et al. Synthesis of zirconium dioxide by ultrasound assisted precipitation: effect of calcination temperature. Ultrason Sonochem. 2011;18(5):1128–1137.
- Khodadadi B, Sabeti M, Moradi S, et al. Synthesis of Cu-TiO2 nanocomposite and investigation of the effectiveness of PEG, Pectin, and CMC as additives. J Appl Chem Res. 2012;6(1):33–41.
- Malengreaux CM, Timmermans A, Pirard SL, et al. Optimized deposition of TiO2 thin films produced by a non-aqueous sol-gel method and quantification of their photocatalytic activity. Chem Eng J. 2012;195–196:347–358.
- Sayılkan F, Asiltürk M, Tatar P, et al. Photocatalytic performance of Sn-doped TiO2 nanostructured mono and double layer thin films for malachite green dye degradation under UV and vis-lights. J Hazard Mater. 2007;144(1–2):140–146.
- Valente JPS, Padilha PM, Florentino AO. Studies on the adsorption and kinetics of photodegradation of a model compound for heterogeneous photocatalysis onto TiO2. Chemosphere. 2006;64(7):1128–1133.
- Asiltürk M, Sayılkan F, Arpaç E. Effect of Fe3+ ion doping to TiO2 on the photocatalytic degradation of malachite green dye under UV and vis-irradiation. J Photochem Photobiol. 2009;A 203(1):64–71.
- Nair J, Nair P, Mizukami F, et al. Microstructure and phase transformation behavior of doped nanostructured titania. Mater Res Bull. 1999;34(8):1275–1290.
- Choudhury B, Choudhury A. Structural, optical and ferromagnetic properties of Cr doped TiO2 nanoparticles. Mater Sci Eng. 2013;B 178(11):794–800.
- Wang Z, Yang G, Biswas P, et al. Processing of iron-doped titania powders in flame aerosol reactors. Powder Technol. 2001;114(1–3):197–204.
- Bu D, Zhuang H. Synthesis, characterization, and photocatalytic studies of copper-doped TiO2 hollow spheres using rape pollen as a novel biotemplate. Catal Commun. 2012;29(5):24–28.
- Colón G, Maicu M, Hidalgo MC, et al. Cu-doped TiO2 systems with improved photocatalytic activity. Appl Catal. 2006;67(1–2):41–51.
- Mishima A. Optical absorption in the double-layer two-dimensional two-band model. Chin J Phys. 1996;34(2):347–351.
- Nie X, Wei SH, Zhang SB. First-principles study of transparent p-type conductive SrCu2O2 and related compounds. Phys Rev B. 2002;65(7):075111.
- Li L, Liu J, Su Y, et al. Surface doping for photocatalytic purposes: relations between particle size, surface modifications, and photoactivity of SnO2:Zn2+nanocrystals. Nanotechnology. 2009;20(15):155706.
- Ganesh I, Kumar PP, Annapoorna I, et al. Preparation and characterization of Cu-doped TiO2 materials for electrochemical, photoelectrochemical, and photocatalytic applications. Appl Surf Sci. 2014;293:229–247.
- Yoong LS, Chong FK, Dutta BK. Development of copper-doped TiO2 photocatalyst for hydrogen production under visible light. Energy. 2009;34(10):1652–1661.
- Sahu M, Wu B, Zhu L, Jacobson C, et al. Role of dopant concentration, crystal phase and particle size on microbial inactivation of Cu-doped TiO2 nanoparticles. Nanotechnology. 2011;22(41):415704–415709.
- Sahu M, Biswas P. Single-step processing of copper-doped titania nanomaterials in a flame aerosol reactor. Nanoscale Res Lett. 2011;6:441.
- Lachheb H, Puzenat E, Houas A, et al. Photocatalytic degradation of various types of dyes (alizarin S, crocein orange G, methyl red, congo red, methylene blue) in water by UV-irradiated titania. Appl Catal. 2002;B 39(1):75–90.
- Oakes J, Gratton P. Kinetic investigations of the oxidation of methyl orange and substituted arylazonaphthol dyes by peracids in aqueous solution. J Chem Soc Perkin Trans. 1998;2(12):2563–2568.
- Haque E, Jun JW, Jhung SH. Adsorptive removal of methyl orange and methylene blue from aqueous solution with a metal-organic framework material, iron terephthalate (MOF-235). J Hazard Mater. 2011;185(1):507–511.
- Singh KP, Mohan D, Sinha S, et al. Color removal from wastewater using low-cost activated carbon derived from agricultural waste material. Ind Eng Chem Res. 2003;42(9):1965–1976.
- Choi W, Termin A, Hoffmann MR. The role of metal ion dopants in quantum-sized TiO2: Correlation between photoreactivity and charge carrier recombination dynamics. J Phys Chem. 1994;98(51):13669–13679.
- Xin B, Wang P, Ding D, et al. Effect of surface species on Cu-TiO2 photocatalytic activity. Appl Surf Sci. 2008;254(9):2569–2574.
- Li Y, Peng S, Jiang F, et al. Effect of doping TiO2 with alkaline-earth metal ions on its photocatalytic activity. J Serb Chem Soc. 2007;72(4):393–402.
- Riaz N, Kait CF, Man ZB, et al. Visible light photodegradation of azo dye by Cu/TiO2. Adv Mater Res. 2014;917:151–159.