
Abstract
Nanofluids are a new class of fluids where nanosized solid particles are dispersed in a liquid medium. This study aims to experimentally investigate the production of gold nanofluids using catechin (CAT), a polyphenolic compound. The characterisation of the green-synthesised nanoparticles using UV–visible spectrophotometer, differential scanning calorimeter, dielectric spectroscopy, and transmission electron microscopy, attempts to generate information to understand the properties of green-synthesised gold nanofluids. Four nanofluids were prepared by varying their concentrations between CAT and tannic acid to form gold nanoparticles (AuNP) in water. The gold nanofluids exhibited interesting thermal, surface plasmon resonance, and dielectric properties. The formation of the AuNP was studied using two different methods using transmission electron microscope and they exhibited interesting growth patterns within 1 minute. These results are significant as they shed light on the importance of the onset of the AuNP formation.
1. Introduction
Nanofluids are nanoscale colloidal suspensions having a two phase system (solid phase containing condensed nanomaterial and a liquid phase). Nanofluids (nano particle fluid suspension) are engineered by suspending nanoparticles in aqueous or organic medium.[Citation1–3] Nanofluid technology has seen a progressive development over the past decade and Eijkel and Van Den Berg [Citation4] stated that the study of the fundamental properties of the nanofluids will facilitate untapped possibilities for nanofluidic applications. Nanofluids can be produced by two methods, a two-step production method and a single-step production method. The two-step method is the most commonly used method for preparing nanofluids. Physical methods of particulate formation, such as inert-gas condensation, thermal spray, and ball milling are used to produce nanomaterials in a dry powder form as the first processing step. Then the nanosized powders are dispersed in a fluid (organic or aqueous medium) by intensive magnetic force agitation, ultra-sonication, high shear mixing, and homogenisation as a second processing step.[Citation5,Citation6]
As the nanopowder synthesis methods have already been scaled up to industrial production levels, the two-step method is the most widely used nanofluid synthesis procedure. Many researchers purchase commercially available nanoparticles in powder form and mix them with the base fluid with the potential addition of a surfactant.[Citation1] The most important issue facing the two-step method is the stability of the nanofluids. The high surface area and surface activity of the nanoparticles leads to aggregation and instability of the suspension in nanofluids. Thus, the nanofluid research community is searching for alternative techniques for developing stable nanofluids using a one-step method.
The single-step method involves chemical synthesis methods, where simultaneous formation and dispersion of nanoparticles occur within the host fluid. Water, oil, acetone, decene and ethylene glycol are some of the commonly used base fluids. The unit operations, such as drying, storage, transportation and dispersion of nanoparticles, which are required in the two-step method are reduced in the single-step method; thus, increasing the stability of the nanofluids and minimising the particulate agglomeration [Citation7] Some of the stabilisers used in the single-step method are tri-n-octylphosphine oxide,[Citation8] oleic acid,[Citation9] dodecane thiol,[Citation10] cetyltrimethyl ammonium – bromide,[Citation11] thiols,[Citation12] etc. The concentration and composition of the stabilisers vary depending upon different synthesis protocols. The most important disadvantage encountered in the single-step method for nanofluids synthesis is the presence of residual stabilisers in the nanofluids due to incomplete reactions. It is difficult to eliminate and purify the nanofluids from such impurities.[Citation5]
The study of colloidal suspensions with micron-sized particles has been in existence since way before the nanotechnological era, but their size posed significant corrosion problems in engineering applications.[Citation2] Rapid settling of millimetre- or micrometre-sized particles in fluid suspension is also a major problem. Such particles are not applicable for microsystems as they can clog the microfluidic channels. The uniform dispersion and stable suspension of nanoparticles in the host fluids can be a solution to this problem. The table below shows the stability results obtained when comparing microparticles and nanoparticles as adapted from Das et al. [Citation3] ().
Table 1. Benefits of nanofluids containing nanoparticles versus microparticles.[Citation3]
The previously described two-step production and single-step production methods either use toxic chemicals in their synthesis protocols or might require high-energy consuming equipment. Recent concerns and challenges facing nanotechnology are demanding the manufacturing of safe, less toxic, less energy-consuming nanoparticles. Looking forward, it is prudent to reason and develop green nanofluids by choosing safe nanoparticles with less toxic chemicals. Choi [Citation1] stated that low-cost, high-volume production of green nanofluids would be one of the most challenging future applied research directions. Hence, in order to address the above-mentioned issue, this study aims to use catechin (CAT), a polyphenolic compound present in various agricultural waste materials, such as grape seed, skin, stalk, pine needles etc., for successful synthesis of green gold nanofluids.
2. Materials and methods
2.1. Sample preparation
Chloroauric acid trihydrate (HAuCl4.3H2O), CAT and tannic acid were obtained from Sigma-Aldrich. One mM concentration of CAT, tannic acid and HAuCl4 solutions were prepared with deionised water. Four different nanofluids containing gold nanoparticle were prepared as shown in , and details of the composition are provided in .
Figure 1. Green nanofluids containing gold nanoparticles.
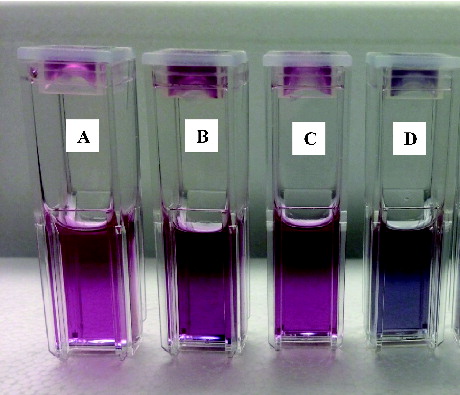
Table 2. Composition of four different nanofluids synthesised using catechin (CAT) and tannic acid (TAE).
2.2. UV–vis spectrophotometer
UV–visible spectra were recorded using a spectrophotometer (Ultrospec 2100 pro, Biochrom Ltd., Cambridge, England). The time of addition of the HAuCl4 solution to the polyphenol solution was considered as the start of the reaction. The colour change from the light yellow colour of HAuCl4 to pink indicates the formation of gold nanoparticles (AuNP). The synthesis of AuNP was monitored by periodic sampling of the nanoparticle solution using the wavescan mode of Ultrospec 2100 pro spectrophotometer from 400–800 nm wavelength with medium scan and a step size of 1 nm.
2.3. Differential scanning calorimeter
The thermal properties, such as specific heat, melting and boiling point of the gold nanofluids were studied using a differential scanning calorimeter (DSC Q-100 V9.8 built 296, TA Instruments, Texas, USA). Sample solutions containing AuNP (500 µl) were centrifuged at 8000 rpm for 4 min. The AuNP were collected and 20 µl of the AuNP were placed in small aluminium pans. The sample pans were hermetically sealed. The samples were made to cover the entire bottom surface of the pan to ensure good thermal contact. Care was taken to prevent over filling of the pan. Nitrogen was used as the purge gas as it is inert in nature. The rate of flow of nitrogen was 50 ml/min. Indium was used for calibration. The system was equilibrated at –20 °C, with ramp increase in temperature at 10 °C/min up to 400 °C. Reproducibility was checked by running the sample in triplicates. TA Universal Analysis V4.5A software was used for processing the obtained data.
2.4. Dielectric spectroscopy
The interactions of nanoparticles with microwave energy can be determined by studying the dielectric properties of the nanofluids. Dielectric spectroscopy measurements consist of a dielectric probe and a network analyser to measure the dielectric properties that a material possesses at the microwave frequency of interest.[Citation13] The dielectric constant (ɛ′) is an indicator of a material's capacity to store energy. The dielectric loss factor (ɛ″) is an indicator of the material's ability to convert the absorbed microwave energy into heat. The loss factor, tan δ = ɛ″/ɛ′, is an overall indicator representing the microwave heating capacity of the material. In order to determine the microwave heating ability of the AuNP, the dielectric properties were measured for the green AuNP nanofluids.
2.5. Transmission electron microscope
A drop of the nanofluid sample was added on carbon-coated TEM grids. The solution on the TEM grid was allowed to stand for 1 min and the extra solution was carefully removed by using the filter paper to form a thin film. The sample was left at room temperature until a dried film was obtained. Transmission electron microscopy (TEM) analysis were performed using FEI Tecnai G2 F20 Cryo-S/TEM operated at 200 kV with Gatan Ultrascan 4k × 4k Digital (CCD) Camera System.
3. Results and discussion
3.1. Thermal properties of nanofluids
Experimental results on the specific heats of nanofluids are very limited and recently this property is gaining importance for designing new products and applications.[Citation2] This study aims to provide experimental data on the specific heat of nanofluids containing AuNP.
The DSC is a useful instrument to determine the thermal transition of a material associated with heat flow as a function of time and temperature. Qualitative and quantitative data on the endothermic (heat absorption) and exothermic (heat evolution) processes of a material, during phase changes, can be obtained using a DSC thermogram. The DSC curve provides the fingerprint about the thermal behaviour of a compound under analysis. The peaks are observed by a characteristic shift from the base line either up or down. The area under the peak is proportional to the amount of heat developed during a reaction. From the DSC curves, enthalpies of transitions are computed by integrating the peak corresponding to the given transition.
In the DSC peak integration, the sample size is used to normalise the area under the peak and to obtain the experimental heat in joules per gram. On the y-axis, the heat units are expressed in watts per gram, while the x-axis is expressed as a function of both time and temperature. For engineering applications, knowledge of both time and temperature dependency is important; hence, in this study, the thermal properties of the AuNP nanofluids are expressed as a function of both parameters. The thermal behaviour of the nanofluids was monitored over a range of temperatures from –20 °C to 400 °C with an increase in temperature programmed at 10 °C/min.
The DSC thermogram presented in shows a sharp melting endothermic peak with an onset melting temperature at zero degrees Celsius for TAE + AuNP nanofluid. The peak maximum was at 9.30 °C ± 0.39 °C with the peak onset at 0 °C, stating the conversion of the solid phase to the liquid phase. The specific heat (Cp) of the system during this transition is 272.62 ± 13.93 kJ/g. shows the appearance of a broad transition for the TAE + AuNP nanofluids with an onset temperature at 78.65 °C ± 8.01 °C and the peak maximum was obtained at 99.72 °C ± 1.96 °C, which can be related to the phase change from liquid to vapour state. The interesting fact during this transition is the broad transition time and the Cp required during this transition which is 1705.80 ± 60.83 kJ/g. A secondary shoulder peak of the broad thermal transition was obtained around 14 min at 115.46 °C.
Figure 2. DSC thermogram for nanofluids containing AuNP. (a) TAE +AuNP nanofluid; (b) 1:1 CAT:TAE + AuNP nanofluid; (c) 1:4 CAT:TAE + AuNP nanofluid; (d) CAT + AuNP nanofluid; (e) overlay of DSC thermograms for the four AuNP nanofluids.
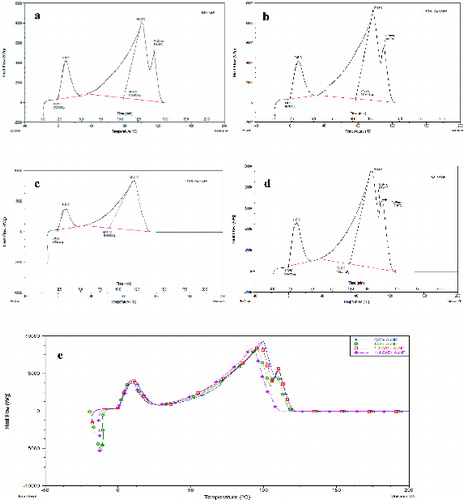
A similar trend for the DSC thermogram was obtained for the nanofluids synthesised using 1:1 CAT:TAE + AuNP. shows a melting endothermic peak with an onset melting temperature at zero degrees Celsius. The peak maximum was at 9.68 °C ± 5.59 °C with the peak onset at 0 °C, stating the conversion of the solid phase to the liquid phase. The specific heat (Cp) of the system during this transition is 289.74 ± 5.15 kJ/g. A broad thermal transition for the 1:1 CAT:TAE + AuNP nanofluids occurred with an onset temperature at 76.63 °C ± 0.86 °C and the peak maximum was obtained at 97.55 °C ± 0.38 °C, where the Cp required during this transition was 1911.34 ± 21.31 kJ/g along with a secondary peak around 14 min at 110.56 °C.
In the DSC thermogram for 1:4 CAT:TAE + AuNP nanofluid shown in (c), a large portion of the exothermic crystallisation process can be seen around –20 °C followed by a melting endothermic peak as the temperature rises. The peak maximum was at 8.94 °C ± 0.45 °C with the peak onset at 0 °C, stating the conversion of the solid phase to the liquid phase. The specific heat (Cp) of the system during this transition was 250.43 ± 15.81 kJ/g. shows the appearance of a broad transition for the TAE + AuNP nanofluids with an onset temperature at 63.85 °C ± 2.17 °C and the peak maximum was obtained at 94.58 °C ± 2.50 °C, and the Cp required during this transition was 1689.03 ± 95.25 kJ/g which is relatively lower than for the other nanofluids. The interesting thermal behaviour of 1:4 CAT:TAE + AuNP nanofluid is illustrated in the lower onset endothermic temperature for the first and the second peak, relatively lower Cp for both the thermal transitions, and disappearance of the secondary shoulder peak.
shows the DSC thermogram for CAT + AuNP, with a sharp melting endothermic peak with an onset melting temperature at –0.02 °C and the peak maximum was at 9.53 °C ± 0.55 °C stating the conversion of the solid phase to the liquid phase. The specific heat (Cp) of the system during this transition is comparatively higher to other nanofluids in this study, 297.00 ± 2.70 kJ/g. The broad thermal transition for CAT + AuNP nanofluids occurred with an onset temperature at 74.41 °C ± 8.44 °C and the peak maximum was obtained at 96.90 °C ± 0.90 °C, and the Cp required during this transition was 1944.76 ± 77.49 kJ/g. The CAT + AuNP nanofluid has interesting thermal properties as the specific heat for both the thermal transition were comparatively higher than for the other nanofluids, and the occurrence of two secondary shoulder peaks at 13 min at 108.21 °C and 110.99 °C. shows the overlay of the DSC thermographs of all the four green-synthesised gold nanofluids for visual comparison of their thermal behaviours. The overlay figure presented in clearly indicates the disappearance of the secondary peak for 1:4 CAT:TAE + AuNP nanofluids, the reason for such a behaviour will be explained while discussing further results.
The recent literature on nanofluids states that nanofluids have higher thermal conductivity than the base fluids. Vajjha and Das [Citation14] experimentally found an increase in thermal conductivity of three nanofluids containing aluminium oxide, copper oxide and zinc oxide in a base fluid of (60:40) ethylene glycol and water mixture compared to the base fluid. Shin and Banerjee [Citation15] reported anomalous enhancement of specific heat (14.5% increase) of SiO2/chloride nanofluid prepared from barium chloride, sodium chloride, calcium chloride and lithium chloride along with silicon dioxide. Dudda and Shin [Citation16] studied the specific heat capacity using DSC for four different nanomaterials containing binary nitrate salt (NaNO3 and KNO3) and found that the specific heat capacity was enhanced with an increase in the nanoparticle size. The results obtained in this study are significant and have shown an increase in the specific heat capacity of the green-synthesised nanofluids containing AuNP. The surface atoms of the nanoparticles have high specific surface energy compared to the bulk material, this might be responsible for the enhancement of specific heat in the nanofluids.[Citation15] Puliti et al. [Citation2] stated that the literature containing the experimental data for specific heat of nanofluids is limited. More research has to focus on understanding the specific heat of nanofluids as knowledge about specific heat plays a fundamental role in optimising many engineering applications.
3.2. Dielectric properties of nanofluids
The dielectric properties of nanofluids containing AuNP were studied over a broad frequency range from 200 MHz to 20 GHz. This range was selected to evaluate the dielectric constant (ɛ′), dielectric loss factor (ɛ″) and dissipation factor (tan delta) for the AuNP nanofluids.
During the experimentation, it was found that introducing the nanofluids to the microwave environment led to volumetric heating of the nanofluids. This might be due to the direct coupling of the electromagnetic field with the polar and ionic components present in the nanofluids. Therefore, this study was conducted to understand the dielectric properties of AuNP in water and their interactions with the microwave energy.
From the dielectric properties data, we can calculate the complex permittivity (ϵ*) with real (ϵ′) and imaginary parts (ϵ″) which describes the interactions of the electromagnetic waves with the nanofluids.
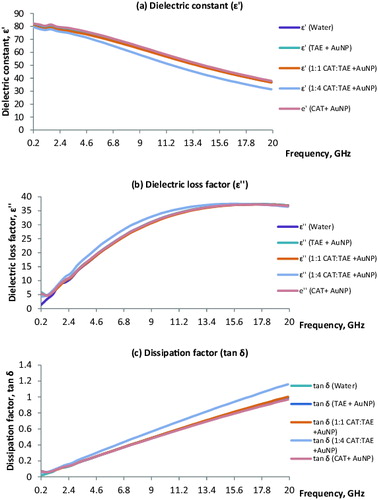
The dielectric constant (ϵ′) is the real part of the complex dielectric permittivity, and is the measure of the material's ability to store the microwave energy. The dielectric loss factor (ϵ″) is the imaginary component of the complex dielectric permittivity and represents the material's ability to dissipate the microwave energy. The loss tangent or dissipation factor (tan δ = ϵ″/ϵ′) is related to the material's ability to penetrate and dissipate the electrical energy as heat. The volumetric heating of the microwaves is influenced by the penetration depth, and the lower the frequency, the higher is the penetration depth.[Citation17–19] The dielectric properties of the AuNP nanofluids are presented in . The nanofluids TAE + AuNP, 1:1 CAT:TAE + AuNP and CAT+ AuNP followed a similar trend exhibiting analogous dielectric properties to that of water. The ɛ' for TAE + AuNP for the selected frequency of 200 MHz to 20 GHz ranged from 81.97 ± 0.32 to 37.43 ± 0.18; ɛ' for 1:1 CAT:TAE ranged from 80.30 ± 0.62 to 36.71 ± 0.22; ɛ' for CAT + AuNP ranged from 82.14 ± 0.27 to 37.93 ± 0.06 for 200 MHz to 20 GHz. The ɛ' for 1:4 CAT:TAE for the selected frequency ranged from 79.51 ± 0.31 to 31.45 ± 0.23, which is slightly lower than that of the other nanofluids. The results obtained from this study show an interesting trend for 1:4 CAT:TAE + AuNP, when compared to the other AuNP nanofluids for ɛ', ɛ" and tan δ. It is interesting to note that the tan δ for 1:4 CAT:TAE was higher than that of the other nanofluids ranging from 0.06 ± 0.01 to 1.16 ± 0.01 for 200 MHz to 20 GHz.
Figure 3. Dielectric properties of green-synthesised AuNP nanofluids. (a) Dielectric constant (ɛ'); (b) dielectric loss factor (ɛ"); (c) dissipation factor (tan δ).
3.3. Interpretation of TEM micrographs
TEM images for TAE + AuNP exhibited different shapes like spherical, rhomboidal and triangular prisms of AuNP shown in . There was no presence of an organic layer surrounding the AuNP. Nearly, spherical-shaped AuNP were synthesised by 1:1 tannic acid and CAT solution. It can be seen from that the AuNP are surrounded by an organic layer. The formed spherical AuNP were varying in size.
Figure 4. TEM micrograph of nanofluids containing gold nanoparticles. (a) TAE + AuNP; (b) 1:1 TAE:CAT + AuNP; (c) 1:4 CAT:TAE + AuNP; (d) CAT + AuNP, indicating clear encapsulation of gold nanoparticles by catechin layer (core and shell form).
From , it can be seen that a dense layer of the organic material is surrounding the gold nanoparticle synthesised using 1:4 TAE:CAT + AuNP. This is an interesting obtained structural formation that is different from other AuNP. The reason for the formation of the organic layer can be due to the interaction between CAT and tannic acid that might have led to the formation of a complex chain surrounding the nanoparticles. It should also be noted that the results obtained for 1:4 CAT:TAE + AuNP from the DSC study and the dielectric properties study showed a different trend compared to the other three nanoparticle systems. Based on the observations from the TEM images, we put forward that the interaction between AuNP and the polyphenolic chain from CAT and tannic acid complex could be a probable reason for the difference in properties. This could also be the reason for the disappearance of the secondary endothermic peak from the DSC thermogram in and the increase in the dissipation factor shown in (c).
The AuNP synthesised using CAT show a unique pattern from the TEM image (). A uniform layer of organic matter is found surrounding the AuNP. From the image, it can be seen that the AuNP, if assumed to be quasi spherical in shape, are encapsulated by a spherical organic layer. This forms a core and shell pattern, where AuNP is found in the core and the CAT layer is the shell. shows the particle size distribution of AuNP in nanofluids.
Table 3. Particle size analysis of AuNP size in nanofluids.
3.4. Spectral properties of nanofluids
The results from UV–vis spectra provide information about the surface plasmon resonance (SPR) for the AuNP in solution. The AuNP solutions were scanned over a wavelength from 400 to 800 nm on medium scan with peak table on and step size of 1.0 nm interval. The addition of HAuCl4 to the reaction medium was taken as the initial start of the reaction and the solutions were monitored over a period of 6 hours. shows the SPR for the tannic acid-synthesised AuNP. The λmax was found to be at 550 nm with rapid synthesis of AuNP. shows the SPR for 1:1 CAT:TAE-synthesised AuNP. The λmax was found to be at 552 nm with rapid synthesis of AuNP. It can be seen that within 2 minutes after the onset of the reaction, the SPR peak was found around 540 nm with absorbance around 2.122 and by 4 minutes there was an increase in absorbance. The similar trend was obtained over the time period of observation with the SPR peak ranging from 546 to 552 nm.
Figure 5. UV–vis spectra for gold nanofluids with SPR peak, (a) TAE + AuNP; (b) 1:1 CAT:TAE + AuNP; (c) 1:4 CAT:TAE + AuNP; (d) CAT + AuNP.
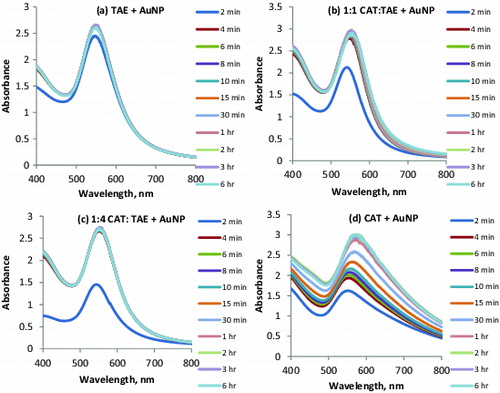
The SPR peak over the wavelengths from 400 to 800 nm for 1:4 CAT:TAE-synthesised AuNP is provided in (c). It can be seen that within 2 minutes after the onset of the reaction, the SPR peak was found around 538 nm with absorbance around 1.438. The absorbance signals obtained for 1:4 CAT:TAE-synthesised AuNP were lower than those obtained for 1:1 CAT:TAE-synthesised AuNP. Within 4 minutes, there was an increase in absorbance with complete overlapping of the curves obtained from 4 minutes to 6 hours of observation. The λmax for 1:4 CAT:TAE-synthesised AuNP was found to be at 550 nm.
shows the SPR peak absorbance for the CAT-synthesised AuNP over the wavelength of 400 to 800 nm. The figure shows a progressive increase of absorbance over the time period. Initially, the first SPR peak appeared at 547 nm with absorbance of 1.620 by 2 minutes, followed by the increase in absorbance from 1.620 to 1.930 at 547 nm for 4 min. There was a gradual increase in the absorbance along with an increase in the SPR peaks from 6 to 30 min. The increase in time, SPR wavelength and absorbance for CAT + AuNP are 6 min, 550 nm, 2.005; 8 min, 552 nm, 2.074; 10 min, 554 nm, 2.163; 15 min, 560 nm, 2.334; 30 min, 560 min, 2.561. The λmax for the CAT-synthesised AuNP was found to be at 560 nm.
3.5. Studies on nucleation of AuNP
From the results obtained from the TEM images, it can be clearly seen that the CAT-synthesised AuNP had uniform layer of CAT encapsulating the AuNP when compared to the other AuNP-synthesised methods. The TEM image of the CAT-synthesised AuNP shown in clearly indicates an even encapsulation of AuNP by the CAT molecules. This is an interesting and intriguing result; hence, CAT was used as a reference compound for AuNP synthesis for further studies.
Correspondingly, a simple experiment was conducted to understand the mechanism of nucleation and growth of AuNP. Catechin solution (1 mM) and HAuCl4 solution (1mM) at room temperature (25 °C) were used in the nucleation and growth study. The reaction between CAT and HAuCl4 solutions took place in a glass vial to form AuNP.
3.5.1. CAT on grid
5 μl of CAT solution was smeared on the carbon-coated TEM grids and was allowed to stand for 1 min. Excess solution was carefully removed using the filter paper. The CAT solution was air dried to form a thin film. 5 μl of HAuCl4 solution was added to the TEM grid coated with dried CAT solution, and the reaction was allowed to occur for 1 min. After 1 min, the excess HAuCl4 solution was removed from the TEM grid by blotting with the filter paper and the sample was analysed by the FEI Tecnai 12 TEM given in (a). From the TEM image, it can be seen that AuNP have started to nucleate within 1 minute of the start of the reaction. The nucleation of AuNP has occurred instantaneously and the visibility of AuNP can be seen in areas having more CAT. The region containing CAT aiding the growth of AuNP is highlighted in (a).
Figure 6. TEM image of CAT + AuNP nanofluid for nucleation study. (a) Catechin on grid and (b) reaction on grid.
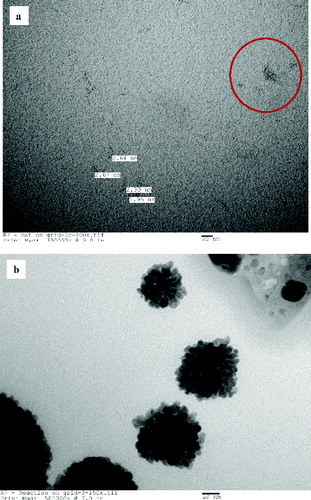
3.5.2. Reaction on grid
5 μl of CAT solution and 5 μl of HAuCl4 solution were added directly on the TEM grid, and allowed to stand for 1 min. The excess solution was removed with the filter paper and air dried to form a thin film which was analysed with FEI Tecnai 12 TEM. shows that the AuNP synthesised using the reaction on grid method. It can be seen that the reaction was instantaneous, the presence of water plays an interesting role in assisting the instant nucleation and formation of AuNP. This is an exciting result signifying that the formation of AuNP could be rapid in an aqueous medium as the image obtained reveals the formation of AuNP within 1 min of reaction time.
Both CAT on grid and reaction on grid techniques provide an insight into the formation of AuNP. These two methods show an interesting phenomenon of the formation of AuNP, further research is required to understand the factors aiding the formation of AuNP which would facilitate further manipulation, control and optimisation of the size of AuNP for suitable and targeted end applications.
4. Conclusions
Nanofluids were prepared by varying their concentrations between CAT and tannic acid to form AuNP using water as the base fluid. Interesting thermal, dielectric and spectral properties were obtained for the green-synthesised gold nanofluids. The TEM images of CAT-synthesised AuNP show nearly perfect encapsulation as core and shell. This is an exciting result as this system can be used as a carrier for drug delivery and also as a contrast agent providing signals in detection applications. The results obtained from this study point out the potential of manufacturing green-synthesised AuNP nanofluids which can have a wide scope of application as functional materials. The nanofluids market in heat transfer applications alone is estimated to be over 2 billion dollars/year.[Citation2] Nanofluids containing nanoparticles can be used for the design of new biosensors to assess the quality and safety of food materials.[Citation20] Investigations on nanofluids for engineering applications are still at experimental stage and only a few reports have been currently reported.[Citation7] Thus, further advances in nanofluids will create new opportunities to enhance the properties of conventional materials and will add new dimensions and potential for innovation to future applications.
Acknowledgements
We would like to thank Dr G.S. Vijaya Raghavan, Professor, Bioresource Engineering, McGill University; Dr Hojatollah Vali, Facility for Electron Microscopy Research, McGill University and Mr Yvan Gariépy, Technical Engineer, Bioresource Engineering, McGill University for their kind support.
Disclosure statement
No potential conflict of interest was reported by the authors.
Additional information
Funding
References
- Choi SU. Nanofluids: from vision to reality through research. J Heat Transfer. 2009;131:033106.
- Puliti G, Paolucci S, Sen M. Nanofluids and their properties. Appl Mech Rev. 2011;64:030803.
- Das SK, Choi SUS, Yu W, Pradeep T. Nanofluids science and technology. Hoboken (NJ): John Wiley & Sons, Inc.; 2008.
- Eijkel JC, Van Den Berg A. Nanofluidics: what is it and what can we expect from it? Microfluidics Nanofluidics. 2005;1:249–267.
- Yu W, Xie H. A review on nanofluids: preparation, stability mechanisms, and applications. J Nanomaterials. 2012;2012:1–17.
- Zhu J, Liu S, Palchik O, Koltypin Y, Gedanken A. Shape-controlled synthesis of silver nanoparticles by pulse sonoelectrochemical methods. Langmuir. 2000;16(16):6396–6399.
- Li Y, Zhou Je, Tung S, Schneider E, Xi S. A review on development of nanofluid preparation and characterization. Powder Technol. 2009;196:89–101.
- Guo L, Huang Q, Li X-y, Yang S. Iron nanoparticles: synthesis and applications in surface enhanced Raman scattering and electrocatalysis. Phys Chem Chem Phys. 2001;3:1661–1665.
- Hyeon T, Lee SS, Park J, Chung Y, Na HB. Synthesis of highly crystalline and monodisperse maghemite nanocrystallites without a size-selection process. J Am Chem Soc. 2001;123:12798–12801.
- Taleb A, Petit C, Pileni MP. Synthesis of highly monodisperse silver nanoparticles from AOT reverse micelles: a way to 2D and 3D self-organization. Chem Mater. 1997;9:950–959.
- Jana NR, Gearheart L, Murphy CJ. Wet chemical synthesis of silver nanorods and nanowires of controllable aspect ratio. Chem Commun. 2001;2001(7):617–618.
- Brust M, Walker M, Bethell D, Schiffrin DJ, Whyman R. Synthesis of thiol-derivatised gold nanoparticles in a two-phase liquid–liquid system. J Chem Soc, Chem Commun. 1994;1994(7):801–802.
- Liao X, Raghavan G, Yaylayan V. Dielectric properties of alcohols (C1-C5) at 2450 MHz and 915 MHz. J Mol Liquids. 2001;94:51–60.
- Vajjha RS, Das DK. Experimental determination of thermal conductivity of three nanofluids and development of new correlations. Int J Heat Mass Transfer. 2009;52:4675–4682.
- Shin D, Banerjee D. Enhancement of specific heat capacity of high-temperature silica-nanofluids synthesized in alkali chloride salt eutectics for solar thermal-energy storage applications. Int J Heat Mass Transfer. 2011;54:1064–1070.
- Dudda B, Shin D. Effect of nanoparticle dispersion on specific heat capacity of a binary nitrate salt eutectic for concentrated solar power applications. Int J Thermal Sci. 2013;69:37–42.
- Venkatesh M, Raghavan G. An overview of microwave processing and dielectric properties of agri-food materials. Biosystems Eng. 2004;88:1–18.
- Meda V, Orsat V, Raghavan V. 4 - Microwave heating and the dielectric properties of foods. In: Schubert H, Regier M, editors. The microwave processing of foods. Cambridge: Woodhead Publishing; 2005. p. 61–75.
- Routray W, Orsat V. Dielectric properties of concentration-dependent ethanol + acids solutions at different temperatures. J Chem Eng Data. 2013;58(6):1650–1661.
- Warriner K, Reddy SM, Namvar A, Neethirajan S. Developments in nanoparticles for use in biosensors to assess food safety and quality. Trends Food Sci Technol. 2014;40:183–199.