
ABSTRACT
Co(2,2'-bipyridine)2(dicyanamide)2, Co(bpy)2(N(CN)2)2, was synthesised by solution crystallisation method. The ‘external’ lattice modes of Co(bpy)2(N(CN)2)2 crystal have been determined by use of the method of nuclear site group analysis. Based on the surface enhanced Raman scattering (SERS) activity of silver nanoparticles (Ag-NPs), a SiO2/Ag-NPs/Co(bpy)2(N(CN)2)2 aggregate was prepared in order to better analyse the adsorption orientation of the cobalt complex on the surface of Ag-NPs. The result of the SERS measurement indicates that the molecular plane presents a tilted orientation with respect to the Ag-NPs surface. The system described here could serve as the basis for a study of accurate and available SERS sensor. The pyrolysis products at 553 and 593 K, respectively, in air have been investigated. The results showed that nitrogen-doped carbon dots were obtained from the pyrolysis products of Co(bpy)2(N(CN)2)2 calcined at 553 K. This process can be exploited as a simple and effective path for the synthesis of nitrogen-doped carbon dots by using nitrogen-containing metal organic complex as precursors.
1. Introduction
In recent years, metal coordination polymers have received growing interest in the areas of magnetic, optical and electronic properties because of their intriguing structural topologies and applications.[Citation1–6] Rational design and construction of cobalt(II) complexes have been greatly developed, not only because of their structural diversities, but also their potential applications in gas storage, catalysis, fluorescence, magnetism materials.[Citation7–10] The dicyanamide ligand (dca), [N(CN)2]−, is a remarkably versatile building block for the construction of coordination polymers, since it can act in a mono-, bi-or tridentate coordination manner. The introduction of N-based bridging and terminal co-ligands into the metal dca system has led to many fascinating structures and magnetic properties.[Citation11–21] Another ligand covered in this work, 2,2'-bipyridine, has a planar bidentate ligand with powerful binding abilities towards metal ion.
Carbon dots (CDs) have been applied in various fields such as biomedical imaging, sensing, photocatalysis and fluorescent detection of metal ions due to their easy and inexpensive preparation, low cytoxicity and good biocompatibility.[Citation22–27] Many studies have been devoted to improving the fluorescent performance of CDs by developing new process technology. To date, several methods to produce CDs have been developed, such as laser ablation or electrochemical oxidation of graphite,[Citation28,Citation29] oxidising arc-discharge soot with nitric acid,[Citation30] electrochemical soaking of carbon nanotubes,[Citation31] etc. However, these methods usually involve complex processes and rigorous conditions.
In this paper, the SERS performance and characteristics of SiO2/Ag-NPs/Co(bpy)2(N(CN)2)2 aggregate and the pyrolysis products of Co(bpy)2(N(CN)2)2 calcined at 553K were investigated. In terms of SERS selection rule, we infer that Co(bpy)2(N(CN)2)2 molecules are adsorbed in a tilted orientation on the Ag-NPs surface. SiO2/Ag-NPs with high SERS activity may be a promising material for low cost and available SERS sensor, and may establish the relationship between photonic crystal and SERS in consideration of the fact that submicron SiO2 is a typical material of the construction of photonic crystal. From the pyrolysis products of Co(bpy)2(N(CN)2)2 calcined at 553 K, nitrogen-doped CDs were obtained. This research may provide an alternative to the preparation of nitrogen-doped CDs by using nitrogen-containing metal organic complex as precursors.
2. Experimental
2.1. Preparation of SiO2/Ag-NPs
A solid sample of SiO2 (400 mg) was added to 40 mL of distilled water in a beaker. The resulting mixture was dispersed under sonication for 15 min to finely disperse the SiO2 powder. AgNO3 (100 mg, m(SiO2) : m(AgNO3) = 4 : 1) was dissolved in 30 mL of distilled water and added slowly to the suspension with stirring. Stirring was continued at room temperature for another 6 hours. Then, a solution of 0.12 mL of N2H4·H2O (wt 50%) diluted in 20 mL of distilled water was added to the suspension with vigorous stirring. The mixture was centrifuged and the solid washed with three 20-mL portions of water.
2.2. Growth of single crystal Co(bpy)2(N(CN)2)2
Three solutions were prepared: (a) 312 mg of CoCl2·6H2O was dissolved in 10 mL of deionised water (b) 238 mg of 2,2'-bipyridine was dissolved in 10 mL of ethanol absolute and (c) 89 mg of NaN(CN)2 was dissolved in 5 mL of deionised water. Solution (b) was added to solution (a) drop by drop with constant stirring. After all of solution (b) had been added, solution (c) was then added to the mixture drop by drop with constant stirring. The reaction mixture was stirred for 3 hours. An orange single crystal was filtered, washed rapidly with 20 mL of cold water and dried in air.
2.3. Preparation of SiO2/Ag-NPs/Co(bpy)2(N(CN)2)2
A solid sample of SiO2/Ag-NPs (50 mg) was added to 2 mL of distilled water in a beaker. The resulting mixture was dispersed under sonication for 15 min to finely disperse the SiO2/Ag-NPs powder. Co(bpy)2(N(CN)2)2 (10 ml,5 mM) solution was then added to this suspension, and stirred for 2 hours. SiO2/Ag-NPs/Co(bpy)2(N(CN)2)2 aggregation could be obtained by centrifuging and drying.
2.4. Characterisation techniques
Morphological and structural studies of SiO2/Ag-NPs and SiO2/Ag-NPs/Co(bpy)2(N(CN)2)2 were carried out using scanning electron microscope (SEM, JSM-6700F) and X-ray diffraction (XRD, D/MAX-PC) analyses employing Cu Kα radiation (λ = 1.5418 Å) in the scanning range of 2θ between 10° and 90° with the step size of 0.2° and the counting time of 8°/min. Raman spectroscopy (excitation wavelength of 632.8 nm, LabRam-1B, Jobin Yvon) study was performed at room temperature. Single crystal data for the complex were collected on a Bruker APEX II diffractometer equipped with a graphite monochromator and Mo Kα (λ = 0.71073 Å, 296 K) radiation. The structure was solved by direct methods using SHELXS-97.
For the pyrolysis product of Co(bpy)2(N(CN)2)2, X-ray powder diffraction was collected at 2θ scanning rate of 8°/min on D/MAX-PC. Morphological characterisations were performed by transmission electron microscopy (TEM, JEM-2010) operated at 200 kV. Fourier transform infrared spectroscopy (FTIR) was performed on an Avatar 370 spectrometer (Nicolet Instrument Corporation) working in the mid-infrared range from 400 to 4000 cm−1. Steady-state fluorescence emission spectra of the supernatant were performed with a RF-5301PC fluorescence spectrometer and Leica DMIRB analysis was conducted on U-LH100HG. Chemical composition of CDs was conducted by X-ray photoelectron spectroscopy (XPS, ESCALAB 250Xi) with Al Kα radiation (hν = 1486.6 eV) and analysed using XPSPeak 4.1. Before analysis, the XPS data were normalised using the binding energy value of adventitious carbon at 284.8 eV as reference.
3. Results and discussion
3.1. Crystal structure of Co(bpy)2(N(CN)2)2
Crystallographic data and structural refinements for Co(bpy)2(N(CN)2)2 are summarised in . Selected bond lengths as well as the angles for the complex are shown in .
Table 1. Selected crystal data of Co(bpy)2(N(CN)2)2.
Table 2. Selected bond lengths (Å) and angles (deg) of Co(bpy)2(N(CN)2)2.
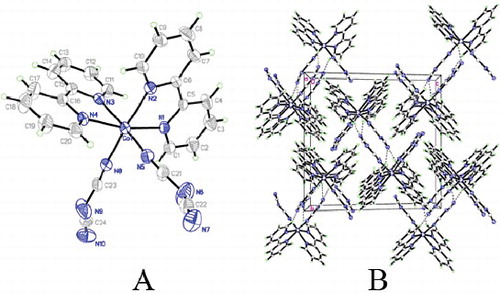
The molecular structure of Co(bpy)2(N(CN)2)2 is shown in (A), together with the atom numbering scheme. Cobalt ion is coordinated by six nitrogen atoms from two bpy (N1, N2, N3 and N4) and two different dicyanamide anion ligands (N5 and N8) to form a distorted octahedral environment. Hydrogen bonds C–H…N organise the discrete structural moieties of Co(bpy)2(N(CN)2)2 into a three-dimensional (3D) supra-molecular framework, as displayed in (B).
Figure 1. Molecular structure (A) and 3D supra-molecular network (B) of Co(bpy)2(N(CN)2)2.
3.2. Nuclear site group analysis
Co(bpy)2(N(CN)2)2 crystallises in the P21/c space group with four molecules per unit cell. The lattice parameters for the grown crystal are a = 9.0966 Å, b = 16.014 Å, c = 16.591 Å, α = 90°, β = 104.372°, γ = 90°, and the cell volume V = 2341.2 Å3. The ‘external’ lattice modes of this crystal may be determined by using nuclear site group analysis. Since there are four molecules per unit cell, by consulting Table 3(A) in [Citation32] we find that each molecule must occupy a C1 site. Therefore, we may read off the translational degrees-of-freedom from Table 5(B) in [Citation32] (3Ag+ 3Au + 3Bg + 3Bu) are the librational modes from 5C (3Ag+ 3Au + 3Bg + 3Bu). The acoustic modes are Au + 2Bu. Thus, the external lattice modes are 6Ag (R) + 5Au (IR) + 6Bg (R) + 4Bu(IR) of which the Ag and Bg are Raman active and the Au and Bu are IR active.
Table 3. Assignment of vibrational modes of Co(bpy)2(N(CN)2)2 and SiO2/Ag-NPs/Co(bpy)2(N(CN)2)2.
3.3. XRD and SEM of SiO2/Ag-NPs/Co(bpy)2(N(CN)2)2
depicts the XRD pattern of SiO2/Ag-NPs/Co(bpy)2(N(CN)2)2. When 2θ = 38o, 44o, 64o, 77o and 81o, the diffraction peaks correspond to the (111), (200), (220), (311) and (222) of cubic structure of silver. Five sharp diffraction peaks without impure peaks illustrate that SiO2 may exist in the amorphous form.
Figure 2. XRD pattern of SiO2/Ag-NPs/Co(bpy)2(N(CN)2)2.
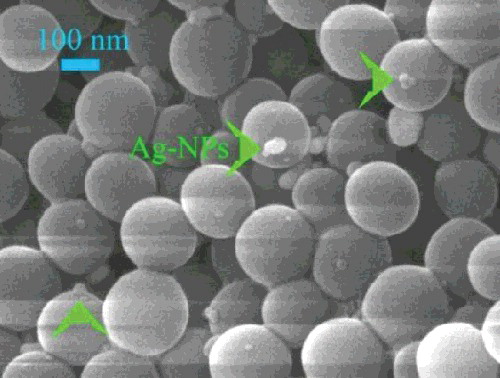
shows a typical SEM image of the SiO2/Ag-NPs aggregate. Ag-NPs adhere randomly on the surface of SiO2. Several nanocrystallites ranging from 10 to 50 nm were observed. Some chemical functional groups, especially hydroxyl groups, exist on the surface of SiO2. When AgNO3 was added to the SiO2 system, Ag+ was attracted to the surface of SiO2 due to the high electronegativity between Ag+ and hydroxyl groups. Herein, after adding reducing agent Ag+ was prior to nucleate on the surface of SiO2 and formed into Ag-NPs.
Figure 3. SEM image of SiO2/Ag-NPs.
3.4. UV–vis absorption and fluorescence of Co(bpy)2(N(CN)2)2
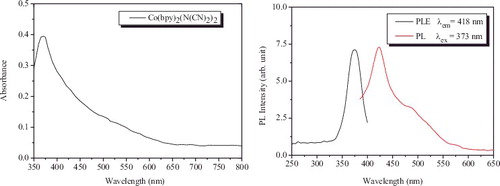
The absorption and room temperature photoluminescent (PL) spectra of Co(bpy)2(N(CN)2)2 solution are shown in . The concentration of the complex was 0.1 mM. The aqueous solution exhibits an obvious absorption band at about 370 nm, which is considered as the π → π∗ transition of 2,2'-bipyridine. The photoluminescent excitation (PLE) spectrum recorded with the optimal excitation wavelength 418 nm shows a sharp peak at 373 nm. On excitation at 373 nm, a feature is that an emission peak corresponding to violet and a relatively low emission band corresponding to cyan were shown at 418 and 480 nm, respectively. The violet emission peak is attributed to the π∗ → π transition of 2,2'-bipyridine. The cyan emission band can be ascribed to the fact that there exists intermediate level or flaws in the forbidden band of Co(bpy)2(N(CN)2)2.
Figure 4. UV–vis spectrum and fluorescence spectrum of Co(bpy)2(N(CN)2)2.
3.5. Raman and SERS spectra
displays the Raman spectra of Co(bpy)2(N(CN)2)2 and SiO2/Ag-NPs/Co(bpy)2(N(CN)2)2, respectively. The major peak assignments are given in . These were adapted from the literature.[Citation33–38] It is found from Table 3 that for most bands there is a close correlation, in terms of the peak positions, between the crystal and surface spectra instead of δ ring (631 cm−1) and δ N–C≡N (650 cm−1) where there appears a Raman shift to 652 and 671 cm−1. The shifts indicate the strengthening of the ring and N–C≡N bonds. Characteristic vibration peaks of [N(CN)2]2− and 2,2'-bipyridine ligands are presented in two lines. Raman spectra show that the modes at 1597, 1566, 1489 and 1315 cm−1, respectively, are enhanced obviously, as shown in . These modes are assigned to the in-plane C–C and C–N stretchings of pyridine ring. Meanwhile, it is noted that the peak at 1361 cm−1 attributed to the stretching mode of C–N of [N(CN)2]2− ligand is enhanced distinctly while other vibration modes of [N(CN)2]2− ligand are also selectively enhanced. In contrast, in-plane C–H vibration in 2,2'-bipyridine ligand (1167 cm−1), breathing vibration of pyridine ring (1022 cm−1), out-of-plane C–H vibration (767 cm−1), out-of-plane vibration of ring (736 cm−1), in-plane stretching of ring (651 cm−1) and in plane bending of SiO4 (430 cm−1) are not entirely enhanced at the same degree.
Figure 5. Raman spectra of Co(bpy)2(N(CN)2)2 and SiO2/Ag-NPs/Co(bpy)2(N(CN)2)2.
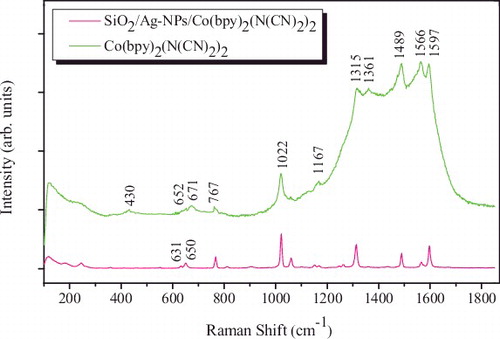
Figure 6. Geometry of Co(bpy)2(N(CN)2)2 molecule absorbed on Ag-NPs surface with sloping adsorption configuration.
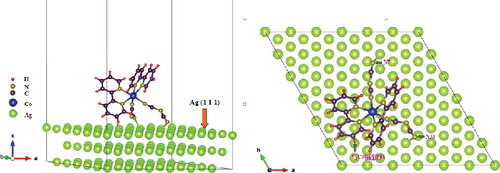
Through the analysis of and , in-plane stretching of C–N (1361 cm−1) [Citation35,Citation36] in [N(CN)2]− ligand is enhanced. The vibrational change occurring in the SERS spectrum is evidence for an interaction at the [N(CN)2]− ligand. Additionally, in-plane and out-of-plane vibrations of pyridyl ring and C–H in 2,2'-bipyridine ligand are all enhanced obviously, which presents that H atoms are close to the substrate. In terms of SERS selection rule, we can infer that C–N is vertical or tiltable to the surface of Ag-NPs. Hence, a conclusion may be drawn that N atoms tend to be chemisorbed onto the surface of Ag-NPs substrate based on the strong chemical affinity of Ag and N.[Citation39] Moreover, the vibration modes of 2,2'-bipyridine ring are almost always enhanced.[Citation40] In light of this, we draw a conclusion that H atoms lie on the surface and this point makes sure that the model is stable and unique (radius ratio r(Ag-NPs) : r(H) ≈ 1000 : 1). The N atoms based deformation and vibrations can be strengthened by SERS effect, therefore a more clearly distinguish on the conformational transition was observed, as shown in . Besides the obvious blue-shift due to the interaction of N atoms with sliver surface, sharp differences on the spectral features, peak shape, half-width and relative-intensity of correlative modes are observed.[Citation41]
So far, there has been the consensus that SERS mainly occurs as a combination of the two effects: (1) The strong electromagnetic (EM) fields enhancement of the metal NPs aggregation associated with large local fields caused by plasmon resonance.[Citation42] The localised plasmon resonance of metal NPs seems to supply most of the Raman enhancement, maximised when the localised surface plasmon resonance frequency overlaps that of the excitation laser.[Citation43] (2) The chemical enhancement that attributed to the photo-driven dynamic charge transfer (CT) between the energy levels of the molecule and Fermi levels of metals.[Citation44] For SiO2/Ag-NPs aggregate, the surface plasmon resonances generate due to the existence of Ag-NPs. ‘Hot-spot’ leads to the violent local field and the signal of Raman scattering increases dramatically.[Citation45,Citation46] With regard to CT, Co(bpy)2(N(CN)2)2 was absorbed onto the surface of Ag-NPs and the change in effective polarisability results in the enhancement of Raman scattering.
3.6. Pyrolysis products
The Co(bpy)2(N(CN)2)2 crystal was calcined in air at 553 and 593 K for 2 hours, respectively. XRD was used to analyse the chemical components of the pyrolysis products. The XRD pattern showed that Co3O4 was present after the calcinations at 593 K (JCPDS No. 76-1802), and see . No peaks of any other phases or components were detected. However, the XRD pattern of the sample calcined at 553 K clearly showed a broad diffuse reflection centred at 22° in 2θ, which is smaller than the (002) diffraction peak of carbon quantum dots (CDs).[Citation47] No peaks of cobalt oxide are observed. It follows that CDs can be obtained from the pyrolysis product of the cobalt(II) complex at 553 K.
Figure 7. XRD patterns of pyrolysis products at different pyrolysis temperature.
The typical TEM image shown in reveals the as-prepared CDs with particle sizes range of 2–4 nm. Several sets of the {002} planes with interplanar spacing of 0.42 nm are visible. The FTIR spectrum of the CDs in the 4000–400 cm−1 range is given in . The 3442 and 3199 cm−1 bands are assigned to –OH and –NH group.[Citation48] The strong peaks at 2924 and 2852 cm−1, respectively, are due to the stretching vibrations of –CH2 groups.[Citation49] The peak at 1653 cm−1 can be associated with the amide–carbonyl (–NH–CO–) stretching vibration.[Citation50] The observed vibration mode of amide–carbonyl group suggests that we have obtained the nitrogen-doped CDs. The other absorption bands are assigned as follows: 1464 cm−1 for CC/CN stretching vibration,[Citation51] 1417 cm−1 for O–H in-plane deformation vibration or CHx (x = 2, 3) bending vibration,[Citation52] 1381 cm−1 for O–H deformation peak, 1243 cm−1 for C–OH stretching vibration, 1132 cm−1 for double C–O strength stretching,[Citation53] and 806, 768, 701, 633 and 471 cm−1 for C–H vibration,[Citation54] respectively.
Figure 8. Representative TEM image of carbon dots from light brown supernatant.
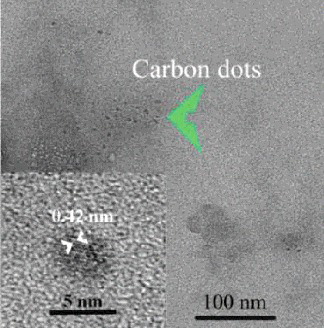
Figure 9. FTIR spectrum of CDs.
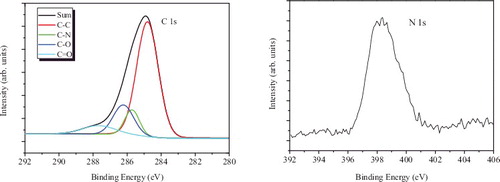
In order to further demonstrate the chemical composition of as-prepared CDs, XPS analysis was performed and the results are presented in . It is demonstrated that C–C (284.8 eV) [Citation55] bond is the main existence form, the FWHM of which is 1.5. In addition, C1s is fitted by four peaks which are assigned to C–N (285.7 eV),[Citation56] C–O (286.2 eV) [Citation55] and C = O (287.6 eV) [Citation55] but the contents are not equal, about 0.125, 0.25, 0.10 of the content of C–C, respectively, based on the peak area ratio of the fitted C1s peak. The main peak and satellite peaks of the C1s region are in good agreement with the reported XPS peak positions [Citation55,Citation56] and with the FTIR result which clearly indicates that N is present. The C–N existence indicates that the statement of nitrogen-doped carbon dots is persuasive and reasonable.
Figure 10. XPS spectra of nitrogen-doped CDs for C1s and N1s states.
The room-temperature PLE spectrum recorded with the optimal excitation wavelength 420 nm shows a sharp peak at 240 nm and a shoulder band centred at ∼ 330 nm, as shown in . On excitation at 330 nm, the photoluminescent (PL) spectrum displays an emission peak at 430 nm with a Stokes shift of 100 nm, indicating that the CDs exhibit violet photoluminescence. Correspondingly, the 240 nm excitation also induces the PL at 420 nm.
Figure 11. PLE and PL spectra of CDs from light brown liquid.
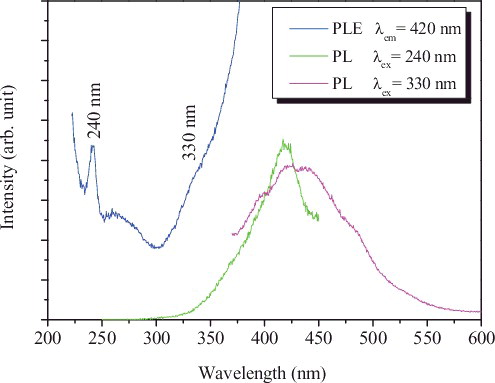
The PL and PLE spectra of the CDs are similar to triplet carbene in diarylmethylmethylenes and GQDs.[Citation57,Citation58] The two electronic transitions of 330 nm (3.76 eV) and 240 nm (5.17 eV) observed in the PLE spectra can be regarded as transitions from the σ and π orbitals (highest occupied molecular orbitals, HOMOs) to the lowest unoccupied molecular orbital (LUMO). The δE is thus determined to be 1.41 eV, within the required value (<1.5 eV) for triple carbenes,[Citation40] which suggests that the assignment of the two transitions is reasonable.
4. Conclusion
A solution crystallisation method was used to synthesise Co(bpy)2(N(CN)2)2 crystal. According to the results of the SERS analysis, we can infer that the adsorption orientation of Co(bpy)2(N(CN)2)2 molecule plane exhibits an inclined orientation with respect to the surface of Ag nanoparticles. SiO2/Ag-NPs aggregate could be suitable for an available SERS sensor to metal complex.
The primary pyrolysis product of the single crystal Co(bpy)2(N(CN)2)2 at 553K in air is carbon dots rich of nitrogen-containing functional groups. But at 593 K, the final pyrolysis product is cobalt oxide. The discovery of the new route for synthesis of CDs may expand the application of CDs to other fields such as optoelectronics and biological labelling.
Disclosure statement
No potential conflict of interest was reported by the authors.
References
- Batten SR, Robson R. Interpenetrating nets: ordered, periodic entanglement. Angew Chem Int Ed. 1998;37:1460–1494.
- Yaghi OM, Li H, Davis C, et al. Synthetic strategies, structure patterns, and emerging properties in the chemistry of modular porous solids. Acc Chem Res. 1998;31:474–484.
- Su CY, Cai YP, Chen CL, et al. Self-assembly of trigonal-prismatic metallocages encapsulating BF4− or CuI32− as anionic guests: structures and mechanism of formation. Angew Chem Int Ed. 2002;41:3371–3375.
- Li BL, Peng YF, Li BZ, et al. Supramolecular isomers in the same crystal: a new type of entanglement involving ribbons of rings and 2D (4,4) networks polycatenated in a 3D architecture. Chem Commun (Camb). 2005;18:2333–2335.
- Yin P, Gao S, Zheng LM, et al. A two-step field-induced magnetic transition in a novel layered cobalt diphosphonate. Chem Commun (Camb). 2003;8:1076–1077.
- Kitagawa S, Kitaura R, Noro S. Functional porous coordination polymers. Angew Chem Int Ed. 2004;43:2334–2375.
- Yuan SW, White D, Mason A, et al. Improving hydrogen adsorption enthalpy through coordinatively unsaturated cobalt in porous polymers. Macromol Rapid Comm. 2012;33:407–413.
- Cheng Z, Yang BQ, Yang MP, et al. Benzimidazolylacetate metal complexes as catalysts for carbonylation reactions. Reac Kinet Mech Cat. 2013;110:331–342.
- Qin L, Li YH, Ma PJ, et al. Exploring the effect of chain length of bridging ligands in cobalt(II) coordination polymers based on flexible bis(5,6-dimethylbenzimidazole) ligands: synthesis, crystal structures, fluorescence and catalytic properties. J Mol Struct. 2013;1051:215–220.
- Coronado E, Galán-Mascarós JR, Gómez-García CJ, et al. Molecule-based magnets formed by bimetallic three-dimensional oxalate networks and chiral tris(bipyridyl) complex cations. The Series [ZII(bpy)3][ClO4][MIICrIII(ox)3] (ZII = Ru, Fe, Co, and Ni; MII = Mn, Fe, Co, Ni, Cu, and Zn; ox = oxalate dianion). Inorg Chem. 2001;40:113–120.
- Miller JS, Manson JL. Designer magnets containing cyanides and nitriles. Acc Chem Res. 2001;34:563–570.
- Batten SR, Jensen P, Moubaraki B, et al. Structure and molecular magnetism of the rutile-related compounds M(dca)2, M = CoII, NiII, CuII, dca = dicyanamide, N(CN)2-. Chem Commun (Camb). 1998;3:439–440.
- Li BL, Ding JG, Lang JP, et al. Synthesis and crystal structure of a new one-dimensional system with end-to-end single dicyanamide bridges between nickel(II) centres. J Mol Struct. 2002;616:175–179.
- Riggio I, Van Albada GA, Ellis DD, et al. Synthesis, X-ray structure, spectroscopy and magnetism of polymeric bis(mu-dicyanamido)(mu-pyrimidine)copper(II) monoacetonitrile; a 3D compound with bridging dicyanamide anions in two dimensions. Inorg Chim Acta. 2001;31:120–124.
- Mohamadou A, van Albada GA, Kooijman H, et al. The binding mode of the ambidentate ligand dicyanamide to transition metal ions can be tuned by bisimidazoline ligands with H-bonding donor property at the rear side of the ligand. New J Chem. 2003;27:983–988.
- Dong W, Liang M, Sun YQ, et al. Syntheses and structures of two 1-D complexes, [Co(dmf)2(NCNCN)2] and [Cu(bipy)(NCNCN)]ClO4 with bridging dicyanamide ligands. Z Anorg Allg Chem. 2003;629:2443–2445.
- Shen WZ, Chen XY, Cheng P, et al. Cobalt(II) complexes with dicyanamide - from binuclear entities to chains. Z Anorg Allg Chem. 2003;629:2591–2595.
- Jensen P, Batten SR, Moubaraki B, et al. Infinite molecular tubes: structure and magnetism of M(dca)2(apym) [M = Co, Ni, apym = 2-aminopyrimidine, dca = dicyanamide, N(CN)2−]. Chem Commun (Camb). 2000;9:793–794.
- Sun HL, Gao S, Ma BQ, et al. Long-range ferromagnetic ordering in two-dimensional coordination polymers Co[N(CN)2]2(L) [L = pyrazine dioxide (pzdo) and 2-methyl pyrazine dioxide (mpdo)] with dualμ- and μ3-[N(CN)2] bridges. Inorg Chem. 2003;42:5399–5404.
- Chen XY, Cheng P, Yan SP, et al. Grid-like cobalt(II) layered complex with an unprecedented double 1,2-Bis(1,2,4-triazole-1-yl)methane bridges. Z Anorg Allg Chem. 2005;631:3104–3107.
- Sun HL, Wang ZM, Gao S. Synthesis, crystal structures, and magnetism of cobalt coordination polymers based on dicyanamide and pyrazine-dioxide derivatives. Inorg Chem. 2005;44:2169–2176.
- Yang XM, Zhuo Y, Zhu SS, et al. Novel and green synthesis of high-fluorescent carbon dots originated from honey for sensing and imaging. Biosens Bioelectron. 2014;60:292–298.
- Wang J, Gao MM, Ho GW. Bidentate-complex-derived TiO2/carbon dot photocatalysts: in situ synthesis, versatile heterostructures, and enhanced H-2 evolution. J Mater Chem A. 2014;2:5703–5709.
- Guo YM, Zhang LF, Zhang SS, et al. Fluorescent carbon nanoparticles for the fluorescent detection of metal ions. Biosens Bioelectron. 2015;63:61–71.
- Zhao YX, Song ZM. Phase transfer-based synthesis of highly stable, biocompatible and the second near-infrared-emitting silver sulfide quantum dots. Mater Lett. 2014;126:78–80.
- Chin SF, Yazid SNAM, Pang SC, et al. Facile synthesis of fluorescent carbon nanodots from starch nanoparticles. Mater Lett. 2012;85:50–52.
- Baker SN, Baker GA. Luminescent carbon nanodots: emergent nanolights. Angew Chem Int Ed. 2010;49:6726–6744.
- Zheng L, Chi Y, Dong Y, et al. Electrochemiluminescence of water-soluble carbon nanocrystals released electrochemically from graphite. J Am Chem Soc. 2009;131:4564–4565.
- Li H, He X, Kang Z, et al. Water-soluble fluorescent carbon quantum dots and photocatalyst design. Angew Chem Int Ed. 2010;49:4430–4434.
- Xu X, Ray R, Gu Y, et al. Electrophoretic analysis and purification of fluorescent single-walled carbon nanotube fragments. J Am Chem Soc. 2004;126:12736–12737.
- Lu J, Yang J, Wang J, et al. One-pot synthesis of fluorescent carbon nanoribbons, nanoparticles, and graphene by the exfoliation of graphite in ionic liquids. ACS Nano. 2009;3:2367–2375.
- Rousseau DL, Bauman RP. Normal mode determination in crystals. J Raman Spectrosc. 1981;10:253–290.
- Lopes LB, Corrêa CC, Guedes GP, et al. Two new coordination polymers involving Mn(II), Co(II), dicyanamide anion and the nitrogen ligand 5,5′-dimethyl-2,2′-dipyridine: crystal structures and magnetic properties. Polyhedron. 2013;50:16–21.
- Jürgens B, Höppe HA, SchnicK W. Synthesis, crystal structure, vibrational spectroscopy, and thermal behaviour of lead dicyanamide Pb[N(CN)2]2. Solid State Sci. 2002;4:821–825.
- Nag A, Schnick W. Synthesis, crystal structure and thermal behavior of gadolinium dicyanamide dihydrate Gd[N(CN)2]3·2 H2O. Z Anorg Allg Chem. 2006;632:609–614.
- Luo J, Zhou XG, Gao S, et al. Syntheses, structures and magnetic properties of two novel 3D helical dicyanamide complexes containing polyamine ligand. Inorg Chem Commun. 2004;7:669–672.
- Corio P, Rubim JC. Surface-enhanced Raman spectroscopy on electrode surfaces as a tool to characterize LUMOs of inorganic complexes with two different ligands. The case of the ion complex [Ru(bipy)2viol]+. J Raman Spectrosc. 1997;28:235–241.
- Lai SH, Ling JW, Huang YM, et al. Characterization of Ir(ppy)3 and [Ir(ppy)2bpy]+ by infrared, Raman spectra and surface-enhanced Raman scattering. J Raman Spectrosc. 2011;42:332–338.
- Han CP, Zhang L, Li HB. Highly selective and sensitive colorimetric probes for Yb3+ ions based on supramolecular aggregates assembled from beta-cyclodextrin-4,4 '-dipyridine inclusion complex modified silver nanoparticles. Chem Commun. 2009;24:3545–3547.
- Luo ZX, Loo BH, Cao XQ, et al. Probing the conformational transition of 2,2'-bipyridyl under external field by surface-enhanced Raman spectroscopy. J Phys Chem. 2012;116:2884–2890.
- Zhao J, Zhang ZC, Yang SS, et al. Facile synthesis of MoS2 nanosheet-silver nanoparticles composite for surface enhanced Raman scattering and electrochemical activity. J Alloy Compd. 2013;559:87–91.
- Zhao H, Fu HG, Zhao TS, et al. Fabrication of small-sized silver NPs/graphene sheets for high-quality surface-enhanced Raman scattering. J Colloid Interf Sci. 2012;375:30–34.
- Rivera-Betancourt OE, Primera-Pedrozo OM, Pacheco-Londoño LC, et al. SERS and density functional theory study of o-dinitrobenzene on Cu nanoparticles. IEEE Sens J. 2010;10:699–706.
- Zhou Q, Li XW, Fan Q, et al. Charge transfer between metal nanoparticles interconnected with a functionalized molecule probed by surface-enhanced Raman spectroscopy. Angew Chem Int Ed. 2006;45:3970–3973.
- Wang H, Levin CS, Halas NJ. Nanosphere arrays with controlled sub-10-nm gaps as surface-enhanced Raman spectroscopy substrates. J Am Chem Soc. 2005;127:14992–14993.
- Qin L, Zou S, Xue C, et al. Designing, fabricating, and imaging Raman hot spots. P Natl Acad Sci USA. 2006;103:13300–13303.
- Guo W, Jiang CH, Guo YM. Anion-directed assembly of cadmium(II)-dicyanamide coordination polymers based on a tripyridyltriazole ligand. Inorg Chim Acta. 2013;405:128–133.
- Zhang YQ, Ma DK, Zhang Y, et al. One-pot synthesis of N-doped carbon dots with tunable luminescence properties. J Mater Chem. 2012;22:16714–16718.
- Chen XX, Jin QQ, Wu LZ, et al. Synthesis and unique photoluminescence properties of nitrogen-rich quantum dots and their applications. Angew Chem Int Ed. 2014;53:12542–12547.
- Rajan D, Quintero PA, Abboud KA, et al. Structural and magnetic properties of four layered dicyanamide-based coordination polymers: M(N(CN)2)2(DMSO)2, [M = Mn, Fe, Co, Ni]. Polyhedron. 2013;66:142–146.
- Vikneswaran R, Ramesh S, Yahya R. Green synthesized carbon nanodots as a fluorescent probe for selective and sensitive detection of iron(III) ions. Mater Lett. 2014;136:179–182.
- Chen XF, Zhang WX, Wang QJ, et al. C-8-structured carbon quantum dots: synthesis, blue and green double luminescence, and origins of surface defects. Carbon. 2014;79:165–173.
- Cui X, Zhu L, Wu J, et al. . A fluorescent biosensor based on carbon dots-labeled oligodeoxyribonucleotide and graphene oxide for mercury (II) detection. Biosens Bioelectron. 2015;63:506–512.
- Alexander BD, Dines TJ, Longhurst RW. DFT calculations of the structures and vibrational spectra of the [Fe(bpy)3]2+ and [Ru(bpy)3]2+ complexes. Chem Phys. 2008;352:19–27.
- Kim D, Choi Y, Shin E, et al. Sweet nanodot for biomedical imaging: carbon dot derived from xylitol. RSC Adv. 2014;4:23210–23213.
- Song B, Meng LH, Huang YD. Preparation and characterization of (POSS/TiO2)n multi-coatings based on PBO fiber surface for improvement of UV resistance. Fiber Polym. 2013;13:375–381.
- Bourissou D, Guerret O, Gabbaï FP, et al. Stable carbones. Chem Rev. 2000;100:39–91.
- Pan DY, Zhang JC, Li Z, et al. Hydrothermal route for cutting graphene sheets into blue-luminescent graphene quantum dots. Adv Mater. 2010;22:734–738.