
ABSTRACT
In the present study, we have prepared nanosuspensions of piroxicam using Soluplus® as the matrix using aqueous-based conventional ball milling. The comparative physico-chemical characteristics were assessed using PXRD (powder X-ray diffraction), DSC (differential scanning calorimetry), FESEM (field emission scanning electron microscopy) and FTIR (Fourier transform infrared spectroscopy) analysis, indicating the nanoformulations displayed lower crystallinity with no chemical interactions between the drug and polymer molecules. The cytotoxicity of the formulations was established from MTT assay performed on Caco-2 cell lines. The release rate of piroxicam from various ratios of drug/polymer nanoparticles was investigated using a USP paddle apparatus. The nanoformulations exhibited higher release of the drug in comparison with the pure drug. The enhanced dissolution characteristics of the drug in the nanoformulations could possibly increase the anti-inflammatory effects of the drug owing to superior bioavailability characteristics.
1. Introduction
In pharmacokinetics and pharmacology, absorption, distribution, metabolism, and excretion describe the disposition of a pharmaceutical compound within an organism. Four of the above-mentioned criteria determine the amount of drug reaching the target tissues, and hence affect the pharmacological activity of the drug.
For the drug to reach the site of action (some tissue), it must travel across mucous surfaces in the gastrointestinal (GI) tract and reach the bloodstream before being taken up by the target cells. Issues like poor aqueous solubility, low gastric emptying time/intestinal transit time, chemical instability of the compound in the gastric/intestinal media, and poor membrane permeability can all reduce the drug absorption, and thus bioavailability after oral administration.
Bioavailability is defined as the fraction of the unchanged drug that finally reaches the systemic circulation. It is one among the most pertinent factors that are considered while dosing for non-intravenous routes of administration. According to the biopharmaceutical classification system (BCS), drugs are sorted based on two factors that influence the bioavailability of the drug – aqueous solubility and membrane permeability.
The formulation of poorly soluble (BCS class II) drugs has always been of a serious concern in the pharmaceutical industry since these drugs are often known to show anomalous absorption and highly irregular bioavailability. Moreover, since these compounds dissolve slowly, they may get eliminated from the GI tract even before they fully dissolve and be absorbed into the circulation. Although the drugs are of high permeability, the poor solubility results in a low concentration gradient between the gut and blood vessel, consequent to a limitation of drug transport and oral absorption.[Citation1] Thus, the rate-limiting step for absorption of the drugs in this class is the low dissolution characteristics.
Several strategies such as solid dispersions,[Citation2] micronisation, salt formation,[Citation3] liposomes,[Citation4] emulsions,[Citation5] and inclusion complexes [Citation6] have been employed for poorly water soluble systems. Of late, nanoscience-based approaches such as nanocrystals [Citation7–9] and nanosuspensions [Citation10,Citation11] are rapidly gaining popularity in pharmaceutical sciences.
The nanoparticles are prepared either by breaking up of larger crystals (top-down approach) [Citation12,Citation13] or by building up nanosized particles from dissolved molecules (bottom-up approach).[Citation13–15] While bottom-up approaches offer the advantage of size and morphology control, they are tedious, often require the usage of several solvents and more importantly are not easily scalable to the requirement of the industry.
In this work, we report the usage of a very simple and scalable top-down technique, wet ball milling in aqueous media, to synthesise piroxicam–Soluplus® nanosuspensions.
Piroxicam [4-hydroxy-2-methyl-N-(2-pyridinyl)-2H-1,2-benzothiazine-3-carboxamide 1,1-dioxide] is a nonsteroidal anti-inflammatory drug commonly used as a remedial agent for relieving pain and inflammation in arthritic conditions. However, it is a BCS class II drug and there is a considerable interest in developing new formulations to improve its absorption. The chosen carrier, Soluplus®, a graft co-polymer (polyvinyl caprolactam–polyvinyl acetate–polyethylene glycol (PEG)) is a specially designed solubiliser manufactured by BASF, Mumbai, India. Due to its amphiphilic property arising from its bifunctional nature, it is expected to act as an excellent matrix to dissolve poorly soluble drugs in aqueous medium.[Citation16,Citation17] The nanosuspensions were lyophilised and the physico-chemical properties of the obtained formulations were assessed using Fourier transform infrared spectroscopy (FTIR) and X-ray diffraction (XRD). We have investigated the cytotoxicity of the Soluplus® and the formulations using cell viability experiments by 3-(4,5-dimethylthiazol-2-yl)-2,5-diphenyltetrazolium bromide (MTT) assay on Caco-2 cell lines. We have also established their in vitro dissolution rate using a USP type II paddle apparatus and explored the mechanism of drug release from the formulations by fitting the data obtained from the dissolution studies into several mathematical models.
2. Materials and methods
2.1. Materials
Piroxicam (Batch no. ALC/PCM/131101, Nov. 2014) and Soluplus® were obtained as gift samples from SKN Organics, Pondicherry, India and BASF, Mumbai, India, respectively. All other chemicals used were of analytical grade.
2.2. Preparation of nanosuspensions
Nanosuspensions were prepared via wet milling using a conventional Retsch Planetary ball mill using the amphiphilic carrier, Soluplus®, in various drug-to-polymer ratios (2:1, 1:1, 1:2, 1:3, 1:4). The drug and polymer (in the required ratios, total weight 8 g) were introduced into an agate milling chamber containing 1 mm agate balls. Forty millilitre of double distilled water was added to fill the chamber. The samples were co-milled at 500 rpm for 6 hours. Regular breaks of 5 minutes were provided after every 15 minutes of milling to avoid overheating caused due to the high energy involved in the milling process. The high shear force generated by the collision of the agate balls with the solid drug particles fractures the drug crystals into smaller particles and thus nanosuspensions were formed.[Citation12,Citation18]
The nanosuspensions thus formed by co-milling were lyophilised using a Minilyodel table top laboratory lyophiliser at a temperature of −40 °C for about 24 hours. The porous cake thus obtained was then gently pulverised to obtain free-flowing powders. Mannitol (0.1% by weight) was added as a cryoprotectant during lyophilisation.
2.3. Physico-chemical characterisations
2.3.1. Fourier transform infrared spectroscopy
FTIR spectra were obtained using an FTIR spectrophotometer (Spectrum FTIR (Scimadzu, IRAffinity-1)). The spectrum was recorded in the range of 4000–400 cm−1. The procedure consisted of dispersing a sample in KBr followed by gentle mixing. The spectrum was scanned at a resolution of 0.15 cm−1 and the scan speed was 20 scan/s.
2.3.2. Differential scanning calorimetry (DSC)
Differential scanning calorimeter (TGA DSC 1, Mettler Toledo) was used to characterise the thermal behaviour of the samples. The samples were heated at a rate of 10 °C min−1 from ambient temperature (25 °C) to 250 °C.
2.3.3. X-ray diffraction (XRD)
XRD patterns were recorded using PANalytical X'pert Pro MPD diffractometer, with the following settings: Cu Kα radiation with wavelength 1.54 Ǻ, voltage = 45 kV, current = 40 mA. Measurements were made in the 2θ range of 10°–80°.
2.3.4. Field emission scanning electron microscopy (FESEM)
Double-sided carbon tapes were fixed on an aluminum stub. The nanosuspensions were drop-casted onto the tape and left aside in a desiccator for drying. Successively, they were gold-sputtered for 10 minutes. The aluminum stub was placed in the vacuum chamber of a scanning electron microscope (Carl Zeiss SMT-Super Ultra Model Gemini Ultra 55) operated at 4 kV. The particles were observed for surface characteristics.
2.3.5. Phase solubility
Phase solubility of piroxicam in various concentrations of Soluplus® was determined using the Higuchi and Connors method.[Citation19] To Erlenmeyer flasks (250 mL) containing 25 mL of the different concentrations of the polymer solution (0.1%, 0.25%, 0.5%, 0.75% and 1%, w/v), an excess amount of drug (1 g) was added.
The flasks were suitably sealed and shaken at 100 rpm in an orbital shaker cum incubator for 48 hours at 37 °C. They were left in the incubator for another 24 hours for the equilibrium to be established. Then, 5 ml of supernatant was withdrawn and filtered. The amount of drug in the filtrate was photometrically determined using a UV–VIS spectrophotometer at 273 nm after suitable dilution. The studies were carried out five times.
2.3.5.1. Data analysis
The stability constant (KS) was calculated from the phase solubility profiles according the following relation:
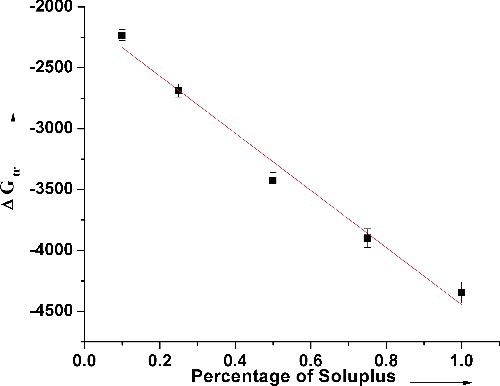
ΔG°tr values of piroxicam were computed using the following equation:where S0 is the molar solubility of piroxicam in distilled water, Ss is the molar solubility of piroxicam in presence of Soluplus®, R = 8.31 J K−1 mol−1, and T is the temperature in degree kelvin.
Gibbs free energy of transfer (ΔG°tr) values indicate whether the particular treatment is favourable for the solubilisation of the drug in an aqueous medium. The more negative the value, the more the spontaneity of the solubilisation process.
2.3.6. Cell culture
The cell culture experiments were performed in a biosafety level II cabinet hood. The Caco-2 cells of passage number 12–25 were cultured using minimum essential medium, MEM (pH 7.4), in culture plates at 37 °C in a humidified atmosphere with 5% CO2. The other supplements added to the medium were heat-inactivated foetal bovine serum, sodium bicarbonate, antimycotic and antibacterial mixture and gentamycin. The medium was changed every alternate day till the cells became 80% confluent. The washing of the cells were done using phosphate buffer saline and the removal of cells were performed by trypsinisation [0.25% trypsin, 0.2% ethylenediaminetetraacetic acid (EDTA) solution] at 37 °C for 7–10 minutes. The cells salvaged from trypsinisation were obtained as a pellet by centrifugation for 3 minutes at 200 x g and resuspended into the MEM and used for sub-culturing or cytotoxicity studies.
2.3.7. Cytotoxicity studies
The resuspended cells obtained after trypsin treatment of an 80% confluent plate were seeded at a cell density of 4 × 10³ in a 96-well plate for 48 hours and successively exposed to different concentrations of piroxicam, Soluplus® and the nanosuspensions made by the culture medium. The cytotoxicity was assessed from the cell viability data obtained from the MTT cell proliferation assay. The absorbance was measured with microplate reader at 490 nm. Cell viability was assessed as the percentage of absorbance of the analyte with respect to the control. The statistical significance of the difference with respect to control was investigated by the two-tailed Student's t-test.
2.3.8. In vitro dissolution testing
The in vitro dissolution analyses were performed using a USP type II dissolution testing paddle apparatus (DBK Dissolution Tester, Mumbai, India). A known amount of sample (equivalent to 10 mg of piroxicam) was introduced into the glass jar of the USP type II paddle apparatus containing 900 mL of simulated gastric fluid (0.1 N HCl, pH 1.2). This was stirred at 70 rpm for 2 hours. After predetermined regular intervals, 3 mL aliquots of the sample were withdrawn, filtered and suitably diluted. The concentrations of the withdrawn solutions were determined using a UV spectrophotometer (Schimadzu, UV 2450). To maintain a constant volume during dissolution, 3 mL of solution was replaced into the glass jar after every withdrawal. In order to make up for the loss of drug and the dissolution medium that occurs because of dilution caused during this sampling, the corrections were made according to the following equation:where Ci is the corrected absorbance of the ith observation, Ai is the observed absorbance, Vs is the volume of the sample, Vt is the total volume of dissolution medium.
The percentage of the drug dissolved, thus obtained, was plotted versus time. Each experiment was performed three times.
The data obtained from the dissolution analysis were fitted into various mathematical models listed in to describe the drug release mechanism from the different formulations.
Table 1. Mathematical models used to predict drug release mechanism.
3. Results and discussions
3.1. Phase solubility
To assess if Soluplus® is an ideal choice as a carrier for solubilising piroxicam, phase solubility studies were carried out. The solubility of piroxicam in distilled water was determined to be 1.138 μg/mL, which implies that it is poorly water soluble. The phase solubility data () show a linear increase in drug solubility with increasing Soluplus® concentration, (R2 = 0.998). This enhanced effect on the solubility of the drug could be attributed to the several hydroxyl groups present in the polymer chain and its surface active properties. The phase solubility diagram followed an AL-type system at the given range of concentrations.[Citation19,Citation20] Moreover, the values of ΔG°tr also varied linearly and became more negative with increasing concentrations of Soluplus®, showing that the drug solubilisation process is spontaneous in the presence of the polymer (). The rapid negative increase in ΔG°tr values with the polymer concentration also indicates that the transfer of the drug from aqueous phase at the drug particle vicinity to the bulk of the carrier solution is more favourable at higher carrier concentrations. However, the stability constant KS calculated from the slope and intercept of the phase solubility curve is 4.734 mL g−1, which is indicative of the binding affinity between the drug and the carrier. The low value of KS predicts that the binding affinity between piroxicam and Soluplus® would not be strong though the high ΔG°tr values predict spontaneous drug solubilisation.
Figure 1. Phase solubility of piroxicam in different concentrations of the polymer Soluplus®.
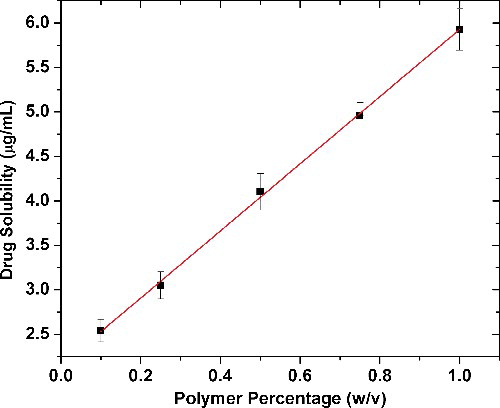
Figure 2. Gibbs free energy of transfer values with increasing Soluplus concentrations.
3.2. PXRD
Distinct sharp peaks of piroxicam were obtained at the diffraction angles 14.50, 17.73 and 27.45 (). Thus, the crystalline nature of pure piroxicam is evident from its powder X-ray diffraction (PXRD) spectrum. The spectrum of the polymer Soluplus® contains broad indistinct peaks resulting from the anisotropic scattering of X-rays indicating its amorphous nature. The positions of diffraction peaks of piroxicam in the nanosuspensions were almost completely superimposable, indicating no chemical interaction between these two components or existence or formation of any other crystal morphology. However, the broadening of the peaks in the various formulations suggests decreasing crystallite sizes of the drug dispersed in the polymer with increase in the polymer-to-drug ratio.
Figure 3. Overlay of the PXRD patterns of piroxicam, Soluplus® and the nanoformulations.
3.3. Thermal analysis
The thermal analysis (TA) curve () of pure piroxicam shows a distinct melting endotherm at 203 °C, indicating the pure crystalline form of the drug. The TA curves of the nanosuspensions showed decreased onset-melting point temperatures and reduced intensity of the melting point-endothermic peak with increasing polymer concentration. This could be attributed to the reduced lattice energy in the formulations leading to the less distinct melting point peak.
Figure 4. Overlay of the thermal analysis curves of piroxicam, Soluplus® and the nanoformulations.
3.4. FTIR analysis
The overlay of the FTIR spectra of the drug, polymer and the nanoformulations is presented in . Soluplus® is a block co-polymer of PEG, polyvinyl caprolactam and polyvinyl acetate. Soluplus® showed peaks at 3448.72 cm−1 (O–H stretching), 2924.08 cm−1 (aromatic C–H stretching), 1735.93 cm−1, 1635.23 cm−1 (C–O stretching), and 1477.21 cm−1 (C–O–C stretching). The FTIR spectrum of piroxicam shows a characteristic peak at 3344.5 cm−1 corresponding to the N–H stretching. The spectra of the nanosuspensions show that there was no interaction between the drug and the polymer.
Figure 5. Overlay of FTIR spectra of piroxicam, Soluplus® and the nanoformulations.
3.5. Morphology and particle size analysis
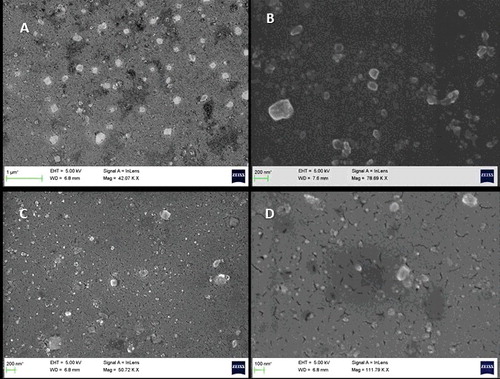
The SEM images of the nanoformulations of piroxicam and Soluplus® in the ratios of 2:1 and 1:4 obtained from wet ball milling after 10 hours are shown in . The particles were of varied morphology with particle shapes ranging from irregular, cuboidal to round. The size distribution varied from about 50 to 300 nm. Since ball milling is a top-down synthetic route, it offers poor control over morphology and size distribution. Both the formulations showed similar characteristics in terms of morphology and particle size.
Figure 6. FESEM images of Piroxicam Soluplus Nanoformulations of ratios 2:1 (above) and 1:1 (Below) after 6 hours of milling.
3.6. Cytotoxicity
Caco-2 cell lines are often used as models to establish the membrane permeability of drugs. Piroxicam is a BCS class II drug and so it has excellent permeability across the GI membrane. In order to establish the cytotoxicity of our nanoformulations in comparison to the carrier and drug alone, the Caco-2 cells were exposed to Soluplus and the nanoformulations for 12 hours and then cell viability was assessed using MTT assay (). Scintigraphic gastric transit studies in humans suggest that the maximum exposure time of a drug in the GI tract is 12 hours.[Citation21] Hence, we have selected a 12-hour exposure time for the present studies.
Figure 7. Caco-2 cell viability after exposure to various concentrations of Soluplus® and the nanoformulations (NS PS 1:1 and 1:4 for 12 hours). Significantly different with respect to control: *p < 0.05, #p < 0.05.
Figure 8. Dissolution analysis of the nanoformulations in comparison of the pure drug.
shows the percent cell viability with respect to the control on exposure of various concentrations of the pure drug, Soluplus® and the various piroxicam–Soluplus® nanoformulations. A significant decrease in cell viability was seen only at or above 0.1% of Soluplus for 12-h exposure. There is a significant increase in cell viability at 0.01% concentration of nanoformulations as well as Soluplus®. This observed increase in the viability could be partly due to increased transport of tetrazolium salt inside the cells. A similar phenomenon has also been observed in the case of other excipients as well.[Citation21,Citation22] It is thus clear from our findings that the nanoformulations had no significant effect on the viability of Caco-2 cells below 0.01% concentrations. Here it is important to note that intact intestinal membranes (in vivo) often are found to be more resistant to the cytotoxic effects of excipients than are cell culture models (in vitro). The intestine has a protective mucous layer, whereas the cell culture monolayers do not. The intestinal tissues also have more capacity to recover from trauma than the cultured cells. Hence, the present nanoformulations can be expected to show lesser cytotoxicity in in vivo studies.
3.7. Dissolution analysis
As can be seen in , the dissolution profile of piroxicam indicates that it has very poor solubility in simulated intestinal fluid (SIF) (less than 40% dissolved after 2 hours). The dissolution of piroxicam from all the nanoformulations studied was significantly faster than that of the pure drug. The dissolution profiles show that the release of piroxicam from all the nanoformulations is gradual and not of the burst release types. All the formulations achieved supersaturation by the end of about one hour. There was no visible decline in the supersaturation in any of the formulations even at the end of two hours. This negates the occurrence of any recrystallisation of the dissolved drug in the dissolution medium. Increase in the Soluplus® content in the fomulations had an enhanced effect on the dissolution of piroxicam. This improvement can be attributed to improved wetting characteristics, micellar solubilisation, and surface adsorption of the drug on the polymer.[Citation6,Citation23,Citation24] The highest dissolution enhancement was achieved for the formulation with the drug-to-polymer ratio of 1:4 which is 95% at 90 minutes. This is a 144% enhancement when compared to that of the pure drug.
Dissolution efficiency (DE) is the area under the dissolution curve within a given range of time. It is a comparative dissolution parameter which takes the entire dissolution profile into account rather than a single point. The absorption of a drug can be assumed to be directly proportional to the amount of drug dissolved and the time the solution is in contact with the region of absorption in the GI tract. And also since the in vivo bioavailability of a drug is estimated as the area under the blood level curve, it is more relevant to represent the dissolution data in terms of percentage dissolution efficiency (%DE). lists out %DE values for different time periods with increasing polymer weight percent.
Table 2. Dissolution efficiencies achieved with varying polymer content in the formulations.
During the initial time periods, the enhancement in the DE with increasing polymer percentage is hardly significant. At t = 5 minutes, the DE values of the drug is only 4.50%. This increases gradually with increasing ratio of the polymer, reaching up to 17.02% which is a four-fold increase compared to that of the pure drug. The lower values of DE during the initial time periods (up to 30 minutes) could be due to slow emulsification process. At the end of 120 minutes, the DE achieved by piroxicam alone is only 27%. By increasing the polymer content to 66% in the nanoformulation, the DE increased to 72%.
3.8. Mathematical modelling studies
lists the slopes and R2 values obtained from fitting the experimental in vitro dissolution data into the various release kinetic models. The fitting for all the formulations were carried out for the data obtained until the last sampling time, i.e. 120 minutes. The Higuchi model described the drug release data of pure piroxicam the best while the nanoformulations were observed to best fit into the Korsmeyer–Peppas model. Predominantly, the most befitting model describing the release mechanisms for all the formulations was the Korsmeyer–Peppas model, while the zero order model was the least befitting.
Table 3. Statistical parameters obtained after fitting the drug release data to various release kinetic models.
According to the Korsmeyer–Peppas power law, the value of n describes the release mechanism of the drug. The values of the diffusional release exponent n computed from the slopes of this model fell within a range of 0.640–0.721. Since these values fall between 0.43 and 0.85 (assuming spherical geometry), all the formulations exhibit anomalous non-Fickian release kinetics.[Citation25] Thus, the release phenomena may be regarded to be both diffusion- and swelling-controlled.[Citation26,Citation27]
4. Conclusions
Aqueous-based wet ball milling, an easy and scalable manufacturing top-down process, was used as a synthetic route for piroxicam–Soluplus® nanosuspensions. The solubilising characteristics of Soluplus® were investigated using the phase solubility studies. The physico-chemical characteristics of the nanoformulations, established using PXRD, DSC, FESEM and FTIR analysis indicate that reduced drug crystallinity played a pivotal role in governing the solubility characteristics of the drug. Dissolution studies show that by increasing Soluplus content in the formulation to 66%, an enhancement of 144% could be achieved in comparison to the pure drug. The Korsmeyer–Peppas model best fits the in vitro dissolution data and gives an insight into the possible drug release mechanism dominated by anomalous non-Fickian diffusion.
Acknowledgments
The authors thank BASF, Mumbai and SKN Organics, Pondicherry for providing them with the polymer and the drug, respectively. They also are grateful to Dr Venketesh S of the Department of Biosciences, Sri Sathya Sai Institute of Higher Learning for his guidance in cell culture studies.
Disclosure statement
No potential conflict of interest was reported by the authors.
Additional information
Funding
References
- Guidance for industry waiver of in vivo bioavailability and bioequivalence studies for immediate-release solid oral dosage forms based on a biopharmaceutics classification system. U.S. Department of Health and Human Services, FDA; 2000. Available from: http://www.fda.gov/cder/guidance/index.htm
- Vasconcelos T, Sarmento B, Costa P. Solid dispersions as strategy to improve oral bioavailability of poor water soluble drugs. Drug Discov Today. 2007;12:1068–1075.
- Serajuddin ATM. Salt formation to improve drug solubility. Adv Drug Deliv Rev. 2007;59:603–616.
- Maestrelli F, González-Rodríguez ML, Rabasco AM, et al. Preparation and characterisation of liposomes encapsulating ketoprofen–cyclodextrin complexes for transdermal drug delivery. Int J Pharm. 2005;298:55–67.
- Choonara YE, Pillay V, Ndesendo MKV, et al. Polymeric emulsion and crosslink-mediated synthesis of super-stable nanoparticles as sustained-release anti-tuberculosis drug carriers. Colloids Surf B Biointerfaces. 2011; 87:243–254.
- Taupitz T, Dressman JB, Buchanan CM, et al. Cyclodextrin-water soluble polymer ternary complexes enhance the solubility and dissolution behaviour of poorly soluble drugs. Case example: itraconazole. Eur J Pharm Biopharm. 2013;83:378–87.
- Müller RH, Keck, CM. Twenty years of drug nanocrystals: where are we, and where do we go? Eur J Pharm Biopharm. 2012;80:1–3.
- Lai F, Pini E, Angioni G, et al. Nanocrystals as tool to improve piroxicam dissolution rate in novel orally disintegrating tablets. Eur J Pharm Biopharm. 2011;79:552–558.
- Lai F, Pini E, Corrias F, et al. Formulation strategy and evaluation of nanocrystal piroxicam orally disintegrating tablets manufacturing by freeze-drying. Int J Pharm. 2014;467:27–33.
- Patravale VB, Date A, Kulkarni RM. Nanosuspensions: a promising drug delivery strategy. J Pharm Pharmacol. 2004;56:827–840.
- Kakran M, Sahoo NG, Li L, et al. Fabrication of drug nanoparticles by evaporative precipitation of nanosuspension. Int J Pharm. 2010;383:285–292.
- Ghosh I, Michniak-Kohn B. Design and characterization of submicron formulation for a poorly soluble drug: the effect of vitamin E TPGS and other solubilizers on skin permeability enhancement. Int J Pharm. 2012;434:90–98.
- Bhakay A, Merwade M, Bilgili E, et al. Novel aspects of wet milling for the production of microsuspensions and nanosuspensions of poorly water-soluble drugs. Drug Dev Ind Pharm. 2011;37:963–976.
- Rezaei Mokarram A, Kebriaee Zadeh A, Keshavarz M, et al. Preparation and in-vitro evaluation of indomethacin nanoparticles. Daru. 2010;18:185–192.
- Araújo J, Gonzalez E, Egea MA, et al. Nanomedicines for ocular NSAIDs: safety on drug delivery. Nanomedicine. 2009;5:394–401.
- BASF. Technical information Soluplus. BASF, Pharma Ingredients Serv. 2010;1–8. Available from: https://industries.basf.com/en/documentDownload.8805242743253.Soluplus%C2%AE%20-%20Technical%20Information.pdf
- Reintjes T. Solubility enhancement with BASF pharma polymers: solubilizer compendium. Lampertheim: BASF SE, Pharma Ingredients and Services; 2011.
- George M, Ghosh I. Identifying the correlation between drug/stabilizer properties and critical quality attributes (CQAs) of nanosuspension formulation prepared by wet media milling technology. Eur J Pharm Sci. 2013;48:142–152.
- Maulvi FA, Dalwadi SJ, Thakkar VT, et al. Improvement of dissolution rate of aceclofenac by solid dispersion technique. Powder Technol. 2011; 207:47–54.
- Karataş A, Yüksel N, Baykara T. Improved solubility and dissolution rate of piroxicam using gelucire 44/14 and labrasol. Farmaco. 2005;60:777–782.
- Sethia S, Squillante E. In vitro–in vivo evaluation of supercritical processed solid dispersions: permeability and viability assessment in Caco-2 cells. J Pharm Sci. 2004;93:2985–2993.
- Boulenc X, Roques C, Joyeux H, et al. Bisphosphonates increase tight junction permeability in the human intestinal epithelial (Caco-2) model. Int J Pharm. 1995;123:13–24.
- Linn M, Collnot E-M, Djuric D, et al. Soluplus® as an effective absorption enhancer of poorly soluble drugs in vitro and in vivo. Eur J Pharm Sci. 2012;45:336–343.
- Kim M-S. Soluplus-coated colloidal silica nanomatrix system for enhanced supersaturation and oral absorption of poorly water-soluble drugs. Artif Cells Nanomed Biotechnol. 2013;41:363–367.
- Siepmann J, Peppas N. Modeling of drug release from delivery systems based on hydroxypropyl methylcellulose (HPMC). Adv Drug Deliv Rev. 2012;64:163–174.
- Dash S, Murthy PN, Nath L, et al. Kinetic modeling on drug release from controlled drug delivery systems. Acta Pol Pharm. 2010;67:217–223.
- Korsmeyer RW, Gurny R, Doelker E, et al. Mechanisms of solute release from porous hydrophilic polymers. Int J Pharm. 1983;15:25–35.