
ABSTRACT
Copper oxide nanotubes decorated by TiO2 nanoparticles (CNTNs) were fabricated by simple three-step method. First, deposition of copper onto cellulose fibres, then thermal oxidation of copper and cellulose fibres and last simply mixing copper oxide nanotubes and TiO2 nanoparticles (NPs). Scanning electron microscopy, transmission electron microscopy and X-ray diffraction showed that the synthesised nanotubes were monoclinic-structured polycrystalline CuO with diameter and wall thickness of approximately 50∼100 nm and 20∼25 nm, respectively. Moreover, the diameter of the TiO2 NPs is about 20∼30 nm. Optical properties of the solutions containing copper oxide nanotubes decorated by TiO2 NPs were studied. Discrete dipole approximation was used for the calculation of absorption, scattering and extinction cross sections of the deposited CNTNs on a glass substrate. Our simulation results show that there are good agreements between the experimental date and the simulation results. Moreover, the photocatalytic tests were done by methyl orange under visible light (λ = 633 nm) irradiation for prepared samples.
KEYWORDS:
1. Introduction
Photocatalytic water splitting to produce hydrogen has been widely studied because it provides a clean and renewable method of hydrogen production based on solar energy and water.[Citation1] Various photocatalysts have been developed for the photocatalytic water splitting, but titanium dioxide (TiO2) is still most widely used as a photocatalyst because of its high resistance to photocorrosion, stability in aqueous solution and low cost as well as high hydrogen production rate.[Citation2]
The specific surface area of the photocatalyst influences the efficiency of the heterogeneous catalytic reaction through more photoelectrons and photo holes reaching onto the surface.[Citation3–6] The use of fibrous structures is considered as one of the appropriate ways to achieve high surface area. On the other hand, the oxides of transition metals are an important class of semiconductors and have been intensively studied because of their special properties for potential applications, such as for solar cells, electronics and photocatalysis.[Citation7–10] Among various oxides of transition metals, copper oxides have attracted considerable attention due to their interesting photochemical and photo magnetic properties. Moreover, copper oxides are visible-light-active and with the TiO2 shelling they are expected to be resistant to the photocorrosion of the narrow-band gap copper oxide core nanocrystals and to dramatically improve the charge separation efficiency and photo activity by forming a hetero-junction structure between TiO2 and CuO, making them more useful in the fields of photosynthesis and pollutant treatment.
Here, we demonstrate a simple, facile approach for fabrication of copper oxide nanotubes decorated by TiO2 nanoparticles (CNTNs) by deposition of copper oxide onto cellulose fibres. Self-standing copper oxide nanotubes are fabricated by heat removal of the cellulose fibres, followed by sintering of the remaining copper nanoparticles (NPs) and finally, the CNTNs were fabricated by simply mixing copper oxide nanotubes and TiO2 NPs.
2. Experimental details
A typical reduction/precipitation of copper on cellulose fibres is as follows: the starting copper ammonia aqueous solution was made by mixing 200 mM CuNO3 solution, 400 mM KOH solution and ammonium hydroxide (25%). About 0.007 g of cellulose fibres was dispersed in the mentioned solution by using sonication for 10 min. A solution of 280 mM sucrose (C12H22O11, Merck) was then added to reduce copper on the surface of cellulose fibres. The reaction was performed under mild magnetic stirring for 30 min to immobilise copper onto the cellulose fibres. A rinsing process involving three cycles of washing was performed with water, and then precipitated products were dried on a hot-plate at 90 °C for 3 h. The last process led to the oxidising of copper fibres. Self-standing nanostructured copper oxide fibres were used as the substrate for deposition of TiO2 NPs.
The titania utilised in this study was a commercially available dry powder TiO2 NPs (Plasmachem GmbH) of pure anatase crystalline structure with nominal 20 nm particle size (BET surface area 150 m2/g). In order to obtain copper oxide nanotubes from the core-shell composite fibres as well as remove uncovered fibres; and oxidation of Cu as by-products, which are formed during reduction/precipitation of copper on fibres, precipitated products were calcined in air at 300 °C for 2 h. After this post-treatment, the dark brown initial powder consisting completely and partially copper oxide-covered fibres is converted to a black colour. The copper oxide nanotubes were added to a suitable concentration aqueous solution of TiO2 (0.5 g at 50 ml). Recent solution was stirred for 30 min at room temperature to titania deposited onto the copper oxide fibres and then the product was washed with distilled water several times and dried in air.
All SEM analysis was performed with a Cam scan MV2300 electron microscope. The solutions contain Cu nanotubes decorated by TiO2 NPs ultrasonically dispersed and then they were deposited on a glass slide, and dried at room temperature. The optical transmission of dispersed CNTNs was studied by visible near-infrared spectroscopy. X-ray diffraction (XRD) patterns were taken from a X-ray diffractometer (Siemens D5000) using Cu–Kα (1.5406 Å) radiation.
3. Results and discussion
The morphology of the prepared nanotubes has been probed by scanning electron microscopy (SEM). shows the SEM morphology of the CuO nanotubes after heat treatment in which cellulose fibres are omitted from the inner parts of the copper coatings and copper oxide nanotubes are fabricated. A homogenous shrinkage in all directions is observed compared to the original cellulose fibres, where the diameter of CuO fibres is about 70% smaller than the diameter of cellulose fibres. It seems the formed copper complexes (Cu(NH3)42+) in copper ammonia aqueous solution were attracted towards the negatively charged surface of cellulose fibres by ion–dipole electrostatic interactions and homogeneously distributed on the surface of fibres.[Citation11] Therefore, the overall shape of fibres has followed the shape of cellulose fibres and has formed approximately tubular structures.
Figure 1. Typical SEM micrograph of the CNTNs on glass substrates. The scale bare is 10 µm.
Depending on the relative magnitude of the attractive or repulsive forces, the particles can be well dispersed or aggregated in as solution. The adhesion between copper oxide nanotubes and TiO2 NPs can be explained by the Derjaguin, Landau, Vervey, and Overbeek (DLVO) theory,[Citation12] which is generally used to analyse the behaviour of particles dispersed in a solution. According to the DLVO theory, the particles dispersed in a solution get attractive or repulsive forces between the particles due to the surface charges of the particles and Van der Waals force. The surface charges of the TiO2 NPs and copper oxide nanotubes were characterised by zeta potential analysis. It is well known that the zeta potential of the TiO2 NPs and copper oxide nanotubes are about –15 mV and +25 mV, respectively.[Citation13] If absolute zeta potential of NPs is less than 30 mV, the NPs tend to aggregate because Van der Waals attraction force is larger than electrostatic repulsion force between the NPs.[Citation14,Citation15] However, the opposite surface charge of TiO2 NPs and copper oxide nanotubes is a factor that explains electrostatic attractive force between copper oxide nanotube and TiO2. Hence, TiO2 NPs can adhere to copper oxide nanotubes more easily than TiO2 themselves.
The CNTNs, examined by transmission electron microscopy (TEM), were found to have a granular morphology and a mean diameter of about 100 nm. It must be mentioned that during the annealing process in air at 300 °C, a morphological evolution was observed as a function of the thermal oxidation time. It can be seen that at least 10 min of oxidation is required in order to form fully hollow nanostructures. The total diameter and the thickness of the oxide shell increase slightly between 0 and 10 min of thermal oxidation and become almost constants afterwards. shows that the TEM micrograph of the (1) as-deposited CuO on cellulose fibres and (2) sample which heated at 300 °C for 10 min. The CuO nanotubes have diameter and wall thickness of approximately 100 and 20 nm, respectively. (c) shows the TEM micrograph of the CNTNs which heated at 300 °C for 30 min. The thickness of the oxide shell is almost constant. Moreover, the diameter of the TiO2 NPs is about 20∼30 nm. shows the optical transmission of deposited CuO on cellulose fibres which heated at 300 °C for different times of 0, 5 and 10 min. It is observed that by increasing the heating time, the optical transmission increases. This is due to oxidation of cellulose fibres and hence removal of them from the centre of nanotubes and replacement by air. Moreover, the optical transmission blue shifts by the increase of the heating time. It is well known that by the increase of the refractive index of the medium, the optical transmission of nanostructures red shifts. Here, replacement of cellulose by air led to decrease of effective refractive index and hence it is expected that transmission shows a blue shift. It must be mentioned that the small amount of cellulose products maybe remained inside the CNTNs after calcination. However, our energy dispersive X-ray results show that this value is less than 1%. It seems that this value has no significant influence on the optical response and hence, we ignore them in all calculations.
Figure 2. TEM images of the (a) as-deposited CuO on cellulose fibres, (b) sample which heated at 300 °C for 10 min, (c) the CNTNs which heated at 300 °C for 30 min. The scale bare is 100 nm.
Figure 3. Optical transmission of deposited CuO on cellulose fibres which heated at 300 °C for different times of 0, 5 and 10 min.
The nature of fabricated CNTNs has been investigated by XRD. The XRD pattern carried out in grazing incidence mode () shows several peaks at 2θ = 35°, 38.7° and 48.8° corresponding to the (002), (111) and (202) reflections of the CuO, respectively. The presence of all these reflections clearly points to the polycrystalline nature of the nanotube arrays. Moreover, the diffractogram of the samples show peaks at 25.3°, 47.7° and 54.6° due to diffraction from the (101), (112) and (211) planes of the anatase phase of TiO2.
Figure 4. XRD pattern of the CNTNs.
The average crystallite sizes of samples estimated from the XRD peaks, according to Scherer's equation:
where D is the average crystallite size (nm), λ is the X-ray wavelength used, θ is the angle of diffraction and β is a full width at half the maximum of the diffraction line in radians. The crystallite size of samples was calculated from (101) peak of TiO2 and (002) peak of CuO, respectively. The crystallite size of TiO2 and CuO are 34 and 78 nm, respectively, for the sample which calcined for 30 min.
A typical absorption of the CNTNs deposited on a glass substrate is shown in . Optical absorption was carried out by using unpolarised light at normal incidence in the wavelength range of 0.3–1 µm. It is clear from this figure that at the larger wavelength region, films become transparent. Moreover, it can be observed that the decrease in absorption is not sharp, which indicates that the absorption band gap in the films is not due to a direct band gap. It is well known that both the anatase TiO2 and CuO have indirect band gap. Hence, the energy gap of the samples was calculated by using their absorption spectra and the following formula, where the films reflectance was ignored:
Figure 5. Experimental absorption of the CNTNs on glass substrate and calculated absorption, scattering and extinction cross sections of the CNTNs.
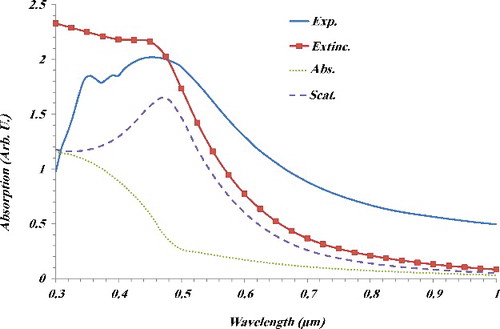
Here, I0 and I are the intensity of the incident and the transmitted light on/from the sample, respectively. Moreover, d is the thickness of the layer, hυ the energy of the incident light and Eg the band gap of the sample. A typical graph of (αhυ)1/2 versus hυ (eV) of the sample is shown in . The band gap of the CNTNs on a glass substrate was estimated about 3.2 eV. These values are similar to the band gap of the anatase phase of Tio2. However, shows another small band gap with a value of about 1.8 eV.
Figure 6. Graph of (αhν)1/2 versus hν (eV).
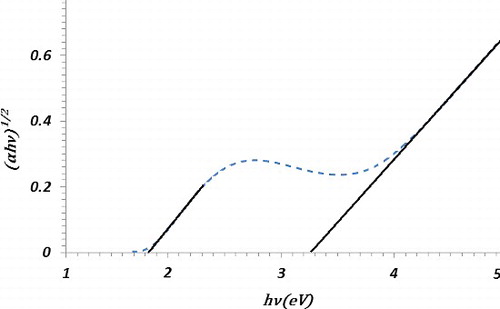
The band gap energies of CuO and Cu2O are 1.2 and 2.1 eV, respectively. It is well known that CuO has indirect band gap which increases by the decrease of size. Hence, one could respect that samples show two band gap which are related to Tio2 and CuO.
To discuss the optical absorption spectrum of nanostructures, we used the discrete dipole approximation (DDA). The DDA is a method frequently employed to calculate optical properties of metal nanostructures having arbitrary shapes and sizes. In this treatment, the nanostructure is described as a cubic array lattice of electric dipoles (N-point dipoles) in which the polarisability and position vector of each dipole are specified as αi and , respectively, where i = 1, 2, . . . , N. The polarisation induced
in each particle in the presence of an applied plane wave field is
, where the local field
is the sum of the field radiated from all the other N – 1 dipoles. For a given wavelength λ, the local field can be written as
(1)
where and
are the wave vector and amplitude of the incident radiation. The contribution to the electric field at position i due to the dipole at position j is contained in the second term on the right-hand side of (Equation1
(1) ) and is usually expressed in terms of the dipole–dipole interaction matrix
as
(2)
where and rij correspond to the dipole–dipole position difference vector and magnitude that are defined as
and
, respectively.
If , EquationEquation (1)
(1) can be transformed into a system of 3N complex linear equations whose solutions yield the unknown polarisation vectors
, in terms of which the extinction and absorption cross sections can be determined as
(3)
(4)
where Im denotes the imaginary part of the expression in the brackets, and ∗ is the usual complex conjugate symbol. Finally, one can determine the cross section by (5)
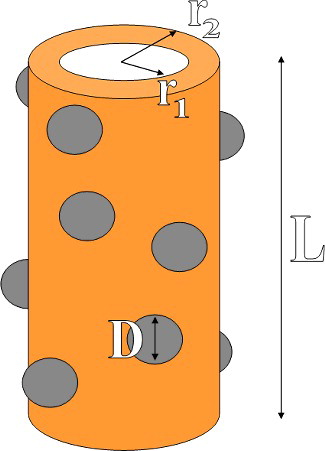
For the resolution of the 3N complex linear equations system, we used the free code DDSCAT 7.3 implemented by Draine and Flatau.[Citation16–18] The extinction, absorption and scattering spectra in the 300–1000 nm range were calculated using this approach. Schematic view of a simulated CNTN is shown in . The values of r1, r2, L and D are fixed at 25 nm, 50 nm, 2 µm and 20 nm, respectively. We employed a spacing of 2 nm for all nanocubes sizes. It must be mentioned that we considered TiO2 NPs with density of 40 particles/µm which deposited over the surface of CuO nanotubes randomly.
Figure 7. Schematic view of simulated CNTN. The values of the inner and outer radius of CuO nanotube are r1 = 25 nm and r2= 50 nm. Moreover, the length of nanotube and diameter of TiO2 nanoparticles are fixed at L = 2 µm and D = 20 nm.
The results of calculated absorption, scattering and extinction cross sections of the CNTNs are also shown in . There is a broad peak for scattering cross section at wavelength of 460 nm. Moreover, absorption cross section shows a maximum at wavelength of 300 nm. It is clear that the extinction cross section, which is the sum of both of them, shows a good agreement with experimental absorption data.
The samples were employed as catalysts for methyl orange (MO) photocatalytic oxidation degradation in aqueous suspension. shows the follow-up of the MO oxidation up to 2 h of reaction time under visible light (633 nm helium–neon laser, 2 mW). In general, the reaction rate decreases with colorant concentration, the concentration profile during the process was represented as an exponential function:[Citation19]
Figure 8. Follow-up of the methyl orange oxidation up to 2 h of reaction time under visible light (633 nm helium–neon laser).
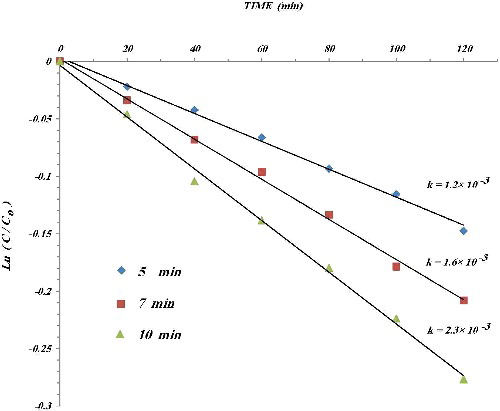
where the kinetic constants (k) were obtained by linear regression. The values of k are presented in . This value increases from 1.2 to 2.3 × 10⁻³ with the increase of the annealing time of CuO nanotube (5, 7 and 10 min at 300 oC). It should be mentioned that the value of k is almost constant for more annealing time of CuO nanotube.
The photocatalytic activity of a photocatalyst depends on various factors, including the crystal structure, crystallinity, morphology, specific surface area, light energy utilisation ratio, quantum efficiency, etc.[Citation20,Citation21] TiO2 is an n-type semiconductor, but both CuO and Cu2O are p-type semiconductors. Thus, at the interface between TiO2 crystallites and CuO crystallites, a p–n junction will be formed. It is well known that the nano-p–n junctions effectively reduce the recombination of electrons and holes, thus leading to the enhancement of the photocatalytic properties of the heterostructure composites. Details of how nano p–n junction increases the photocatalytic activity can be found in Ref. [Citation22].
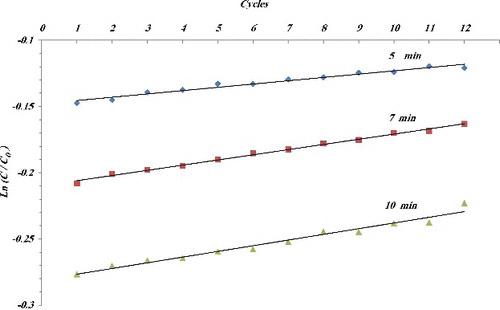
Another important real world consideration for photocatalytic systems is long-term stability. The CNTNs were employed to degrade MO solution for 2 h before the CNTNs were removed and regenerated (heated to 200 °C for 120 min) and the process was repeated (12 cycles in total). shows the variation of value of Ln(C/C0) at the end of 2 h versus the number of cycles for different annealing time. Samples displayed good stability with regards to photocatalytic performance, with less than 20% decrease from its initial activity during the photodegradation process.
Figure 9. Variation of value of Ln(C/C0) at end of 2 h irradiation of 633 nm helium–neon laser versus number of cycles for different annealing time.
4. Conclusion
In summary, we have fabricated one-dimensional CuO nanotubes by deposition of copper over cellulose fibres and heating them at 300 oC. Moreover, we studied the influence of incorporation of TiO2 NPs over copper oxide nanotubes on optical properties of them. The optical properties have been measured from the absorption spectra and calculated by DDA. The scattering cross section of the CNTNs shows a broad peak about 460 nm. In addition, optical properties indicated that TiO2 presents an energy band gap of 3.2 eV and the CuO presents the band gap of about 1.8 eV. The XRD pattern of the CNTNs clearly points to the polycrystalline nature of CuO nanotubes and the anatase phase of TiO2 NPs. The samples were employed as catalysts for MO photocatalytic oxidation in aqueous suspension. The photo-catalytic activity of samples increase by annealing time of CuO nanotube. It is due to increasing of thickness of the oxide shell which leads to better formation of nano-p–n junctions at the interface between TiO2 crystallites and CuO crystallites.
Disclosure statement
No potential conflict of interest was reported by the author.
Additional information
Funding
References
- Liao CH, Huang CW, Wu JCS. Hydrogen production from semiconductor-based photocatalysis via water splitting. Catalysts. 2012;2:490–516.
- Li L, Yan J, Wang T, et al. Sub-10nm rutile titanium dioxide nanoparticles for efficient visible-light-driven photocatalytic hydrogen production. Nature Commun. 2015;6:5881–5882.
- Yang SG, Liu YZ, Sun C. Preparation of anatase TiO2/Ti nanotube-like electrodes and their high photoelectrocatalytic activity for the degradation of PCP in aqueous solution. Appl Catal A. 2006;301:284–291.
- Mor GK, Shankar K, Paulose M, et al. Use of highly-ordered TiO(2) nanotube arrays in dye-sensitized solar cells. Nano Lett. 2006;6:215–223.
- Zhan SH, Chen DR, Jiao XL, et al. Long TiO2 hollow fibers with mesoporous walls: sol−gel combined electrospun fabrication and photocatalytic properties. J. Phys Chem B. 2006;110:11199–11204.
- Peng TY, Hasegawa A, Qiu JR, et al. Fabrication of titania tubules with high surface area and well-developed mesostructural walls by surfactant-mediated templating method. Chem Mater. 2003;15:2011–2016.
- Shunli W, Hui X, Liuqin Q, et al. CTAB-assisted synthesis and photocatalytic property of CuO hollow microspheres. J. Solid State Chem. 2009;182:1088–1093.
- Sundaram GB, Ramasamy K. CuO nanoparticles: a simple, effective, ligand free, and reusable heterogeneous catalyst for N-arylation of benzimidazole. Ind Eng Chem Res. 2011;50:9594–9600.
- Zailei Z, Han C, Xilin S, et al. Synthesis of mesoporous copper oxide microspheres with different surface areas and their lithium storage properties. J Power Sources. 2012;217:336–344.
- Yao M, Tang Y, Zhang L, et al. Photocatalytic activity of CuO towards HER in catalyst from oxalic acid solution under simulated sunlight irradiation. Trans Nonferr Met Soc China. 2010;20:1944–1949.
- He J, Kunitake T, Watanabe T. Porous and nonporous Ag nanostructures fabricated using cellulose fiber as a template. Chem Commun. 2005;15:795–796.
- He YT, Wan JM, Tokunaga T. Kinetic stability of hematite nanoparticles: the effect of particle sizes. J Nanopart Res. 2008;10:321–332.
- Kum JM, Yoo SH, Ali G, et al. Photocatalytic hydrogen production over CuO and TiO2 nanoparticles mixture. Inter J Hydrogen Energy. 2013;38:13541–13546.
- Greenwood R, Kendall K. Selection of suitable dispersants for aqueous suspensions of zirconia and titania powders using acoustophoresis. J Eur Ceram Soc. 1999:19:479–488.
- Hanaor D, Michelazzi M, Leonelli C, et al. The effects of carboxylic acids on the aqueous dispersion and electrophoretic deposition of ZrO2. J Eur Ceram Soc. 2012;32:235–244.
- Draine BT, Goodman JJ. Beyond Clausius-Mossotti – wave propagation on a polarizable point lattice and the discrete dipole approximation. Astrophys J. 1993;405:685–697.
- Goodman JJ, Draine BT, Flatau PJ. Application of fast-Fourier-transform techniques to the discrete-dipole approximation. Opt Lett. 1991;16:1198–1200.
- Draine BT, Flatau PJ. Discrete-dipole approximation for scattering calculations. J Opt Soc Am A. 1994;11:1491–1499.
- Konstantinou IK, Albanis TA. TiO2-assisted photocatalytic degradation of azo dyes in aqueous solution: kinetic and mechanistic investigations: a review. Appl Catal B. 2004;49:1–14.
- Xu YH, Liu CJ, Chen MJ, et al. A review in visible-light-driven BiVo4 photocatalysts. Int J Nanoparticles. 2011;4:268–272.
- Zhang AP, Zhang ZJ. Hydrothermal processing for obtaining of BiVO4 nanoparticles. Mat Lett. 2009;63:1939–1942.
- Lin J, Shen J, Wang R, et al. Nano-p–n junctions on surface-coarsened TiO2 nanobelts with enhanced photocatalytic activity. J Mat Chem. 2011;21:5106–5113.