
ABSTRACT
The conventional X-ray diffraction (XRD) methods probe for the presence of long-range order towards a solution of the average crystal structure. Experimentally, structural information about long-range, periodic atomic ordering is reflected in the Bragg scattering while local atomic structural deviations from the average structure mainly affect the diffuse scattering intensities. In order to obtain structural information about both average and local atomic structures, a technique that takes in account both Bragg and diffuse scattering needs to be employed, such as the total scattering atomic pair distribution function (PDF) technique. This article introduces a PDF-based methodology that can be applied to extract precise structural information about nanoparticles such as the size of the crystalline core region, the degree of crystallinity, the atomic structure of the core region, local bonding, and the degree of the internal disorder, as a function of the nanoparticle diameter. This article sheds light on a new PDF-based methodology that can yield precise quantitative structural information about small nanocrystals from XRD data, and also describes the essential aspects of this proposed methodology as well as its great potential. This method is generally applicable to the characterisation of the nanoscale solid, many of which may exhibit complex disordered structure.
1. Introduction
In the world of structural science, the determination of the atomic structure at different sub-nanometer length scales is a prerequisite for understanding and engineering the material properties. The challenge of determining the atomic arrangements in nanoparticle structure, quantitatively and with high precision, remains one of the key problems in the field of nanoscience. This problem has been pointed out by Billinge et al. [Citation1] and referred to as ‘nanostructure problem’: the need to determine atomic arrangements in nanostructured materials, quantitatively and with high precision.[Citation2]
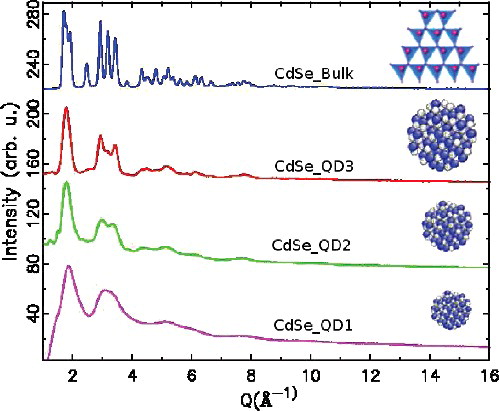
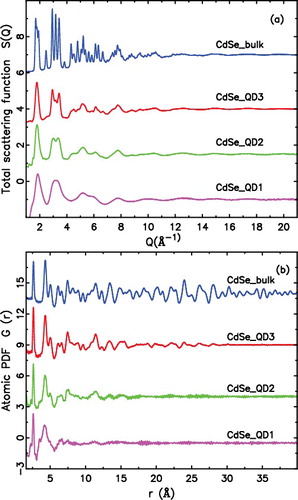
Nanostructured materials are subjected to different types of local structural defects, such as lattice strain, stacking faults, etc. Detailed knowledge of the nanoscale structure is important for understanding the fundamental mechanisms and processes in nanostructured materials. However, difficulties are experienced when standard methods are applied to small nanoparticles due to finite size effects.[Citation3,Citation4]. Therefore, the conventional crystallographic analysis breaks down, as periodicity is no longer presumed in the structure of small nanoparticles. This can be learned from the measured X-ray diffraction (XRD) data reported on CdSe semiconductor quantum dots (QDs), shown in . All of the diffraction patterns have peaks in similar positions reflecting the similarity of the basic structures, but as the nanoparticles get smaller, the diffraction features become broadened out due to some structural defects combined with finite size effects. [Citation5–8] These spoiled features are inconsistent with the basic assumptions of the conventional crystallographic analysis, due to lack of periodicity,[Citation9] especially when the nanoparticles get smaller. Therefore, it is important to apply methods that go beyond crystallography for quantitative determination of the nanoparticle structures, such as the total scattering atomic pair distribution function (PDF) technique.
Figure 1. Synchrotron XRD patterns of CdSe quantum dotes (QDs). From top to bottom CdSeBulk, CdSe_QD3, CdSe_QD2, and CdSe_QD1. Data were collected at RT at beamline 6-IDD of the Advanced Photon Source at Argonne National Laboratory.
The total scattering atomic PDF technique has been known for many years, as a useful local structure probe to study disordered materials and liquids.[Citation10,Citation11] The ideas behind the PDF methods can be traced back to work by Debye and Menke (1930), where they applied the methods to study liquid mercury.[Citation11] Significant early local structure study was done with the method, in the late 1930s, by E.B. Warren [Citation10,Citation12,Citation13] for whom the Warren award of the ACA (American Crystallographic Association) is named. In the late 1980s, as spallation neutron sources became available, the PDF methods have been applied to a quantitative local structural study of quasicrystalline [Citation14] and disorder in crystalline materials.[Citation15] More recently, the total scattering atomic PDF technique has also been applied to study nanostructured materials.[Citation7,Citation8,Citation16–20] The history of the total scattering atomic PDF methods (past and present) is briefly reviewed by S.J. Billinge, with some recent applications.[Citation21]
The PDF is a local structural technique that yields quantitative structural information at nanoscale from X-ray and neutron powder diffraction data.[Citation22,Citation23] Recent developments in both data collection [Citation24–27] and modelling [Citation28–32] make this a potentially powerful tool in quantitative structure determination of nanoparticles, as has been successfully demonstrated in some previous studies.[Citation6,Citation7,Citation33,Citation34] On the other hand, as small nanoparticles show a nonuniform structure, additional extensions to the modelling of nanoparticle structure may be needed to accommodate core/shell structure model.[Citation35,Citation36] This was noted recently on in a study by Palosz et al. [Citation36] where they reported the limitations and the perspectives of diffraction studies of the atomic structure of nanoparticles.
Attempts to characterise structural changes in small and ultrasmall nanoparticles, using direct or indirect measurements,[Citation1] were unsuccessful due to the poor contrast.[Citation37–39] However, with the use of the PDF methods, we were able to explore the local atomic structure of such small CdSe nanoparticles at different length scales. The PDF fits indicate that for the large CdSe QDs, the structure can be described in terms of locally distorted wurtzite structure containing certain stacking fault density, i.e. intermediate phase between wurtzite and zinc-blende (mixed-phase model). The poor fitting of the mixed-phase model to the ultrasmall CdSe QDs indicates that the structure of ultrasmall QDs is different from larger QDs. Recently, Masadeh et al. [Citation7] presented a detailed size-dependent nanostructural study, where they reported structural information from PDF analysis on (2–4 nm) CdSe nanoparticles. Yang et al. employed the introduced PDF-based methodology to investigate the atomic structure of the CdSe ultrasmall nanoparticles.[Citation40]
This methodology, as a nontraditional approach, has garnered considerable attention over the last few years as a powerful tool developed for quantitative nanostructure determination. It can be applied to a size-dependent nanostructural study on series of nanoparticles and provides quantitative structural information at different length scales, even for the ultrasmall sizes. This obtained information is not available from some alternative conventional nano-techniques such as TEM.[Citation39]
Using this methodology, Yang et al. [Citation40] detected ‘considerably enhanced compressive homogeneous strain and increased inhomogeneous strain in the bond-length distribution’ of the first PDF peak, the latter reflecting the observed disorder of the ultrasmall nanoparticles.[Citation40] This method is generally applicable to the characterisation of the nanostructured materials, many of which may exhibit complex structure. The purpose of this article is to introduce to the material science community a new nontraditional approach that opens up the horizon for new possibilities by going beyond traditional XRD methods.[Citation41,Citation42] This article also discusses some experimental aspects related to this methodology as well as its great potential.
For a purpose of demonstration, three different CdSe nanoparticles (also refer to as QDs) that exhibit different optical spectra have been studied in this article to present the capability of the PDF methods and systematically examine the sensitivity of the PDF data to subtle structural features modifications in nanoparticles relative to bulk.
2. Experimental details
In this section, we are going to discuss some experimental aspects related to the introduced methodology, as a real-space nanostructure probe. The requirements for this PDF experiment starts from having nanoparticle sample cleaned from excess organic surfactant compounds. For the purpose of this study series of CdSe semiconductor, QDs are reported. The samples were further purified by dissolving and centrifuging in methanol to remove excess organic surfactant hydrophobic trioctylphosphine oxide (TOPO). This process not only purified the particles but also resulted in a narrower particle size distribution.[Citation43] The transmission electron micrograph (TEM) images () show uniformly sized nanoparticles with no signs of aggregation.
Figure 2. The ultraviolet visible (UV-vis) absorption spectra and TEM image of CdSe nanoparticles: (a) CdSe_QD3 and (b) CdSe_QD2 (right). The line-bar is 20 nm in size in both TEM images.
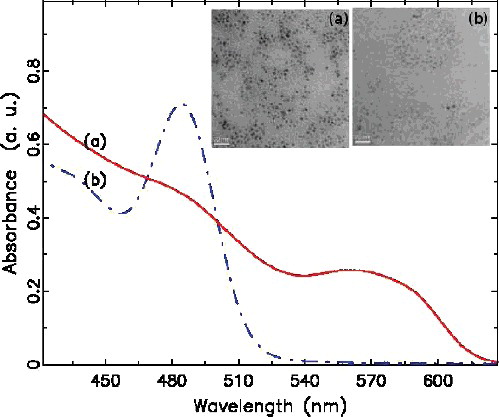
Three semiconductor CdSe nanoparticles, also known as QDs, with different sizes ranging (∼1.5–∼3.6) nm, CdSe_QD3 (large), CdSe_QD2 (small) and CdSe_QD1 (ultrasmall), are used for this study, as well as a bulk CdSe sample for reference. The numbers in the sample name are referring to the associated size regime (in nm) of the studied QDs ( i.e. 3, 2, and 1 nm size regimes). The samples CdSe_QD3, CdSe_QD2 are prepared according to the method reported by Peng et al. [Citation43], while the ultra small sample CdSe_QD1 is prepared according to the method reported by Bowers et al. [Citation38]. The ultraviolet-visible (UV-vis) absorption spectra of the aliquots were recorded by redissolving the nanocrystals in toluene. The spectra for QD3 and QD2 samples are shown in , and the ultrasmall sample QD1 has 417 nm centre-band-edge absorption wavelength as reported by Yang et al. [Citation40] (see Ref. [Citation40], ).
2.1. Important aspects of PDF experimental set-up
The employed tool in the used methodology is the total scattering atomic PDF methods. The aim of this section is to shed some light on the experimental setup of the PDF methods that have garnered considerable attention over the past few years, as a newly emerging nanostructure probe.[Citation7,Citation16,Citation44–48] The atomic PDF analysis of X-ray powder diffraction data has proven to be a powerful tool for studying the structure of nanocrystalline materials.[Citation22,Citation23,Citation49–51] Recently, it has been explicitly applied to study the average and local structure of discrete nanoparticles.[Citation6,Citation7,Citation16,Citation18,Citation33,Citation40,Citation44–48,Citation52,Citation53] The PDF method can yield precise structural and size information, provided that special attention is paid to the measurement and to the method used for analyzing the data.
The PDF methods required high-quality diffraction data that possess good statistics and sufficient wide momentum transfer range. Such measurements, with wide momentum transfer range, may be obtained using hard X-rays from synchrotron sources. The use of a 2D IP detector coupled with high energy X-rays radiation, known as the rapid acquisition PDF (RAPDF) method, can be employed to obtain high-quality PDFs by taking multiple quick scans.[Citation24,Citation25] The RAPDF method has been reported as new powerful development, where a few seconds or minutes are needed to get sufficient statistics and gives high-quality reliable PDFs. The usage of image plate (IP) area detector expedites data collection without compromising the measured reciprocal space range. This development opens a new playground for the PDF community to perform parametric PDF-studies, and time-resolved measurements.[Citation54,Citation55]
The use of 2D area detector for X-ray PDF analysis of nanostructured materials is subject to careful scrutinies imposed by the used experimental set-up. One major concern is the lack of energy resolution intrinsic to the 2D area detector. Another critical aspect is an insufficient spatial resolution in the RAPDF measurements comparing to the conventional PDF methods, as shown in . The experimental effects on the quality of the RAPDF data have been discussed in a recent study was done by Masadeh et al. [Citation27]. For nanostructure PDF study, more attention needs to be paid for PDF experimental setup that utilises the advantage of an IP detector. An essential experimental aspect for PDF structural studies on nanoparticle systems is a sufficient reciprocal space resolution. A poor resolution in the XRD pattern, as shown in (a), causes a loss of information in the higher r region of the corresponding atomic PDF as a falloff in the intensity of structural features with increasing radial distance-r, as shown in (b). For PDF structural studies on small nanoparticles, the finite particle size is evident in a falloff in the PDF intensity with increasing-r. In such case, it is difficult to separate out the two effects as both influencing the PDF intensity, at higher r region, in the same manner. Hence, in the case of poor reciprocal space resolution (as in RAPDF experimental setup), it is misleading to attribute the falloff in the intensity and lose of information in the higher r region, to the finite particle size or short structural coherence length.
Figure 3. (a) The experimental XRD patterns for CdSe bulk collected with a point detector (gray) and a mar345 Image Plate detector (black) while keeping the same experimental set-up, and (b) the corresponding PDF, G(r), obtained by Fourier transformation of the data in (a) with the same Qmax value (30.0 Å−1). This Figure illustrates the effect of the reciprocal space resolution in suppressing PDF intensity at high-r.
To illustrate the effects of reciprocal space resolution on PDF intensity, XRD data of CdSe bulk (powder) were collected using two different types of X-ray detectors, point detector, and mar345 IP detector. The XRD patterns are shown in (a). As can be seen from (a), a poor reciprocal space resolution (as in the case of the XRD data collected with an IP detector) can lead to an extra broadening of the peaks in the XRD pattern, and hence to a loss of information in the higher-r region of the corresponding atomic PDF pattern, as evident in (b). In many cases, having a good reciprocal space resolution is significant for PDF refinements over wider r-ranges, such as in a case of small nanoparticles PDF study.
As can be seen from (b), the PDF signal dies out above 55 Å radial distances due to a poor reciprocal space resolution. Therefore, the IP experimental set-up used to collect the data in is not suitable for studying nanoparticle with sizes bigger than 5.0 nm. Because, for such sizes, the PDF intensity dies faster due to a poor reciprocal space resolution, and the obtained PDF data will not reflect a proper structural information about the coherence length (or the size of the core region) or the distortion level present in the studied nanoparticle (or the size of the distorted shell region).[Citation6].
The treatment of the background signals (extracting the unwanted signal) such as air scattering, the sample container or holder, fluorescence intensity, Compton scattering intensity, the background, etc., should all be minimised since atomic PDFs are based on only the elastic component of XRD patterns [Citation22,Citation23,Citation27] It is worth mentioning that, in the case of the demonstrated PDFs data of CdSe QDs, it was challenging to subtract the unwanted signal coming from the organic surfactants. So that, it is important to have the samples purified by dissolving and centrifuging in methanol to remove excess organic surfactant hydrophobic TOPO. This process allows reducing the background signal coming from the used surfactant. In any case, it is highly recommended to measure the scattering signal from such surfactants (for example TOPO) independently, as an extra data-set and get it carefully subtracted as a scaled background during the data reduction procedure.
2.2. Total scattering atomic PDF experiments
The total scattering PDF analysis can provide accurate quantitative structural information, given that special care is applied to the data measurement and analysis. Total scattering refers to the fact that PDF methods take into consideration both Bragg and diffuse components, over sufficient range of reciprocal space-Q, during data reduction. The atomic PDF, G(r), is defined as(1) where ρ(r) is the atomic pair-density, ρ0 is the average atomic number density and r is the radial distance.[Citation9] The PDF gives the probability of finding pairs of atoms separated by a distance r. It is obtained by a sine Fourier transformation of the reciprocal space total scattering structure function S(Q), according to
(2) where S(Q) is obtained from a diffraction experiment. This approach is widely used for studying liquids, amorphous and crystalline materials, but has recently also been successfully applied to nanocrystalline materials.[Citation23]
To obtain the experimental total scattering atomic PDF, high energy X-ray powder diffraction experiments are usually performed at state-of-the-art synchrotron facilities such as the Advanced Photon Source (APS) at Argonne National Laboratory (ANL) in Chicago IL, USA. The data presented in this work were collected at the 6IDD beamline at the APS. The diffraction data were collected using the recently developed rapid acquisition PDF (RAPDF) technique [Citation24] that benefits from 2D data collection. The powder samples were packed in kapton capillary tube with diameter of 2.0 mm. Data were collected at room temperature with an X-ray energy of 87.005 keV (λ = 0.14248 Å). An IP detector (Mar345) with a diameter of 345 mm was mounted orthogonally to the beam path with a sample to detector distance of 208.857 mm, as calibrated by using silicon standard sample.[Citation24] Examples of the raw 2D data are shown in .
Figure 4. Two dimensional XRD raw data collected using image plate detector from (a) CdSe bulk, (b) CdSe_QD3, (c) CdSe_QD2, and (d) CdSe_QD1 nanoparticles samples.
The data reduction was done according to the standard methods.[Citation22,Citation27]. These data were integrated and converted to intensity versus 2θ using the software Fit2D,[Citation56] where 2θ is the angle between the incident and scattered X-ray beam. The integrated data were normalised by the average monitor counts. The data were corrected and normalised [Citation22] using the program PDFgetX2 [Citation57] to obtain the optimised total scattering structure function, S(Q), and the PDF, G(r), which are shown in (a,b), respectively.
In the Fourier transform, as a step to get from S(Q) to the corresponding PDF, G(r), the data are truncated at a finite maximum value of the momentum transfer (Q), called Qmax. In most cases, different values of Qmax may be considered. The Qmax value is optimised such as to avoid large termination effects (low Qmax value effects) and to reasonably minimise the introduced noise level as the signal to noise ratio decreases with Q value increases (high Qmax value effects). In the case of the presented CdSe PDF data, Figure (b), the Qmax value of 22.0 Å−1 was found to be optimal.
Figure 5. (a) The total scattering structure function, S(Q), of CdSe quantum dots (QDs) with different diameters and (b) the corresponding PDF, G(r), obtained by Fourier transformation of the data in (a) with with Qmax = 22.0 Å−1, from top to bottom: CdSeBulk, CdSe_QD3, CdSe_QD2 and CdSe_QD1. Data were collected at RT at beamline 6-IDD of the Advanced Photon Source at Argonne National Laboratory.
3. Results and discussion
3.1. Full-profile real-space refinement using the PDF methods
The methods of powder diffraction is a well-known established technique for structural and analytical studies of crystalline materials. An alternative way to obtain structural information is the PDF real-space refinement, which has been referred to in the literature as real-space-Rietveld refinement.[Citation58] The name raises out the similarity between PDF and conventional Rietveld refinements [Citation59] in terms of the possibility of refining crystal structural parameters such as unit cell parameters, site fractional coordinates, occupancy and thermal factors, based on a given crystal structure model that needs to be known approximately in advance.
In both methods, the difference between data points of the observed and the calculated profiles is minimised based on a least-squares refinement of selected parameters. The progress of the refinement is measured by ‘goodness of fit’ agreement factors, similar to the one defined in Equation Equation3(3) . However, the similarity does not go furthermore to include the used data. The Rietveld refinements use Bragg peaks and an arbitrary background function and the result will be the average structure model of the studied material. On the other hand, the PDF refinements are based on the total scattering intensity (Bragg and diffuse), and the analysis usually reveals information about the local, and intermediate range (on nano-length-scale), atomic structure directly in the real-space.
The Rietveld refinement has become one of the most suitable and proliferous methods that used for quantitative atomic structure analysis of crystalline materials based on X-ray powder diffraction methods. However, based on crystallographic assumptions, the applicability of such method to small nanoparticles is questionable and likely to be semi-quantitative at best. Palosz et al. [Citation60] have shown that the conventional tools developed for elaboration of powder diffraction data are not directly applicable to nanocrystals. [Citation60] The atomic PDF, G(r), is based on the total scattering experiment where both Bragg and diffuse scattering signals are utilised to obtain structural information at different atomic scales. Structural information can be extracted from the measured PDFs data using a full-profile real-space local structure refinement method,[Citation58] using the program PDFgui.[Citation28] Analogous to Rietveld refinement,[Citation59] starting from a given structure model and a given set of parameters, PDFgui [Citation28] tunes the refined structural parameters searching for the best structure model that is consistent with the experimental PDF, G(r), data. The residual function (Rw) is a factor used to quantify the agreement between the calculated PDF (Gcalc) from the refined model and the measured experimental PDF data (Gobs) as follow:(3) Here the weight ω(ri) is set to unity which is justified because in G(r), the statistical uncertainty on each point is approximately equal.[Citation61,Citation62]
For a given initial structure model, set of structural parameters can be refined such as unit cell parameters, anisotropic atomic displacement parameters (ADPs), site occupancy level and the fractional coordinate of allowed general positions, beside particle diameter parameter in case of nanoparticle PDF study. Also, set of non-structural parameters can be refined such correction for the finite instrumental resolution, (σQ), low-r correlated motion peak sharpening factor (δ),[Citation63,Citation64] and scale factor. In nanostructure PDF refinement, the finite instrumental resolution and particle diameter parameters are highly correlated,[Citation28] so in practice, it is highly recommended to choose which one to refine while fixing the other. In nanoparticle PDF experiment, the finite instrumental resolution, (σQ), can be measured for a given experimental PDF set-up by performing a quick refinement of a well-known crystalline reference sample, such silicon or nickel standard sample. Then, the resulted value of the (σQ) parameter can be used as an experimental (σQ) value associated with the used experimental set-up. Now, to avoid the correlation between (σQ) and particle diameter parameters, this obtained value of (σQ) need be fixed during the PDF refinement procedure for nanoparticle PDF studies that use the same experimental PDF set-up.
3.2. Nanoparticle structure: extracting quantitative structural information
The total scattering structure functions, S(Q), for the bulk and nanocrystalline samples, are shown plotted over a wide range of momentum transferred Q values and show significant intensity, as shown in (a). All of the diffraction patterns have major peaks (at low Q values) in similar positions reflecting the similarity of the basic atomic structure on average, but as the nanoparticles get smaller the XRD diffraction features become broadened out due to finite size effects and the loss of the long-range order features. This indicates that the degree of crystallinity in CdSe nanoparticles is getting lower as size decreases.[Citation5]
In the PDF analysis, information about the internal local structure of the nanoparticle is reflected from the PDF features at the low-r region. The total scattering atomic PDFs are shown in (b). The nanoparticle PDFs have almost the same sharp features as in the bulk in the region below 6.0 Å, indicating that the basic building block of the CdSe structure (tetrahedral) is still preserved in the studied structure, and a certain degree of crystallinity is still maintained, even in the ultrasmall nanoparticle (CdSe_QD1). In PDF real-space pattern, the finite size effects do not broaden out the structural features but appears as an evident in a falloff in the intensity of structural features with increasing the radial distance-r. This falloff features in the PDF intensity is usually used to extract the average size (diameter) of studied nanoparticles.
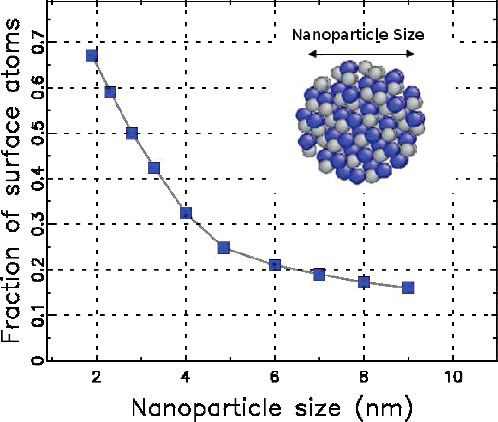
In the small nanoparticles, it is known that the proportion of atoms on the surface is significant – comparing to the core atoms – and therefore, the largest changes in atomic structure are expected in such small sizes. In Figure , the fraction of atoms involved in the surface region was estimated as a function of nanoparticle size. This curve was established by taking different spherical cuts from bulk wurtzite structure, then counting the atom with coordination number 4 as core atom and the one with less than 4 as a surface atom. Because a small fraction of atoms is involved in the core region comparing to the surface, it is challenging to apply the conventional XRD methods to study the atomic structure of such nanoparticle as their size decreases.[Citation4]
Figure 6. Calculated surface-to-volume atom ratio for a spherical nanoparticles (cuts from bulk wurtzite structure) as a function of nanoparticles size, as described in the text.
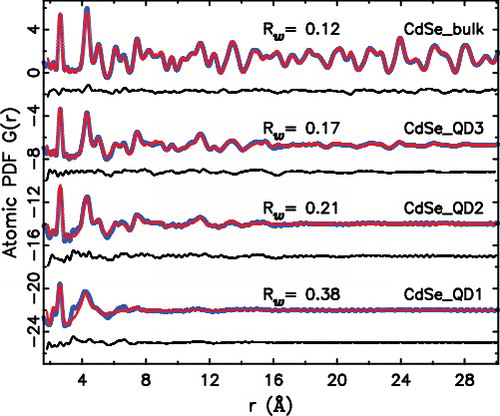
The PDF method is a three-dimensional (3D) real-space probe, that can be used to extract bulk structural information at different length scales. The ‘real-space’ PDF refinements are proving to be a very useful approach in analysing PDFs from nano-materials. Two structure models, wurtzite (space group P63mc) and zinc-blende (space group ), have been used to fit the PDF data of CdSe QDs, as shown in Figure . The PDF refinement results indicated that the CdSe_QD structures can be described as intermediate between two structures (mixed structure model), wurtzite and zinc-blende.[Citation7] The PDF method also has been applied to estimate the stacking fault density presents in such small QDs.[Citation7,Citation40] Yang et al. have described a ‘rapid approximate approach for extracting the stacking fault density by fitting wurtzite-zinc-blende two-phase models to the low-r region of the PDF data’. [Citation40]
Figure 7. (Colour online) The experimental PDF, G(r), with Qmax = 20.0 Å−1 (blue solid dots) and the calculated PDF from refined structural model (red solid line), with the difference curve offset below (black solid line).
The width of PDF peaks usually reveals information about the static and dynamic disorders of atoms involved in the pair. ‘Atomic disorder in the form of thermal and zero-point motion of atoms and any static displacements of atoms away from ideal lattice sites give rise to a distribution of atom-atom distances’.[Citation58] The width of this distribution appears as PDF peak broadening in form of Gaussian-shaped peaks. Using the PDF analysis, it was noticed that for the studied nanoparticles, there is a general increase in PDF peaks width as an enlargement in the extracted ADPs values. This has been assigned to structural distortions present in the nanoparticles as their size decreases.[Citation7] As reported by Masadeh el al. [Citation7], the values of the ADPs along the z-direction for Se atoms (U33) were found four times larger in the nanoparticles compared with the bulk, where they are already unphysically large. The unphysical enlargement in U33 value on the Se site is likely to be due to the presence of faults in the basal plane stacking.[Citation7] The quantitative results of the PDF refinement have been quite fully presented in earlier local structure study done by Masadeh el al. [Citation7], where they compared fits to the wurtzite and zinc-blend structure models and found that the wurtzite structure gives superior fits for all particle sizes, as evident from and in Ref. [Citation7].
The Rw value increases slightly in the nanoparticles comparing to the bulk, as shown in Figure , indicating a poorer fitting quality between the ideal and real nanoparticle PDFs. This is likely to have two contributions: First, disorder in the nanoparticles that cannot be reflected in an enlargement in ADPs, such as an increased stacking fault density. And second, the fact that the modeling procedure assumes a monodisperse distribution of spherical nanoparticles, and neglects surface bonding effects as we might expect surface atoms to be under coordinated, which would result in a decrease in the intensity of the PDF peak. In some cases, we might expect extra structural features that cant be reflected by the candidate structure model, as in the case of ultrasmall size (CdSe_DQ1 sample ). This could be due to real local structure modifications present in the nanoparticles, or contributions from the organic surfactant material (TOPO) that leftover after data reduction. Hence, the used PDF methodology is a suitable tool to detect the presence of extra structural features that might not be observed using other conventional techniques. In spite of these issues, the fits results of the mixed structure model are satisfactory.
3.3. Nanoparticle size from PDF analysis: the size of crystalline core region
The accurate nanoparticle size determination is an important step in nanostructure analysis since the physical proprieties of nanoparticles are size dependent. The measurement of the nanoparticle size can lead to significantly different results when performed by different methods, as there is no consensus to which is the most reliable.[Citation65,Citation66] For example, from conventional XRD method using Sherrer formula one can measure the coherent scattering domain size as crystallite size: the smallest monocrystal in the studied nanosystem. This approach can be hkl dependent and can be strongly affected by planar defects such as stacking faults, and the obtained size may (or may not) be similar to the particle size. On the other hand, it is ambiguous that a single diameter parameter is sufficient to fully describe even a spherical particle since the idea of distinct crystalline core and heavily disordered surface region have been postulated.[Citation3]
Therefore, it is necessary to apply complementary techniques to investigate the nanoparticle size as different techniques are more dependent on certain different aspects of the particle structure. There are some techniques sensitive to the particle/grain size, but not to the crystalline core size (structural coherence length). In other words, some techniques are blind to present of a heavily distorted (amorphous-like) surface layer in the nanoparticle. In the literature, more difficulties are experienced in accurate size determination as nanoparticle size decreases, due to poor contrast nearby the surface (shell-region) of the nanoparticle. For example, CdSe nanoparticles with a diameter about 2.0 nm have been considered – in the literature – to be an especially stable size regime with an associated band edge absorption centred at 414 nm.[Citation67] This size regime was observed earlier, with an estimated diameter of ≤2.0 nm,[Citation4] with some reported difficulties in determining the diameter of such ultrasmall nanoparticles.[Citation38,Citation68] Attempts to characterise the structure changes by TEM and conventional XRD approaches were unsuccessful due to the small nanoparticle size relative to the capping material.[Citation37] The same challenge has been reported by Bowers et al. [Citation38], where they studied the structure of the ultrasmall CdSe nanoparticle (≤1.5 nm) with an associated band edge absorption centred at 417 nm and refers to as magic-sized CdSe nanocrystals.[Citation38] The determination of the size of ultrasmall CdSe nanoparticle using tunnelling microscopy exposed to large margin error due to the very poor contrast.[Citation39]
Often local probes, such as high-resolution transmission electron microscopy (HRTEM) are used, but sometimes it is difficult to obtain accurate results on the average particle diameter or on the internal structure due to problems with sampling or poor contrast. The small-angle X-ray scattering (SAXS) analysis gives information about the shape and size of nanoparticles with good precision but contains no information about the atomic structure. The SAXS approach usually provides average diameter value close to the one obtained from ultraviolet-visible (UV-vis) absorption spectroscopy and HRTEM, as has been reported in early work by Gilbert et al. [Citation6]. Other common approaches that utilise quantum size effects, such as the position of the optical-absorption peaks, are prone to large systematic errors since they rely on effective-mass or tight-binding models (Ref. [Citation69], Figure 3). Although experimental and theoretical approaches agree reasonably well for large diameters, the simple theory outcome diverges from the experimental values for the small nanoparticles.[Citation4] Lippens et al. [Citation70] have reported that tight-binding calculations can yield better agreement for smaller sizes.
Applying the Scherrer formula to estimate nanoparticle diameter is based on the assumption of a perfect crystal limited in size. Small nanoparticles with finite size are often terminated by a variety of different hkl-planes and have a large fraction of their atoms on the nanoparticle surface which can have a high degree of disorder, which would affect the XRD peak-width. These features are inconsistent with the basic assumptions of the Scherrer formula. For that reason, the characteristic diameter of nanoparticles cannot be reliably estimated from the XRD peak-width-based analysis.
Recently, the PDF technique has been approved to be a powerful method for nanostructure characterisation and accurate determination of the nanoparticle crystalline core size. The PDF technique is sensitive to the average size of the crystalline core region (structural coherence length) but not to the crystal grain size as in some microscopy techniques. In the PDF methods, the nanoparticles assumed to have spherical-shape cuts from their bulk counterpart. The measured PDF of certain nanoparticles is compared to the ideal PDF of their bulk counterpart structure that has been attenuated by an envelope function (as a size effect) given by the PDF of a homogeneous sphere, as follows(4) where G(r) is given in Equation Equation1
(1) , and d is the diameter of the homogeneous sphere, and f(r, d) is a sphere envelope function explained in details by Kodama et al. [Citation8]
In the PDF analysis of nanoparticles, the finite reciprocal space resolution, and the finite particle size both have the same effect on the PDF pattern as a falloff in the PDF intensity. This makes the two parameters highly correlated during the PDF refinement. Hence, during the PDF analysis of nanoparticles, one has to make sure that the PDF intensity falloff due to the finite resolution is separated from the falloff due to the finite particle size. Therefore, as part of the PDF methodology, it is required to measure the finite reciprocal space resolution for the used experimental set-up (σQ) in advance. This can be done by measuring the PDF of a well crystalline bulk sample such as standard Ni (or bulk CdSe) and fitting it, using the program PDFgui, to its well-known atomic structure model. The obtained value of the finite resolution parameter (σQ or q-damping parameter) will then be used as a fixed-value parameter during nanoparticles PDF refinement fitting. This gives a sense of the PDF intensity falloff due to the finite resolution of the measurement, as shown in Figure . On the other hand, to measure the PDF intensity falloff due to the finite particle size, a refined PDF model is attenuated, during the full-profile PDF refinement, by the envelope function f (r, d) (Equation Equation4(4) ) which has one refined parameter assigned for the particle diameter d. This procedure is usually done for a fixed value of the finite resolution (σQ), while other structural and nonstructural parameters are free to refine. The results of the full-profile fitting to the PDF data are shown in and the obtained values of particle diameters from the PDF refinement are recorded in . The diameters extracted from the PDF data are in good agreement with the ones obtained from standard characterisation methods.
Table 1. CdSe nanoparticle size as determined using different methods.
In general, it is highly recommended in the RAPDF experimental set-up to collect PDF data for a standard bulk sample such as nickel powder (NIST standard) at an early stage of the experiment. This procedure is necessary in order to check the PDF data quality and to ensure that the structural parameters (such as lattice constant, and atomic displacement parameters) obtained from the PDF refinement of a standard sample are in good agreement with the literature. The precision in the Ni PDF refinement results confirms the accuracy of the obtained integration parameters from calibration step or procedure.
The total scattering atomic PDF technique is a 3D real-space probe, that gives the probability of finding a pair of atoms at a given interatomic distance r. The accuracy of determining the structural coherence length can be evaluated directly for a given experimental PDF, G(r), pattern. For example, in the case of amorphous bulk sample the PDF, G(r), intensity will vanish with the loss of structural coherence induced by the distortion level presents in the measured sample, Huang et .al used this feature to extract the domain structure size for amorphous systems.[Citation71] While in the case of nanoparticles, the structural coherence length (crystalline core size) is limited to the average crystallite size (or volume) of the individual nanoparticles; therefore, no peak in the G(r) is expected to be observed above the longest interatomic distance within the ordered region in the studied nanoparticles.
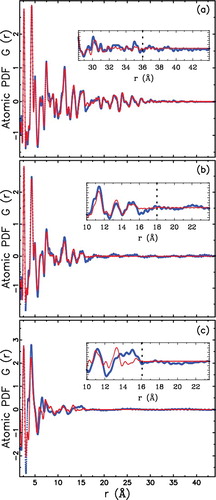
In the literature, the experimental PDF for polycrystalline bulk samples have shown distinctive structural features to high interatomic r distance, while that for their counterpart nanoparticles decay to zero much faster as size decreases, reflecting the substantially reduced length (or domain size) of structural coherence in such nanosystems.[Citation7,Citation72] In the case of CdSe nanoparticles, by visual inspection of the PDF data presented in , the crystalline core size was extracted directly by eyeballing the PDF, G(r), function where the ripples can be seen to die out due to the loss of the structural coherence in the studied nanoparticles. The value of the radial distance r where G(r) function starts approaching zero intensity can be assigned to be the structural coherence length or the crystalline core size of the nanoparticle. In , by direct observation we can put a lower limit on the particle diameters to be 3.6, 1.8 and 1.6 nm for CdSe_QD3, CdSe_QD2 and CdSe_QD1, respectively. The shown vertical dashed line in the inset of is used as a guide for the eyes to extract these numbers as a good estimate to the corresponding particle diameters. The extracted particle diameters are in good agreement with those reported in the literature.[Citation7,Citation43]
The nanoparticle size extracted directly from the PDF by eyeballing is very close to the one obtained from the PDF refinement, even down to a size below 2.0 nm. The results of the nanoparticle size are summarised in . In some cases, there is a significant difference between the nanoparticle size obtained from PDF (DPDF) and the one obtained from TEM (DTEM), as illustrated by Figure , since the PDF technique is sensitive to the average size of the atomic domains scattering X-ray coherently (crystalline core size) while the TEM is sensitive to the crystal grain size. The significant difference between the two sizes would be a good estimate for the size of the shell region. This has been observed in ZnS nanoparticles,[Citation6] for a diameter (as grain size) of 3.4 nm, where the heavily disordered surface region is about 40% of the nanoparticle size, the surface region thickness being around 1.4 nm.[Citation6] On the other hand, from the presented CdSe nanoparticle PDF study, the agreement between the crystalline core size extracted from PDF methods and the particle size obtained from the standard characterisation methods (), indicates that within our measurement uncertainties, there is no significant heavily disordered surface region in these nanoparticles, even for ultrasmall-diameter (). Thus, the proposed PDF methodology can provide a direct real-space observation to estimate the crystalline core diameter, as a lower limit for the nanoparticle diameter, and quantify the size of core/shell region, as has been demonstrated in earlier work by Gilbert et al. [Citation6]. Also, in other earlier work which was done by Pradhan et al., the experimental PDF for polycrystalline CdTe is seen to show ‘distinctive structural features to high interatomic r distances, while that for 5 nm CdTe particles decays to zero much faster, reflecting the substantially reduced length (or domain size) of structural coherence in the latter material’ [Citation48,Citation72] (see Ref. [Citation72], Figure 3).
Figure 8. Model of nanoparticle grains with a core-shell structure. This figure illustrates the difference between the nanoparticle size obtained from PDF (DPDF) and the one obtained from TEM (DTEM), since the former technique is sensitive to the average size of the atomic domains scattering X-ray coherently while the latter to the crystal grain size. The significant difference between the two sizes would be a good estimate for the size of the shell region.
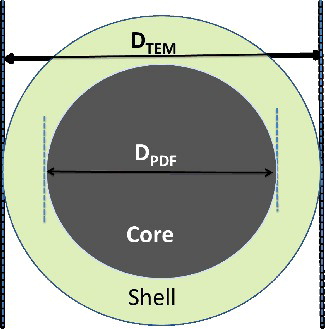
Figure 9. (Colour online) The experimental PDF, G(r), shown as blue solid dots. Sphere envelope function (Equation Equation4(4) ) is used to transform the calculated PDF of bulk CdSe, using wurtzite zinc-blende mixed structure model, to give a best fit replication of the PDF of CdSe nanoparticles (red solid line). The inset shows on an expanded scale for the high-r region of experimental G(r) on the top of simulated PDF data for different diameters of CdSe nanoparticles (red solid line). (a) CdSe_QD3, (b) CdSe_QD2, (c) CdSe_QD1. Dashed lines are guides for the eye.
It is worth mentioning that the PDF method is a suitable approach to investigate the presence of an amorphous region in the nanoparticle structure. Usually, the amorphous structure appears in the PDF pattern with sharp first neighbour peaks but rapidly diminishing and broadening higher neighbour peaks.[Citation73] Thus, in the presence of a surface amorphous region, we might expect to see extra intensity at the first-peak position when a proper initial model is scaled to fit the higher-r features coming just from the crystalline core.
This can be investigated experimentally by comparing the calculated and measured PDFs for extended proper radial distance r that goes beyond the nanoparticle diameter, as shown in Figure . The insets show the calculated and measured PDFs on an expanded scale. Features in the measured PDFs that correspond to the bulk structure are clearly seen disappearing smoothly, as attenuated by the spherical PDF envelope function f(r, d) Equation Equation4(4) , due to the finite size effect. From the presented CdSe nanoparticle PDFs data, one can notice that there is no clear evidence for a significant surface amorphous region presents in the studied nanoparticles as we still see sharp features in the PDF peak at low r region (). For the ultrasmall size, the features at high-r region are becoming broadened out, which limits the information content in the PDF analysis, and suggests the presence of a highly distorted crystal structure.
In this PDF study, we have not considered particle size distributions, which is assumed to be small in these materials based on the TEM data. The TEM data, Figure , confirm the size determined by PDF and show uniformly sized nanoparticles (approximately spherical) with no signs of aggregation. This also is justified by the good agreement between the PDF data and the calculated PDF of the bulk material that has been attenuated by envelope function f(r, d) (Equation Equation4(4) ), . Attempts were made to fit the PDF data with a log-normal size distribution. The fits aimed to profile the PDF data with a log-normal distribution of spherical nanoparticles. During the PDF refinements, allowing the average spherical nanoparticle diameter and log-normal width to vary resulted in non-convergent fits, which suggests that the nanoparticle sizes are not log-normal distributed. Therefore, there appears to be little evidence for a significant particle size distribution, as the best PDF fits results were achieved with assuming undistributed spherical particles.
3.4. Lattice strain in nanoparticles
The atomic structure of nanoparticles is subjected to different types of structural distortions relative to the corresponding bulk materials, as has been reported in this study. The XRD diffraction patterns of small and ultrasmall nanoparticles have been found markedly different from those of the larger nanoparticles and their bulk counterpart (see Ref. [Citation4], Figure 11). Previous studies of nanoparticle structure have demonstrated the sensitivity of the XRD pattern to the presence of local structure defects such as planar disorder and thermal effects and internal strain, due to nano-size effects.[Citation3,Citation4] The strain in nanosystems has been observed by different research teams, where alternative techniques are used to investigate the size-induced strain in nanostructured materials.[Citation6,Citation7,Citation40,Citation74–79]
The PDF methodology has been demonstrated in this article as a real-space tool, that can be used to extract information about lattice strains , homogeneous or inhomogeneous, present in nanoparticles. This approach is based on the first-PDF-peak analysis, in terms of position and width, where the local bonding of the basic building unit is investigated as a function of nanoparticle diameter. The width and position can be extracted by fitting Gaussian functions, without any per-knowledge about the adopted symmetry or atomic structure type.
To demonstrate this capability of the PDF methods, the local bonding of the tetrahedral Cd–Se building unit was explored as nanoparticle size decreases.[Citation7] In the PDF, G(r), of bulk CdSe sample, the first interatomic distance peak appears at r = 2.6353(3) Å is coming from covalently bonded Cd–Se atom pairs. The size-dependent position and the width of these peaks have been extracted by fitting a Gaussian, as mentioned earlier in the text, and the results are summarised in and illustrated in (a). These results of PDF-Gaussian-fitting reveal the following aspects: (1) The bond length of Cd-Se pairs (first neighbour) has been extracted as a function of nanoparticle size. The length found to be shortened as nanoparticle diameter decreases, indicating a presence of internal strain in the studied nanoparticles, and it is possible to quantify it using the PDF-methodology (a). This strain increases rapidly for the ultra-small nanoparticles (CdSe_QD1), about 2%, indicating that they have a significant compressive strain. The presence of an internal stress in the nanoparticles has been observed before by different studies,[Citation6,Citation74] as caused by competing relaxations from an irregular surface.
Figure 10. (Colour Online) (a) Gaussians fits to the first PDF peak. Experimental PDFs are blue dotted lines and the best fit Gaussians shown in red. From top to bottom: CdSeBulk, CdSe_QD3, CdSe_QD2, and CdSe_QD1. The vertical dotted line represents the first peak position of the bulk sample as a reference guides for the eyes. (b) Width of the first PDF peak vs. nanoparticle size. The horizontal dotted line indicates the width of the peak of the bulk sample, for comparison. (c) Homogeneous strain, (Dr/r)(%), as measured from the first PDF peak coming from the Cd-Se bond vs. nanoparticle size.
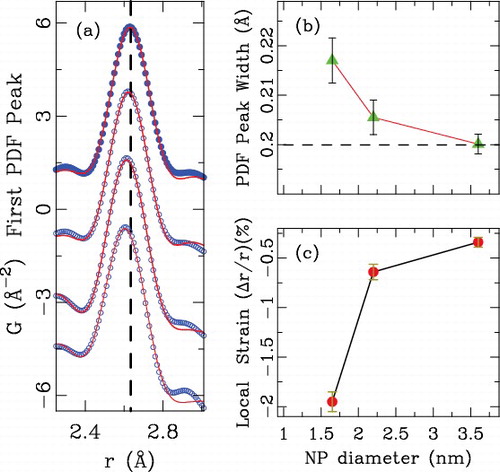
Table 2. The first PDF peak position (FPP) and width (FPW) for different CdSe nanoparticle sizes and the bulk.
(2) Exploring the position and width of the first PDF peak provides information about the homogeneous or inhomogeneous strain in the bond-length distribution. The widths of the first PDF peak have been extracted vs nanoparticle diameter from the Gaussian profile fits (). As the nanoparticle size decreases, the widths remain relatively sharp, comparing to the bulk, as shown in (b).
Interestingly, there is no size-dependent inhomogeneous strain measurable on the first peak for the large (CdSe_QD3) and small (CdSe_QD2) samples. However, peaks at higher-r region exhibit significant broadening (Figure (b)) indicating that there is some structural relaxations taking place as bond-bending distortions, as has been observed before in semiconductor alloys.[Citation80,Citation81] This homogeneous strain increases rapidly for the ultra-small (CdSe_QD1) nanoparticles revealing that they have a significant compressive strain. Comparable behaviour is also seen with increases in the PDF peak broadening with decreasing nanoparticle size indicating that the inhomogeneous strain, or width of the bond-length distribution in the nanoparticles, also increases. This is reflected in enlarged thermal factors that are refined in the nanoparticle samples and a poor fit in the case of the ultrasmall nanoparticles, as evident from the difference curves in Figure and the Rw values reported.
In the literature, many well-established techniques exist for studying nanocrystalline materials. Some are bulk average probes that are sensitive to local atomic structure such as the total scattering atomic PDF methods or extended X-ray absorption fine structure (EXAFS) analysis. Others are inherently local such as HRTEM and scanning electron microscopy (SEM). However, in many cases, the total scattering atomic PDF data may not contain enough information to constrain the nanostructure problem resulting in a unique nanostructure model. For this problem, a ’complex modelling’ approach was proposed (by Billinge and Levin in 2007) [Citation1] to incorporate extra information as input in the form of both theory and multiple experimental methods, such as from TEM, EXAFS, SAXS and Raman spectroscopy. There are some works being published towards the idea of complex modeling with attempts to add more understanding toward the real atomic structure of nanoparticles.[Citation30,Citation82]
4. Conclusion
The PDF methods have garnered considerable attention over the last few years as a powerful tool in nanostructure determination. A PDF-based methodology is demonstrated here as a key tool that can yield precise structural information about the nanoparticles such as the crystalline core size, the degree of crystallinity, local bonding and the degree of the internal strain, as a function of the nanoparticle diameter, without any knowledge about the adopted type and symmetry of atomic structure.
As nanostructure probe, the PDF technique is sensitive to the crystalline core size, but not to the grain size. Hence, the size obtained from PDF is not necessary the same as TEM one, and would be in most cases less or equal to the one from TEM. The significant difference between the two sizes would be a good estimate for the size of the shell region present in the studied nanoparticle. From the presented PDFs data, and within our measurement uncertainties, there is no clear evidence for a significant surface amorphous (or heavily disordered surface) region presents in the studied nanoparticles, even at the ultrasmall size of 1.5 nm.
Acknowledgements
We would like to acknowledge S. Billinge group for the support in obtaining and analysing the Synchrotron data. We would also like to acknowledge M. G. Kanatzidis and S. J. Rosenthal groups for providing the samples with the needed characterisations. Data were collected at the Advanced Photon Source (APS). Use of the APS is supported by the U.S. DOE, Office of Science, Office of Basic Energy Sciences, under Contract No. W-31-109-Eng-38. A. S. Masadeh would like to acknowledge the financial support from the University of Jordan at Amman.
Disclosure statement
No potential conflict of interest was reported by the author.
Additional information
Funding
References
- Billinge SJL, Levin I. The problem with determining atomic structure at the nanoscale. Science. 2007;316:561–565.
- Billinge SJL. The nanostructure problem. Physics. 2010;3:25. Available from: http://doi.org/10.1103/Physics.3.25.
- Bawendi MG, Kortan AR, Steigerwald ML, et al. X-ray structural characterization of larger CdSe semiconductor clusters. J Chem Phys. 1989;91:7282–7290.
- Murray CB, Norris DJ, Bawendi MG. Synthesis and characterization of nearly monodisperse CdE (E = S, Se,Te) semiconductor nanocrystallites. J Am Chem Soc. 1993;115:8706–8715.
- Guinier A. X-ray Diffraction in crystals, imperfect crystals, and amorphous bodies. San Francisco: W.H. Freeman; 1963.
- Gilbert B, Huang F, Zhang H, et al. Nanoparticles: Strained and stiff. Science. 2004;305:651–654.
- Masadeh AS, Boˇzin ES, Farrow CL, et al. Quantitative size-dependent structure and strain determination of CdSe nanoparticles using atomic pair distribution function analysis. Phys Rev B. 2007;76:115413.
- Kodama K, Iikubo S, Taguchi T, et al. Finite size effects of nanoparticles on the atomic pair distribution functions. Acta Crystallogr A. 2006;62:444–453.
- Warren BE. X-ray diffraction. New York (NY): Dover; 1990.
- Warren BE, Krutter H, Morningstar O. Fourier analysis of X-ray patterns of vitreous SiO2 and B2O3. J Am Ceram Soc. 1936;19:202–206.
- Debye P, Menke H. The determination of the inner structure of liquids by X-ray means. Physik Z. 1930;31:797–798.
- Tarasov LP, Warren BE. X-ray diffraction study of liquid sodium. J Chem Phys. 1936;4:236–238.
- Morgan J, Warren BE. X-Ray analysis of the structure of water. J Chem Phys. 1938;6:666–668.
- Kofalt DD, Nano S, K -M Wong, et al. Differential anomalous-x-ray-scattering study of icosahedral and amorphous Pd58.8U20.6Si20.6. Phys Rev Lett. 1986;57:114–117.
- Dmowski W, Toby BH, Egami T, et al. Short-range ordering due to displacements of thallium and oxygen atoms in superconducting Tl2Ba2CaCu2O8 observed by pulsed-neutron scattering. Phys Rev Lett. 1988;61:2608.
- Juhás P, Cherba DM, Duxbury PM, et al. Ab initio determination of solid-state nanostructure. Nature. 2006;440:655–658.
- Petkov V, Gateshki M, Niederberger M, et al. Atomic-scale structure of nanocrystalline BaxSr1-xTiO3 (x = 1, 0.5, 0) by x-ray diffraction and the atomic pair distribution function technique. Chem Mater. 2006;18:814.
- Page K, Proffen T, Terrones H, et al. Direct observation of the structure of gold nanoparticles by total scattering powder neutron diffraction. Chem Phys Lett. 2004;393:385–388.
- Hargreaves R, Bowron DT, Edler K. Atomistic structure of a Micelle in solution determined by wide Q-range neutron diffraction. J Am Chem Soc. 2011;133:16524–16536.
- Terban MW, Johnson M, Di Michiel M, et al. Detection and characterization of nanoparticles in suspension at low concentrations using the x-ray total scattering pair distribution function technique Nanoscale. 2015;7:5480–5487.
- Billinge SJL. The atomic pair distribution function: past and present. Z. Kristallogr. 2004;219:117–121.
- Egami T, Billinge SJL. Underneath the Bragg peaks: structural analysis of complex materials. Oxford: Pergamon Press, Elsevier; 2003.
- Billinge SJL, Kanatzidis MG. Beyond crystallography: The study of disorder, nanocrystallinity and crystallographically challenged materials. Chem Commun. 2004;7:749–760.
- Chupas PJ, Qiu X, Hanson JC, et al. Rapid acquisition pair distribution function analysis (RA-PDF). J Appl Crystallogr. 2003;36:1342–1347.
- Chupas PJ, Chapman KW, Lee PL. Applications of an amorphous silicon-based area detector for high-resolution, high-sensitivity and fast time-resolved pair distribution function measurements. J Appl Crystallogr. 2007;40:463–470.
- Proffen T, Egami T, Billinge SJL, et al. Building a high resolution total scattering powder diffractometer – upgrade of NPD at MLNSC. Appl Phys A. 2002;74:s163–s165.
- Masadeh AS. Investigation of the experimental effects on the quality of the rapid acquisition pair distribution function (RA-PDF) data. Jordan J Phys. 2011;4:79–86.
- Farrow CL, Juhás P, Liu J, et al. PDFfit2 and PDFgui: Computer programs for studying nanostructure in crystals. J Phys Condens Mat. 2007;19:335219.
- Juhás P, Davis T, Farrow CL, et al. PDFgetX3: A rapid and highly automatable program for processing powder diffraction data into total scattering pair distribution functions. J Appl Crystallogr. 2013;46:560–566.
- Juhás P, Farrow CL, Yang X, et al. Complex modeling: A strategy and software program for combining multiple information sources to solve ill-posed structure and nanostructure inverse problems. Acta Crystallogr A. 2015;71:562–568.
- Granlund L, Billinge SJL, Duxbury PM. Algorithm for systematic peak extraction from atomic pair distribution functions. Acta Crystallogr A. 2015;71:392–409.
- Yang X, Juhás P, Farrow C, et al. xPDFsuite: an end-to-end software solution for high throughput pair distribution function transformation, visualization and analysis. arXiv. (2015); 1402.3163. Available from: http://arxiv.org/abs/1402.3163.
- Neder RB, Korsunskiy VI. Structure of nanoparticles from powder diffraction data using the pair distribution function. J Phys: Condens Mat. 2005;17:S125–S134.
- Kumpf C, Neder RB, Niederdraenk F, et al. Structure determination of CdS and ZnS nanoparticles: Direct modeling of synchrotron-radiation diffraction data. J Chem Phys. 2005;123:224707.
- Palosz B, Grzanka E, Gierlotka S, et al. Analysis of short and long range atomic order in nanocrystalline diamonds with application of powder diffractometry. Z Kristallogr. 2002;217:497–509.
- Palosz B, Grzanka E, Gierlotka S, et al. Nanocrystals: Breaking limitations of data analysis. Z Kristallogr. 2010;225:588–598.
- Landes C, Braun M, Burda C, et al. Observation of large changes in the band gap absorption energy of small CdSe nanoparticles induced by the adsorption of a strong hole acceptor. Nano Lett. 2001;1:667–670.
- Bowers MJ, McBride JR, Rosenthal SJ. White-light emission from magic-sized cadmium selenide nanocrystals. J Am Chem Soc. 2005;127:15378–15379.
- McBride JR, Dukes III AD, Schreuder MA, et al. On ultrasmall nanocrystals. Chin Phys Lett. 2010;498:1, ISSN 0009-2614.
- Yang X, Masadeh AS, McBride JR, et al. Confirmation of disordered structure of ultrasmall CdSe nanoparticles from X-ray atomic pair distribution function analysis. Phys Chem Chem Phys. 2013;15:8480–8486.
- Billinge SJL. Atomic pair distribution function: A revolution in the characterization of nanostructured pharmaceuticals. Nanomedicine. 2015;10:2473–2475.
- Prill D, Juhás P, Schmidt MU, et al. Modeling pair distribution functions (PDF) of organic compounds: describing both intra- and intermolecular correlation functions in calculated PDFs. J Appl Crystallogr. 2015;48:171–178.
- Peng XG, Wickham J, Alivisatos AP. Kinetics of II-VI and III-V colloidal semiconductor nanocrystal growth: “Focusing” of size distributions. J Am Chem Soc. 1998;120:5343–5344.
- Howell RC, Proffen T, Conradson SD. Pair distribution function and structure factor of spherical particles. Phys Rev B. 2006;73:094107.
- Petkov V, Gateshki M, Choi J, et al. Structure of nanocrystalline GaN from x-ray diffraction, Rietveld and atomic pair distribution function analyses. J Mater Chem. 2005;15:4654.
- Gateshki M, Petkov V, Williams G, et al. Atomic scale structure of nanocrystalline ZrO2. Phys Rev B. 2005; 71:224107–9.
- Petkov V, Ohta T, Hou Y, et al. Atomic-scale structure of nanocrystals by high-energy X-ray diffraction and atomic pair distribution function analysis: Study of FexPd100−x (x = 0, 26, 28, 48) nanoparticles. J Phys Chem C. 2007;111:714–720.
- Pradhan SK, Deng ZT, Tang F, et al. Three-dimensional structure of CdX (X= Se,Te) nanocrystals by total x-ray diffraction. J Appl Phys. 2007;102:044304–6.
- Petkov V, Billinge SJL, Heising J, et al. Application of atomic pair distribution function analysis to materials with intrinsic disorder. Three-dimensional structure of exfoliated-restacked WS2: Not just a random turbostratic assembly of layers. J Am Chem Soc. 2000;122:11571–8.
- Petkov V, Trikalitis PN, Božin ES, et al. Structure of V2O5.nH2O xerogel solved by the atomic pair distribution function technique. J Am Chem Soc. 2002;124:10157.
- Petkov V, Zavalij PY, Lutta S, et al. Structure beyond Bragg: Study of V2O5 nanotubes. Phys Rev B. 2004;69:085410.
- Zhang HZ, Gilbert B, Huang F, et al. Water-driven structure transformation in nanoparticles at room temperature. Nature. 2003;424:1025–1029.
- Petkov V, Peng Y, Williams G, et al. Structure of gold nanoparticles in water by X-ray diffraction and computer simulations. Phys Rev B. 2005;72:195402.
- Chupas PJ, Chaudhuri S, Hanson JC, et al. Probing local and long-range structure simultaneously: an in-situ study of the high-temperature phase transition of AlF3. JAmChemSoc. 2004;126:4756–4757.
- Chupas PJ, Grey CP, Hanson JC, et al. In-situ time resolved powder diffraction studies in heterogenous catalysis; coupling the study of long range and local structural changes. Commission on Powder Diffraction Newsletter, International Union of Crystallography. 2003 Jun;(29):24–25.
- Hammersley AP, Svenson SO, Hanfland M, et al. Two-dimensional detector software: From real detector to idealised image or two-theta scan. High Pressure Res. 1996;14:235–248.
- Qiu X, Thompson JW, Billinge SJL. PDFgetX2: a GUI driven program to obtain the pair distribution function from X-ray powder diffraction data. J Appl Crystallogr. 2004;37:678. Available from: http://www.pa.msu.edu/cmp/billinge-group/programs/PDFgetX2.
- Billinge SJL. Real-space Rietveld: full profile structure refinement of the atomic pair distribution function. In: Billinge SJL, Thorpe MF, editors. Local Structure from Diffraction. New York: Plenum; 1998. p. 137–156.
- Rietveld HM. A profile refinement method for nuclear and magnetic structures. J Appl Crystallogr. 1969;2:65–71.
- Palosz B, Grzanka E, Gierlotka S, et al. Diffraction studies of nanocrystals: Theory and experiment. Acta Phys Pol A. 2002;102:57–82.
- Toby BH, Billinge SJL. Determination of standard uncertainties in fits to pair distribution functions. Acta Crystallogr A. 2004;60:315–317.
- Toby BH, Egami T. Accuracy of pair distribution function analysis applied to crystalline and noncrystalline materials. Acta Crystallogr A. 1992;48:336–346.
- Jeong I, Proffen T, Mohiuddin-Jacobs F, et al. Measuring correlated atomic motion using X-ray diffraction. J Phys Chem A. 1999;103:921–924.
- Jeong IK, Heffner RH, Graf MJ, et al. Lattice dynamics and correlated atomic motion from the atomic pair distribution function. Phys Rev B. 2003;67:104301–7.
- Wickham JN, Herhold AB, Alivisatos AP. Shape change as an indicator of mechanism in the high-pressure structural transformations of CdSe nanocrystals. Phys Rev Lett. 2000;84:4515–4516.
- Nanda J, Sapra S, Sarma DD, et al. Size-selected zinc sulfide nanocrystallites: Synthesis, structure, and optical studies. Chem Mater. 2000;12:1018–1024.
- Chen XB, Samia ACS, Lou YB, et al. Investigation of the crystallization process in 2 nm CdSe quantum dots. J Am Chem Soc. 2005;127:4372–4375.
- Qu L, Peng ZA, Peng X. Alternative routes toward high quality CdSe nanocrystals. Nano Lett. 2001;1:333–337.
- Lippens PE, Lannoo M. Optical-properties of II-VI-semiconductor nanocrystals. Semicond Sci Technol. 1991;6:A157–A160.
- Lippens PE, Lannoo M. Calculation of the band-gap for small CdS and ZnS crystallites. Phys Rev B. 1989;39:10935–10942.
- Huang J, Blakemore JD, Fazi D, et al. Domain structure for an amorphous iridium-oxide water-oxidation catalyst characterized by X-ray pair distribution function analysis. Phys Chem Chem Phys. 2014;16:1814–1819.
- Petkov V. Nanostructure by high energy X-ray diffraction. Mater Today. 2008;11:28–38.
- Terban MW, Cheung EY, Krolikowski P, et al. Recrystallization, phase composition, and local structure of amorphous lactose from the total scattering pair distribution function. Cryst Growth Des. 2016;16:210220.
- Marcus MA, Brus LE, Murray C, et al. EXAFS studies of Cd chalcogenide nanocrystals. Nanostruct Mater. 1992;1:323–1335.
- Chen CQ, Shi Y, Zhang YS, et al. Size dependence of Young's modulus in ZnO nanowires. Phys Rev Lett. 2006;96:075505.
- Ouyang G, Li XL, Tan X, et al. Size-induced strain and stiffness of nanocrystals. Appl Phys Lett. 2006;89:031904.
- Herron N, Calabrese JC, Farneth WE, et al. Crystal-structure and optical-properties of Cd32S14(Sc6H5)36DMF4, a cluster with a 15-angstrom CdS core. Science. 1993;25:1426–1428.
- Carter AC, Bouldin CE, Kemner KM, et al. Surface structure of cadmium selenide nanocrystallites. Phys Rev B. 1997;55:13822–13828.
- Chaure S, Chaure NB, Pandey RK. Self-assembled nanocrystalline CdSe thin films. Physica E. 2005;28:439–446.
- Petkov V, Jeong I, Chung JS, et al. High real-space resolution measurement of the local structure of Ga1−xInxAs using X-ray diffraction. Phys Rev Lett. 1999;83:4089–4092.
- Jeong I, Mohiuddin-Jacobs F, Petkov V, et al. Local structure study of InxGa1−xAs semiconductor alloys using high energy synchrotron X-ray diffraction. Phys Rev B. 2001;63:205202.
- Farrow CL, Shi C, Juh´as P, et al. Robust structure and morphology parameters for CdS nanoparticles by combining small angle X-ray scattering and atomic pair distribution function data in a complex modeling framework. J Appl Crystallogr. 2014;47:561–565.