
ABSTRACT
The present study examined the effect of nanoparticle size and geometry on filter cake buildup during dynamic filtration using experimental and modeling approaches. A dynamic filtration setup was proposed and designed to test cross-flow circulation against a synthetic core at a constant differential pressure. The proposed mathematical model considers the critical deposition boundary of the porous media for particles along with drag, lift, friction, buoyancy, permeate, and electrostatic forces. The comprehensive model response allowed investigation of the aggregation and shape of nanoparticles at different cross-flow inclinations. The drag and lift force coefficients and moment of inertia of the nanoparticles were determined using cluster structures of nanoparticles identified using dynamic light scattering (DLS) and fractal theory. The deposition and erosion intensity index of all solid particles were experimentally determined and used in the model. Electronic microscope images of the mud cake surface confirmed the proposed cluster structure of the aggregated particles. The mud cake thickness measured by dynamic filtration tests and the nanoparticle-bentonite weight ratio acquired by DLS showed good agreement with the mathematical model results. The proposed approach allows selection of the optimum shape and size of the nano-solid particles as additives to minimize mud cake buildup along the borehole.
1. Introduction
Accurate estimation of the filtration properties of drilling fluids, especially under dynamic conditions, is particularly important during drilling and completion operations. It can help engineers diagnose and prevent problems such as formation damage, tight borehole occurrence and differential sticking.[Citation1] The phenomena of static and dynamic filtration on filter cake growth have been the subject of much experimental investigation.[Citation2–6]
Hydraulic fracture of petroleum-bearing rocks and overbalance drilling of petroleum reservoirs usually cause cross-flow filtration which leads to filter cake buildup over the face of the porous media and pollution of the reservoir with filtrate.[Citation7] Cross-flow filtration is a pressure-driven process in which the filtrate, called permeate flow, is directed perpendicular to the feed flow in porous media. The extent of buildup on the borehole face depends on parameters such as size distribution of particles, pressure difference, inclination of the well and pore size.[Citation8] Drag force caused by permeate flux drives the suspended particles toward the cake. Particles larger than the formation pores are either retained on the formation face, initiating buildup of external filter cake, or entrained in the mud by mud circulation.
Fundamental research on the buildup of external filter cakes has been done in colloid science [Citation9–13] and membrane science [Citation14] where phenomenological models have been replaced by fundamental models incorporating force analysis. The rate of mud cake buildup is calculated as the difference between the rate of mud particle deposition by filtration and the rate of particle erosion caused by mud circulation.[Citation8] The shear forces exerted by the mud flow over the borehole surface governs the thickness of the filter cake.[Citation15]
The majority of dynamic modelling efforts have been limited to external filter cake stabilisation and assume that solid particles in spherical form are of equal size without aggregation of nanoparticles. These models do not consider the effect of well inclination as an important parameter in mud cake buildup along the borehole.
Recent research show that it may not be possible to successfully reduce fluid loss with micro- and macro-type fluid loss additives because their physiochemical and mechanical properties are not appropriate.[Citation16,Citation17] A shift from vertical to horizontal wells and extended reach drilling means that the conventional drilling and stimulation fluids perform poorly. This highlights the applications for nanomaterials in the development of nano-based fluid systems to overcome drilling and production problems.[Citation18]
Nanoparticles as particulate dispersions range from 1 to 100 nm in size, have a high surface-to-volume ratio and can provide superior drilling fluid properties at low concentrations.[Citation19,Citation20] These include enhanced rheological properties, use in high pressure high temperature (HPHT) form for ultra-deep drilling, excellent suspension stability, good lubricity, shale inhibition and high anti-pollution ability. They also perform as filtration control materials by fulfilling specific requirements by virtue of their size, hydrodynamic properties and interaction potential with the formation.[Citation19] The presence of nanoparticles can improve sealing at an earlier stage of filter cake formation and, subsequently, a thinner impermeable mud cake.
The present study prepared and analysed different types of nano-based drilling fluids using dynamic light scattering (DLS) technique to determine the particle-size distribution of solid additives and number of particles. Application of fractal theory and determining the fractal dimension of each additive helped identify the aggregated structure of the nanoparticles. A dynamic filtration set-up was designed and used to evaluate mud cake thickness for comparison with the mathematical model output. A cross-flow filtration cell was designed to allow alignment at different angles to simulate directional and horizontal wells. Glass beads mixed with epoxy resin were chosen as the synthetic core. The time-dependent critical deposition volume in front of the porous media is introduced to determine the likelihood of particle deposition during dynamic filtration. The hydrodynamic and electrostatic forces exerted on the particles were considered in the mathematical modelling as influenced by the cluster structure of nanoparticles. Model verification and its possible applications are also discussed.
2. Model development
The following assumptions are made when developing the mathematical model:
Particle movement followed the direction of fluid flow with tangential velocity (ut) and no displacement in the Y direction (excluding the synthetic core face).
The cross-flow circulation profile is fully developed with no velocity gradient in the Y direction (plug flow).
The porosity and permeability of the synthetic core and mud cake are constant.
The power law model is used to characterise the rheological behaviour of the drilling fluids.
Solid particles suspended in drilling fluid only deposit in the permeable zone.
Solid particles suspended in drilling fluids, especially at the nanoscale, exhibit a strong Van der Waals force and interact to form aggregated structures. Formation of these cluster structures changes the resulting agglomerated particle weight, moment of inertia and hydrodynamic parameters such as lift and drag coefficients. This has not been reported in the previous mud cake buildup models.
In the proposed model, the structure of the aggregated microparticles and nanoparticles suspended in the drilling fluid was obtained using DSL technique and calculation of the fractal dimension (df) of the cluster. This described the different forces and stresses exerted on the particles more accurately.
2.1. Calculation of weight of particles on cake surface
It is essential to monitor all forces exerted on the particles for analysis of real-time mud cake thickness within the permeable zone. The critical deposition boundary is a variable volume in that contains the only particles having the ability to deposit on the cake surface.
diagrams the forces exerted on a particle carried by the drilling fluid against the porous media and on a particle deposited on the cake surface.
Figure 1. Forces exerted on particles in drilling fluid and on the cake surface.
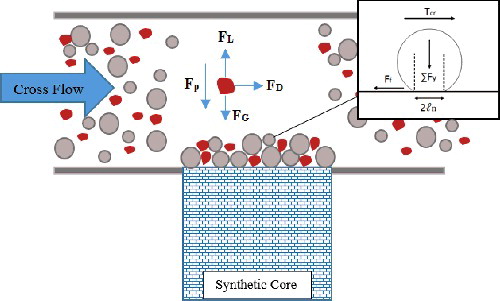
By computing the resultant instantaneous force exerted on the particles and incorporating the critical deposition boundary of the permeable zone, the weight of the particles deposited on the cake surface can be estimated for any given time. These forces are as follows:
Net gravity force, FG: This force results from the weight of the particle in air and the buoyancy force. The buoyancy force is proportional to the volume of liquid displaced, the gravitational acceleration and the density of the liquid and can be written as:(2.1) where Vp is the particle volume, g is the gravitational acceleration, ρp is the density of particle, ρf is the density of liquid and Ɵ is the inclination angle.
Drag force, FD: The resistance of a fluid to particle motion is called the drag force. When a permeable aggregated particle settles, part of the displaced liquid will move up from the open pores of the particle or the aggregate. Drag will then be exerted on a fraction of the total cross-sectional area occupied by the aggregated particle. The total drag force exerted on a porous particle will be lower than that on an impermeable sphere of the same diameter. The reduction in drag force is taken into account by the use of correction factor Ω, which is the ratio of resistance experienced by the permeable aggregated particle of diameter dagg to the resistance experienced by an impermeable particle of the same diameter. The drag force exerted on the aggregated solid particle in the drilling fluid using Stokes formula and the equation presented by Naele et al. [Citation21] takes the form:(2.2)
where Aagg is the area of aggregated particle perpendicular to the feed flow, Ut is the tangential velocity of the drilling fluid and CD is the drag coefficient. Correction factor Ω under creeping flow through porous aggregated particles as developed by Naele et al. [Citation21] is:(2.3) where β is the dimensionless permeability factor of porous aggregated particles and is related to the size and permeability of the aggregate:
(2.4) where dagg is the aggregated particle diameter and k is the permeability of clusters. The Carman–Kozeny equation can be used to estimate k; the porosity of non-homogeneous distribution of the fractal aggregated particles required to calculate k was estimated by Veerapaneni and Wiesner [Citation22] to be:
(2.5) where dp is the particle diameter, df, the fractal dimension, is always less than 3 and based on the study developed by Mandelbrot [Citation23] is defined as:
(2.6) where N is the number of particles aggregate to form cluster structure. The drag coefficient depends on the size and shape of the particle, fluid medium viscosity and density of the particle. This coefficient was presented by White [Citation24] for spherical particles, but experimental results show a higher CD for non-spherical particles. Numerous expressions for calculating CD for non-spherical particles are available.[Citation25–28] Chabra et al. [Citation29] used 1900 data points to determine that the correlation developed by Ganser [Citation26] gives the most accurate results; thus, this correlation was chosen to calculate CD for non-spherical particles and Rep K1 K2 < 105 as follows:
(2.7) where Rep is the particle Reynolds number and K1 and K2 are
(2.8)
(2.9)
In EquationEquation (2.8)(2.8) ,
is the projected area circle diameter normal to the flow direction and
is defined as equivalent sphere diameter with equal non-spherical volume.
Electrostatic force, FE: The total electrostatic force is a derivative of overall potential energy and is proportional to the radius of aggregated particles. Based on the DLVO (Derjaguin, Landau, Vervey, and Overbeek) theory,[Citation30] the total energy is the sum of the London van der Waals, double electric layer and born repulsion potential.(2.10)
The total electrostatic force can be obtained as,(2.11) where s is the surface-to-surface separation length, ELVA is the London Van der Waals potential energy, EDLR is the double electric layer potential energy and EBR is the Born repulsion potential energy. The reader can be referred to Khilar and Fogler [Citation31] and Israelachvili [Citation32] for more information about these potential energies.
EBR can be neglected compared to other potential energies for surface-to-surface distances greater than 1 nm. Therefore, the total electrostatic force can be concluded as follows:(2.12)
where H132 is Hamaker constant between the liquid phase as media and nano/micro particles, ɛ0 is the permittivity of free space (8.854 × 10⁻¹² c2J−1m−1), D is the dielectric constant (78.0 for water), ʎ is the inverse Debye length (1.35 × 10⁷ m−1 for water with very low salinity and normal temperature) and z is the zeta potential.
Lift force, FL: Life force could be estimated by Stokes formula using lift coefficient instead of drag coefficient. However, theoretical and empirical predictions for lift coefficient are very limited compared with the information available for drag coefficient.[Citation33] In addition, Mando and Rosendah [Citation34] emphasise that there is no generally acceptable correlation for lift coefficient. Consequently, we use Saffman [Citation35] corrected correlation in a shear flow condition as follows:(2.13)
Permeate force, Fp: The equation for estimating permeate force which is due to filtration in front of the permeable formation and exerted perpendicular to the flow direction is the same as drag force relation. However, filtration rate should be utilised instead of tangential fluid velocity.
Permeate force variation leads to particle acceleration in the direction of Y toward the permeable zone. This particle acceleration is the main factor in determining the possibility of particle deposition. A particle is assumed to be located at distance X from the beginning of porous media at time ti. The net vertical force, Fy, as illustrated in , is given below:(2.14) where mp is the mass of aggregated particle and ay is the acceleration of aggregated particle in Y direction. According to the model assumptions and the constant velocity in the X direction for the particle, the time elapsed for the particle to travel the length of the porous media, tx, is:
(2.15) where L is the length of synthetic core parallel to the cross-flow pattern.
The magnitude of the permeate force decreases after the transition time and external mud cake formation. As a result, the net vertical force exerted on the particle gradually decreases. This reduction in permeate force is mainly caused by mud cake formation. The gradual reduction in mud cake permeability over time eventually leads to vertical deceleration of the particle. In order to be deposited on the cake surface, the time elapsed for the particle to reach the cake surface should be less than the time elapsed for the particle to travel to the porous media. The maximum permissible vertical distance of the particle in a cross-flow pattern in which the particle has the possibility of deposition (Yc) is:(2.16)
As a result of the invasion and clogging of particles in the porous media and permeability alteration [Citation36], the critical deposition boundary of the permeable zone will be a function of time. shows changes in the critical deposition zone for cross-flow filtration.
Figure 2. Critical deposition zone in front of porous media and its reduction with the filtration time.
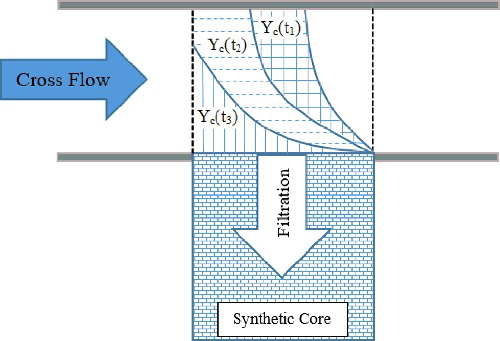
The space in the main flow in which particles can be deposited and create mud cake along the borehole (Vc) can be calculated as:(2.17) where W is the synthetic core width. By calculating and determining the possible deposition volume onto the porous media in ti and applying material balance, the weight of the micro- and nano-particles deposited on mud cake can be determined. It is important to note that strong molecular interaction between solid particles, particularly at nanometre scale, and successive particle collisions means some particles in Vc can precipitate onto the mud cake surface. A factor was defined and denoted as the deposition intensity index (Idep) with a value between 0 and 1. When Idep = 0, particles of any size inside Vc have no opportunity to deposit and create a mud cake. In this situation, the mud cake thickness will not grow over time and the solid particles will not play a role in mud cake formation. When Idep = 1, all solid particles in front of the porous media will be deposited during testing. This occurred during the static filtration test.
This coefficient must be determined experimentally and depends on the type of solid particle, drilling fluid properties, particle concentration, flow rate and total pressure of the dynamic system. Consequently, the weight of the particles deposited on the cake surface during ti will become Mdep(ti) and can be calculated as:(2.18)
2.2. Calculation of weight of particles eroded from mud cake surface
Under dynamic conditions, shear stress acting on the external mud cake surface will separate some of the deposited particles from the mud cake and return them to mud circulation. shows the forces exerted on a particle deposited onto the surface of the mud cake.
Particles erode and detach from the mud cake only when the shear stress exerted by the drilling fluid is greater than the critical shear stress (τcr) of the particle.[Citation10,Citation37,Citation38] The value for τcr is the minimum shear stress required to initiate detachment of particles from the surface of the mud cake. This parameter is a function of surface roughness and particle adhesiveness. Various methods have been proposed to calculate τcr.[Citation39,Citation40] The mathematical model presented in this article computes τcr using adhesion force analysis of the aggregated structure of the particles. The net vertical force exerted on the particle at the surface of the mud cake is:(2.19) Contact mechanics stipulate that two forces primarily act on the surface of the contacting body. The first force is frictional stress acting tangentially between the surfaces, and the second force is perpendicular to the contacting body surface and is caused by pressure and adhesion between the surfaces. Hertz theory forms the foundation of the equations for load-bearing when the two surfaces are in contact.
shows that the resultant permeate, electrostatic, gravitational and lifting forces deform the particle and create a tangential area on the interface of the particle and cake surface. Derjaguin et al. used Hertz theory to show that the radius of the contact area equals the normal lever (Ln).[Citation41] This finding has been used for colloidal particles attached to a solid surface.[Citation38,Citation42] The critical torque required to detach a particle from the surface of the mud cake consists of torque resulting from frictional and adherence forces presented as follows:(2.20) where normal lever is calculated as:
(2.21) where K′ is the composite Young's modulus and depends on the Poisson's ratio and Young's modulus of the cake and solid particle in contact with the mud cake. Using EquationEquation (2.20)
(2.20) and calculating the critical drag force required to displace the particle and incorporating EquationEquation (2.2)
(2.2) obtains the minimum drilling fluid velocity required for initiating particle movement on the cake surface as follows:
(2.22) Critical shear stress can be calculated by estimating Ucr and applying the power law model as the rheological model as shown in EquationEquation (2.23)
(2.23) :
(2.23) The linear momentum of the particle segregated from the mud cake has the following relation with angular momentum:
(2.24) The angular momentum of a system of particles has the following relationship with the vector summation of the angular momentum of individual particles deposited onto the mud cake surface during step time ti:
(2.25)
Consequently, we can write:(2.26) where Sp is the fraction of mud cake surface area occupied by a specific particle. The linear acceleration of the particle in the direction of the drilling fluid flow can be determined as:
(2.27)
By obtaining aL and determining particle displacement from the mud cake surface (∆X) at any time step, the weight of the eroded particle at the same time step can be calculated as:(2.28) where particle linear displacement is ∆X =
. Ier is the erosion intensity index of the particles. As for Idep, 0 ≤ Ier ≤ 1 indicates the erosion and opportunity for detachment of a particle from the mud cake during dynamic filtration. Using EquationEquations (2.18)
(2.18) and (Equation2.28
(2.28) ) and calculating the real-time specification of mud cake weight variation, ∆Mi(ti), mud cake buildup can be predicted as follows:
(2.29)
3. Materials and methods
The experimental set-up and methods are described in this section.
3.1. Experimental set-up and drilling fluid preparation
A dynamic filtration set-up with a filtration cell having the ability to vary the inclination angle was designed to simulate cross-flow in the annular section of directional and horizontal wells. The filtration cell was made of aluminium and had two input and two output flow paths. The first input flow path was connected to a dosing pump having an adjustable flow rate. The filtration pressure inside the cell was regulated to 100 psi using a back pressure valve. A synthetic core made of glass beads was placed inside the filtration cell. The average diameter of the beads was 600 µm. They were consolidated using epoxy resin and compacted and the synthetic core was placed in an oven for 24 h at 50 °C to dry. The core face was 2 × 5 with a length of 5.8 cm.
The synthetic core was saturated with fresh water to measure porosity and permeability. The permeability of the synthetic core was 4.9 D and its porosity was 27.6%. After insertion of the core into the filtration cell, it was sealed using an O-ring with adhesive sealant. Before initiating mud circulation, the core was saturated with distilled water as a continuous phase for the nano-based drilling fluid to prevent a chemical reaction and solid precipitation during testing which could affect the results. A cylindrical tank was connected to an air compressor at the top of the filtration cell for static filtration testing and deposition intensity index determination. is a general view of the test set-up is shown.
Figure 3. Designed cross-flow filtration and mud cake buildup simulator set-up. Filtration cell and O-ring along with sealant is depicted at the top right of the picture. At the bottom right of the picture, mud cake formed after circulation is illustrated; (a) Fresh drilling fluid mud cake, (b) MWCNTs fluid mud cake, (c) nano-SiO2 fluid mud cake and (d) nano CaCO3 fluid mud cake.
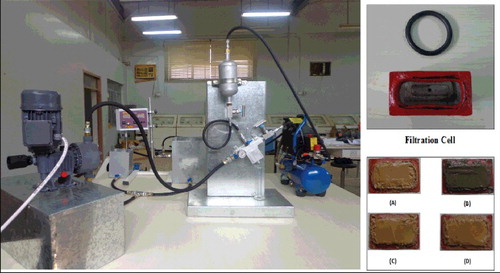
Drilling fluid samples composed of bentonite water-based mud (denoted as ‘fresh’ mud) with nanoparticles dispersed in an aqueous environment. To examine the effects of particle geometry on mud cake growth, the selected nanoparticles should have different shapes and average sizes. Nano-silicon oxide (SiO2) with spherical particles 20 nm in diameter, nano-calcium carbonate (CaCO3) with cubical particles 80 nm in average diameter and functionalised multi-walled carbon nanotubes (MWCNTs-COOH) that were cylindrical in shape, 15 nm in diameter and 1–2 µm in length were chosen.
The fresh mud used as reference drilling fluid was composed of 350 cc distilled water and 15 g bentonite mixed for 20 min before testing. The nano-based drilling fluid was composed of 350 cc distilled water, 15 g bentonite and 0.3 g nanoparticles (2% by weight of bentonite in mud) mixed for use as fresh mud before dynamic filtration. The rheological properties of the drilling fluids were measured using the power law model with a viscometer (Fann VG-35) as depicted in . During testing, the fluid in the mud tank was mixed continuously to prevent particle settlement and precipitation. lists the specifications of all drilling fluid samples.
Figure 4. Rheological properties of different drilling fluid samples based on power law model.
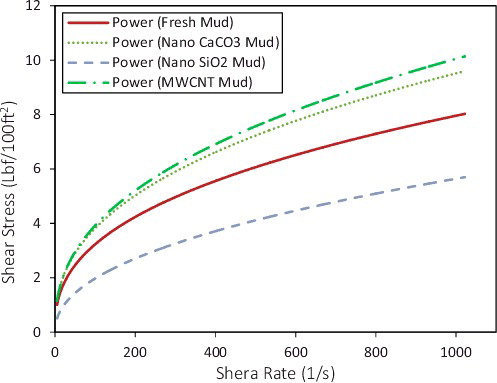
Table 1. Drilling fluid samples characteristics.
After mud preparation, the dynamic flow across the synthetic core was established at four cell inclines and 100 psi of differential pressure. The filtrate volume was recorded for 5 min; then the weight and thickness of the mud cake were measured and compared with the mathematical model predictions. After each test, the core was washed and the mud lines were flushed. Because similar dynamic conditions were created for drilling fluids with different rheological properties, the Reynolds numbers were the same for all fluid samples. also shows the fluid velocity of each drilling fluid.
3.2. Empirical parameters for laboratory tests
The zeta potential of each solid particle (ζ) was measured independently using a DLS device and are listed in along with the Hamaker constant needed to calculate electrostatic force. A low ζ value for nano-CaCO3 is indicative of the lack of stability in the aqueous phase. This problem is related to low quality and high porosity of the mud cake formed when CaCO3 drilling fluid was tested. The nano-CaCO3 mud cake porosity was about 36%, which was significantly greater than for MWCNTs and SiO2.
Table 2. Solid particles characteristics obtained by DLS and literature.
Increasing the zeta potential intensified the repulsive force between particles and caused effective solid dispersion, especially for the nanoparticles in the drilling fluid. This improved particle dispersion had a significant effect on the quality of the mud cake. It was necessary to quantify Idep and Ier for each particle. EquationEquations (2.18)(2.18) and (Equation2.28
(2.28) ) are representative of deposition and erosion of specific solid particles in drilling fluid during dynamic filtration. Civan [Citation4] stated that these coefficients depend on the drilling fluid and experimental conditions; thus, they must be directly measured experimentally by static filtration. For this purpose, an additional line consisting of an air compressor and a cylindrical vessel was included in the set-up and was connected to the filtration cell. To measure Idep, the cylindrical vessel was filled nearly completely with drilling fluid and 100 psi air pressure was imparted for 100 s. The net weight of the deposited bentonite was measured at the end of experiment. Idep was estimated for the bentonite by substituting the parameters into EquationEquation (2.18)
(2.18) . The magnitude of Vc under static conditions (Section 2.1) equals all the space in front of the porous media along cross-flow channel and equalled 18 cm3 for the experimental set-up dimensions.
To characterise Ier for bentonite, it was essential to run the test under dynamic conditions for another 100 s and record the total mud cake weight remaining at the end of the experiment. Substituting the parameters into EquationEquation (2.28)(2.28) obtained the erosion intensity index for bentonite. This was repeated for three nano-based drilling fluids and the known values for Idep and Ier for bentonite were used to measure the nanoparticles. lists the information used to acquire Idep and Ier for the different particles used.
Table 3. Deposition and erosion intensity indexes measured for solid particles.
3.3. Particle size and structure of aggregated particles
Under low-to-moderate shear rates, particles with a few hundred nanometres in size experienced restructuring rather than fragmentation.[Citation43] This phenomenon is a major reason for the use of fractal theory to describe particles in the drilling fluid and mud cake formation. The most common structure of aggregated particles is the fractal or self-repeating pattern that creates cluster structures. EquationEquation (2.6)(2.6) was used to obtain fractal dimensions that represent the type and spatial structure of accumulated particles. It is essential to implement detailed DLS analysis to determine the average particle size of solids in the drilling fluid.
After average particle size determination considering the individual size and structure of single nanoparticles, the aggregated particle structure was fed into the mathematical model. shows DLS particle size distribution analysis for the four drilling fluid samples.
Figure 5. Particle size distribution of drilling fluid samples measured by DLS technique.
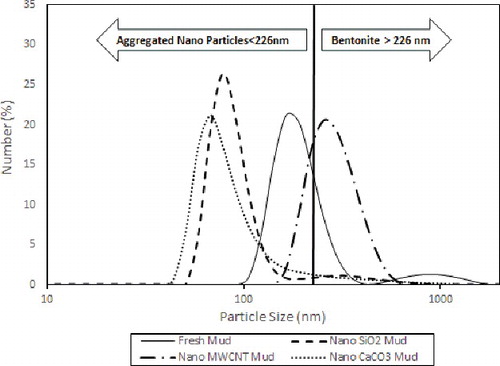
The average particle size of the dispersed bentonite was 226 nm for fresh mud. As a benchmark, it was assumed that particles larger than 226 nm were bentonite and particles smaller than 226 nm were aggregated nanoparticles in cluster structures. shows the proposed cluster structures of aggregated nanoparticles in drilling fluid based on this assumption. lists values for fractal dimension df for the nanoparticles.
Figure 6. Aggregated structure of nanoparticles in drilling fluids proposed by fractal dimension analysis.
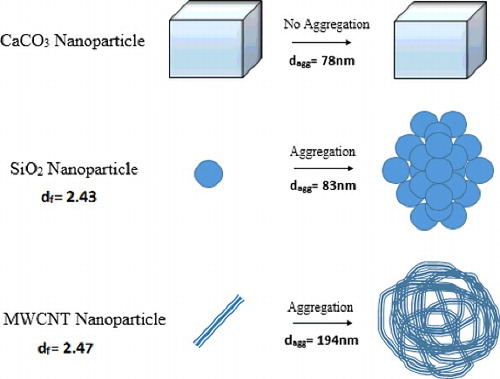
Applying fractal theory, restructuring the particles and forming a permeable aggregated structure instead of a single particle required a correction of the hydrodynamic force parameters. This approach led to better mud cake thickness characterisation and provided more accurate modelling.
4. Results and discussion
To compare the results obtained by the mud cake buildup model with experimental data, four dynamic circulation tests lasting 25 min were carried out for each sample (having equal Reynolds numbers) at each inclination (0°, 30°, 60° and 90°). The mud cake formed was analysed at the end of each experiment and the net and dry weights were recorded to calculate the mud cake porosity. shows the scanning electronic microscopy (SEM) images of the mud cakes formed after dynamic filtration testing for each nano-based drilling fluid.
Figure 7. FESEM images taken from mud cake after dynamic filtration test. (a) fresh mud cake with bentonite particles, (b) nano-SiO2 mud cake, (c) nano-CaCO3 mud cake and (d) MWCNTs mud cake.
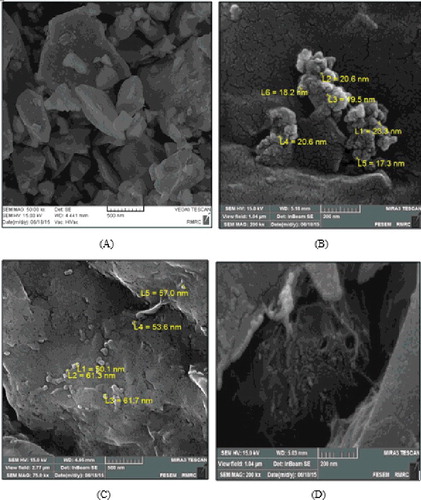
The first image ((a)) shows that the bentonite particles settled as mud cake. The aggregated nano-SiO2 particles in the nano-SiO2 drilling fluid fell between the bentonite plates, as is clearly visible in (b). (c) and the DLS data indicate that nano-CaCO3 particles acted like single particles and no aggregation occurred. The spherical shape and woollen structure of the aggregated MWCNTs between the bentonite layers can be observed in (d). A comparison of with reveals that the SEM images resemble the predicted structures of the aggregated nanoparticles.
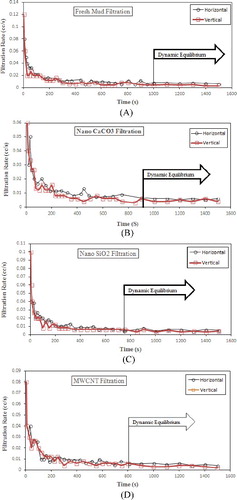
Nanoparticles play an important role in reducing filtration loss. Proper targeting of nanoparticles into the small pores in the bentonite particles sealed the mud cake and decreased the filtration volume significantly. Initiating fluid circulation and formation of the external and internal mud cake and increasing fluid flow resistance toward the formation decreased the filtration rate until it reached a constant dynamic equilibrium. The same response is observed for different inclination angles. depicts the decrease in the filtration rate versus time for each drilling fluid sample for a cell aligned horizontally and vertically. The time elapsed to reach dynamic equilibrium is shown in for each drilling fluid after stabilising the filtration rate.
Figure 8. Filtration rate reduction during test and dynamic equilibrium achievement for four drilling fluid samples at horizontal and vertical position. (a) Fresh mud, (b) nano-SiO2 mud, (c) nano-CaCO3 mud and (d) MWCNTs mud.
The resultant vertical force (∑Fy) exerted on the bentonite and nanoparticles computed by the dynamic mud cake buildup model at various inclination angles is listed in –. Particle acceleration in the direction perpendicular to fluid flow gradually decreased as the filtration rate decreased. This means the tendency of the particles to deposit decreased over time after mud cake formation. Investigation of the decrease in particle acceleration toward the permeable layer could be considered a suitable criterion for accurate diagnosis of dynamic mud cake buildup equilibrium. Particle depositional acceleration intensified as the inclination of the well increased. This increased the mud cake thickness, a key factor in borehole problems arising from stuck drill string, especially in directional and horizontal wells.
Table 4. Vertical force ∑Fy, particle depositional acceleration ay and possible depositional volume Vc exerted on bentonite computed by model for fresh mud at different inclinations.
Table 5. Vertical force ∑Fy, particle depositional acceleration ay and possible depositional volume Vc exerted on particles computed by model for nano-SiO2 mud at different inclinations.
Table 6. Vertical force ∑Fy, particle depositional acceleration ay and possible depositional volume Vc exerted on particles computed by model for nano-CaCO3 mud at different inclinations.
Table 7. Vertical force ∑Fy, particle depositional acceleration ay and possible depositional volume Vc exerted on particles computed by model for nano-MWCNTs mud at different inclinations.
The values for Vc calculated by the model for each drilling fluid sample at different well inclinations are shown in –. As the well inclination increased, the likelihood of particle deposition and mud cake formation on the lower section of the well increased; Vc then increased with respect to well inclination.
Using Vc as computed by the mathematical model, the role and intensity of the different solid particles in the deposition process and mud cake formation could be observed. For example, deposition of bentonite stopped for nano-CaCO3 drilling fluid in the vertical position () when the filtration rate decreased to 0.02 cm3.s−1, but nano-CaCO3 particle deposition continued up to dynamic equilibrium of mud cake buildup.
The forces and stresses exerted on the deposited bentonite and nanoparticles on the cake surface are required for detailed analysis of solid particle erosion. lists the net vertical force, shear stress exerted on the mud cake from drilling fluid circulation, and critical shear stress (τcr) for solid particles computed by the proposed model. The value of τcr for each particle type relates to the drilling mud composition; thus, the τcr calculated for bentonite particles was different for each sample.
Table 8. Erosion parameters (vertical force ∑Fy, shear stress τ, critical shear stress τcr and mud cake surface occupied by particle Sp) exerted on aggregated particles on the cake surface for four drilling fluid samples.
Sp is expressed in percentage and denotes the mud cake surface occupied by the specific particle under the study. This parameter is computed by averaging the weight of the bentonite and nanoparticles deposited in each time step. For nano-CaCO3 particles, the tendency for cation exchange between Ca2+ and Na+ available between the bentonite layers and adhesion of nano-CaCO3 particles to bentonite particles increased Sp and decreased the depth of penetration into the porous media. Unsuitable mud cake with high porosity formed with nano-CaCO3 drilling fluid and confirmed the value for Sp obtained by the model. Decreasing the Sp, increasing the penetration of nanoparticles into the mud cake, and plugging the pore spaces decreased the porosity of the mud cake. This also occurred for the nano-based drilling fluids containing MWCNTs and SiO2 particles and produced mud cake porosities of 26% and 22%, respectively ().
The weight and thickness of the mud cake for different well inclinations was estimated by determining the net forces and stresses exerted on the particles in the drilling fluid and particles deposited on the mud cake surface using the relations and formula presented in Sections 2.1 and 2.2 for the proposed model. These values were calculated at various angles after 300 s of circulation for time steps of 1 s. The results are listed in
Table 9. Mud cake thickness, hc, weight ratio of nanoparticle and bentonite on the cake, Mr, comparison between model and experimental outputs after 300 sec circulation for studied drilling fluids.
After 300 s, the actual mud cake thickness formed on the synthetic core was measured using a digital caliper (Mitutoys). The error in the amount of mud cake thickness calculated by the model (hc model) was compared with that measured by digital caliper (hc lab) and is shown in . As shown, the two values were in good agreement.
The study of mud cake growth in horizontal wells is very important. A low error value was reported by the model for horizontal wells (). With the expansion of the proposed model, a detailed description of mud cake buildup and thickness could be determined. The value of Mr at the end of 300 s of circulation was examined to reassess the accuracy of the fundamental model to compare with the experimental results. Mr was estimated by sampling the mud cake at the end of the dynamic circulation test and using DLS to measure the average particle size and volume of each solid particle in the drilling mud cake. The value of Mr estimated by the model was very similar to the Mr measured by DLS (), which indicates the accuracy of the proposed model.
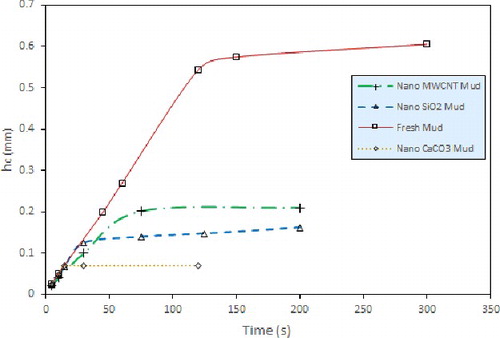
shows the results of simulated mud cake growth when the cell is aligned vertically. As observed, the mud cake thickness asymptote resulted from mud cake permeability stabilisation and achievement of dynamic equilibrium. In such cases, the mud cake thickness will remain nearly constant.
Figure 9. Mud cake buildup during dynamic filtration test for different drilling fluid samples at vertical position predicted by the model.
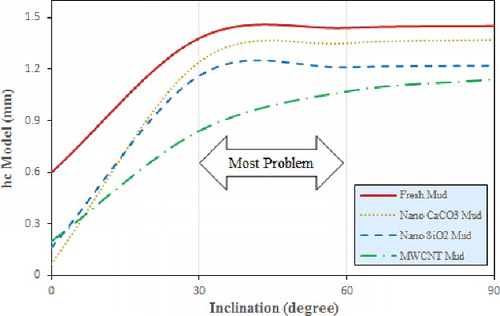
Studies have shown that the main borehole problems related to borehole cleaning in directional wells occurs at angles of 30° to 60°.[Citation44–47] In this interval, drilling cuttings and weight materials create major problems by forming cutting beds. The cutting bed avalanches and the borehole will be packed off, resulting in a stuck pipe. For this reason, a variety of mud cake thicknesses and well inclinations was computed by the mathematical model for each drilling fluid and the results are shown in . At well inclinations above 60°, increasing the well inclination had little effect on mud cake buildup. A decrease in well inclination to below 30° decreased the mud cake thickness and borehole problems. At 30° to 60°, the mud cake thickness reached a maximum and resulted in a tight borehole and differential sticking. This model prediction was a good match with literature about borehole problems caused by mud cake buildup at different well inclinations.
Figure 10. Variation of mud cake thickness at different well inclinations for four drilling fluid samples predicted by the model to analyse hole problems related to mud cake buildup.
5. Conclusions
The effects of solid particle geometry and the presence of three types of nanoparticles on mud cake buildup were modelled in directional and horizontal wells. Fractal theory and the structure of the aggregated particles were considered. This allowed comparison of the model predictions with the experiment data and the SEM images. It was determined that application and consideration of the possible deposition boundaries of the permeable zone in the annulus allowed the effect of each particle on mud cake growth to be monitored. This can aid selection of proper drilling fluid solids to minimise tight boreholes and differential sticking.
The use of fractal theory and consideration of cluster structures allowed correction of the hydrodynamic and electrostatic forces. This consideration significantly affected the deposition and erosion rates of particles with the permeable layer and mud cake buildup. The measurement of average particle size using DLS and fractal dimension analysis was used to define the hypothetical structure of the aggregated nanoparticles in the drilling fluids. These cluster structures showed good agreement with the SEM images of the mud cake surfaces. Restructuring rather than fragmentation of particles and the use of aggregated particles in the model improved its accuracy. This was reflected in the similar values for mud cake thickness and the nanoparticle bentonite weight ratio with those predicted by the model. The model results showed suitable agreement with published reports about critical borehole cleaning angles and cutting transport along the borehole.
Nomenclature
| Aagg | = | Area of aggregated particle perpendicular to the feed flow, cm2 |
| Ac | = | Core face area, cm2 |
| aL | = | Linear acceleration of particle, cm.s−2 |
| ay | = | Acceleration of aggregated particle in Y direction, cm.s−2 |
| Cb | = | Bentonite concentration in drilling fluid, gr.cm3 |
| CD | = | Drag coefficient, dimensionless |
| Cn | = | Nano concentration in drilling fluid, gr.cm3 |
| D | = | Dielectric constant |
| dagg | = | Aggregated particles diameter, cm |
| df | = | Fractal dimension, dimensionless |
| dp | = | Single particle diameter, cm |
| E | = | Young's modulus of particle, dyne.cm−2 |
| f | = | Friction factor of mud cake, dimensionless |
| H | = | Hamaker constant, J |
| hc | = | Mud cake thickness, cm |
| I | = | Particle moment of inertia, gr.cm2 |
| Idep | = | Deposition intensity index, s−1 |
| Ier | = | Erosion intensity index, dimensionless |
| k | = | Permeability of cluster forms by particle aggregation, md |
| K′ | = | Composite Young's modulus, dyne.cm−2 |
| K″ | = | Consistency index, cp |
| L | = | Length of the synthetic core in fluid flow direction, cm |
| Ln | = | Normal lever, cm |
| mp | = | Mass of aggregated particle, gr |
| N | = | Number of particles aggregate to form cluster structure |
| n | = | Flow behaviour index |
| Pp | = | Linear momentum of segregated particle from mud cake, gr.cm.s |
| q | = | Filtration rate, cm3.s−1 |
| Rep | = | Particle Reynolds number, dimensionless |
| rp | = | Particle radius, cm |
| S | = | Surface to surface separation length, cm |
| Sp | = | Mud cake surface area fraction that is occupied by a specific particle, dimensionless |
| tx | = | Time elapsed for the particle to travel the length of porous media, s |
| Ut | = | Tangential fluid velocity, cm.s−1 |
| Vp | = | Particle volume, cm3 |
| W | = | Synthetic core width, cm |
| Y | = | Poisson's ratio, dimensionless |
| z | = | Zeta potential, mV |
| β | = | Permeability factor of porous aggregated particles, dimensionless |
| ɛ0 | = | Permittivity of free space= 8.854 × 10⁻¹² c2J−1m−1 |
| Ɵ | = | Inclination angle, degree |
| ʎ | = | Invers Debye length, m−1 |
| µ | = | Drilling fluid viscosity, cp |
| ρf | = | Density of drilling fluid, gr.cm−3 |
| ρp | = | Density of particle, gr.cm−3 |
| τcr | = | Critical shear stress, dyne.cm−2 |
| υ | = | Kinematic viscosity, cm2.s−1 |
| ϕ | = | Porosity, dimensionless |
| Ψ | = | Sphericity of particle, dimensionless |
| γ | = | Shear rate, s−1 |
| = | Angular momentum of segregated particle from mud cake, gr.cm2.s−1 |
Acknowledgments
This research was supported by Petroleum University of Technology. The authors are thankful to their colleagues Dr Moghadasi, Dr Jamshidi, Dr Gerami and Dr Nakhai who provided expertise that greatly assisted the research.
Disclosure statement
No potential conflict of interest was reported by the authors.
References
- Peng SJ, Peden JM. Prediction of filtration under dynamic conditions. SPE paper 23824. SPE Formation Damage Control Symposium; 1992 Feb 26–27; Lafayette, LA; 1992.
- Parn-anurka S, Engler WT. Modeling of fluid filtration and near wellbore damage along a horizontal well. J Pet Sci Eng. 2005;46:149–160.
- Civan F, Engler WT. Drilling mud filtrate invasion- improved model and solution. J Pet Sci Eng. 1994;11:183–193.
- Civan F. Phenomenological filtration model for highly compressible filter cakes involving non-darcy flow. SPE paper 52147. Mid-continent Operations Symposium; 1999 Mar 28–31; Oklahoma City, OK; 1999.
- Fordham EJ, Ladva HKJ, Hall C, et al. Dynamic filtration of bentonite muds under different flow conditions. SPE paper 18038. 63rd Annual Technical Conference and Exhibition; 1988 Oct 2–5; Houston, TX; 1988.
- Khatib Z. Prediction of formation damage due to suspended solids modeling approach of filter cake buildup in injectors. SPE paper 28488. SPE 69th Annual Technical Conference; 1994 Sep 25–28; New Orleans, LA; 1994.
- Civan F. Interactions of the horizontal wellbore hydraulic and formation damage. SPE paper 35213. SPE Permian Basin Oil & Gas Recovery Conference; 1996 Mar 27–29; Midland, TX; 1996.
- Liu X, Civan F. Formation damage and filter cake buildup in laboratory core tests: modeling and model- assisted analysis. SPE paper 25215. SPEFE; 1996 Mar; 1996;26–30.
- Al-Abduwani FAH, Bedrikovestsky P, Farajzadeh R, et al. External filter cake erosion: mathematical model and experimental study. SPE paper 94635, SPE European Formation Damage Conference ; 2005 May 25–27; Sheveningen, Netherlands; 2005.
- Jiao D, Sharma MM. Mechanism of cake buildup in cross flow filtration of colloidal suspensions. J Colloid Interface Sci. 1994;162:454–462.
- Kalantariasl A, Zeinijahromi A, Bedrikovetsky P. External filter cake buildup in dynamic filtration: Mechanisms and key factors. SPE paper 168144. SPE International Symposium on Formation Damage Control; 2014 Feb 26–28; Lafayette, LA; 2014.
- Windato Gunawan AY, Sukarno P, Soewono E. Moeling of mud filtrate invasion and damage zone formation. J Pet Sci Eng. 2011;77:359–364.
- Zinati FF, Farajzadeh R, Currie PK, et al. Modelling of external filter cake buildup in radial geometry. Pet Sci Technol. 2009;27:746–763.
- Altman J, Ripperger S. Particle deposition and layer formation at the cross flow microfiltration. J Membrane Sci. 1997;124:119–128.
- Fisher KA, Wakeman RJ, Chiu TW, et al Numerical modeling of cake formation and fluid loss from non-newtonean muds during eccentric/concentric drill string with/without rotation. Trans IchemE 2000;78: 707–714.
- Amanullah Md, Arfaj KM, Al-Abdullatif Z. Preliminary test results of nano based drilling fluid for oil and gas field application. J Petroleum Technol. 2012;64:11–16.
- Chenevert EM, Sharma MM. Maintaining shale stability by pore plugging. US patent 0314549. 2009.
- Amanullah Md, Al-Tahini AM. Nano technology- Its significance in smart fluid development for oil and gas field application. SPE paper 126102. SPE Saudi Arabian Section Technical Symposium; 2009 May 9–11; Al-khobar; 2009.
- Abdo J, Haneef D. Nanoparticles: promising solution to overcome stern drilling problems. Nano Sci Technol Institute-Nanotech. 2010; 3:459–462.
- Al-Abdullatif Z, Amanullah Md. Preliminary test of a water based nanofluid. 8th International Conference on Chemistry; 2010 Oct 18–20; Manama, Bahrain; 2010.
- Neale G, Epstein N, Nader W. Creeping flow relative to permeable sphere. Chem Eng Sci. 1973;28:1865–1874.
- Veerapaneni S, Wiesner MR. Fluid mechanics of a fractal aggregate of varying radial porosity. J Colloidal Interface Sci. 1996;177:45–57.
- Mandelbrot BB. The fractal geometry of nature. New York: W.H. Freeman; 1983.
- White FM. , Viscous fluid flow. 2nd ed. New York: McGraw Hill; 1991.
- Chien SF. Settling velocities of irregularly shaped particles. SPE Drilling and Completion 1994;9:281–289.
- Ganser GHA. A rational approach to drag prediction of spherical and non-spherical particles. Powder Technol. 1993;77:143–152.
- Haider A, Levenspiel O. Drag coefficient and terminal velocity of spherical and non-spherical particles. Powder Technol J. 1989;58:63–70.
- Hartman M, Trnka O, Svoboda K. Free settling of non-spherical particles. Ind Eng Chem Res. 1994;33:1979–1983.
- Chhabra RP, Agrawal L, Sinha NK. Drag on non-spherical particles: an evaluation of available methods. Powder Technol. 1999;101:288–295.
- Derjaguin B, Landau LD. Theory of the stability of strongly charged lyophobic sols and of the adhesion of strongly charged particles in solutions of electrolytes. Acta Phys Chim. 1941;14:633–662.
- Khilar KC, Fogler S. Migration of fines in porous media. Dordrecht: Kluwer Academic; 1998.
- Israelachvili J. Intermolecular and surface forces. London: Academic Press; 2006.
- Kleinstreuer C, Feng Yu. Computation analysis of non-spherical particle transport and deposition in shear flow with application to lung aerosol dynamics – a review. J Biomech Eng. 2013;135:10–29.
- Mando M, Rosendah L. On the motion of non-spherical particles at high Reynolds number. Powder Technol. 2010;202:1–13.
- Saffman PG. Correction to the lift on a small sphere in a slow shear flow. J. Fluid Mech. 1968;31:624.
- Willis MS, Collins RM, Bridges WG. Complete analysis of non-parabolic filtration behavior. Chem Eng ResDesign 1983;61:96–109.
- Bedrikovetsky P, Zeinijahromi A, Siqueira FD, et al. Particle detachment under velocity alteration during suspension transport in porous media. Transp Porous Med. 2012;91:173–197.
- Bradford SA, Torkzaban S. Colloid transport and retention in unsaturated porous media: a review of interface-collector and pore scale processes and model. Vadose Zone J. 2008;7:667–681.
- Ravi KM, Beirute RM, Convington RL. Erodability of partially dehydrated gelled drilling fluid and filter cake. SPE paper 24571. 67th Annual Technical Conference; 1992; Washington, DC.
- Tremblay B, Sedgwick G, Forshner K. Modeling of sand protection from well on primary recovery. J Can Pet Technol. 1998;37:41–50.
- Derjaguin BV, Muller VM, Toporov YP. Effect of contact deformations on the adhesion of particles. J. Colloid Interface Sci. 1975;53:314–326.
- Bergendahl JA, Grasso D. Mechanistic basis for particle detachment from granular media. Environ Sci Tech. 2003;37:2317–2322.
- Peden JM. Ford JT. Oyeneyin MB. Comprehensive experimental investigation of drilled cutting transport in inclined wells including the effects of rotation and eccentricity. European Petroleum Conference; Netherlands; 1990.
- Sumer M, Serife SH. Solid-liquid two phase flow. 1st ed. Amsterdam: Elsevier science; 2008. Chapters 2, 31.
- Stifferman TR, Becker TR. Hole cleaning in full-scale inclined wellbores. SPE Dril Eng. 1992;7:115–120.
- Yang SR, Zhang JF, Shen JN. Experimental study on the law of drilling fluid carrying cutting in highly-deviated wells. J Daq Petrol Inst. 1997;21:126–129.
- Zamora M, Hanson P. Rules of thumb to improve high-angle hole cleaning. Petrol Eng Int. 1991;44–51.