
ABSTRACT
A novel and efficient cellulose/graphene oxide (CGO) fibre adsorbent was prepared by wet-spinning technique. The morphology and physicochemical properties of the CGO fibres were characterised by scanning electron microscope (SEM), Fourier transform infrared spectrometer, and thermo-gravimetric analysis. The equilibrium adsorption data were well fitted to the Langmuir models, and the adsorption capacity calculated from the Langmuir model reached 480.77 mg/g at 318 K. The adsorption kinetic studies revealed that pseudo-second-order model best describes the adsorption kinetic data. The thermodynamic parameters indicated that the adsorption was an endothermic and spontaneous process. Furthermore, the CGO fibre, which is very stable and easily separable, can be recycled with a dilute NaOH solution wash, retaining over 93% of the adsorption capacity after recycling three times.
1. Introduction
Dyes are important printing and dyeing chemicals widely used in textile, paper, printing, plastics, leather, cosmetics, and food industries. Because of the complex aromatic structures and xenobiotic properties, dyes are non-biodegradable and harmful to human beings.[Citation1–Citation3] Consequently, wastewater containing excessive dyes must be treated strictly before discharging into the natural water.
Many treatment methods, including adsorption,[Citation4–Citation6] chemical coagulation,[Citation7] membrane separation,[Citation8] photo-catalytic degradation,[Citation9,Citation10] and biological treatment [Citation11] have been developed for the removal of dyes from aquatic environment. Among these methods, adsorption was proved to be an effective method due to its low cost, high efficiency, and simple operation. In order to meet the increasingly stringent effluent discharge standards and resolve the problem of dye pollution, the scientists have been searching for environmentally friendly, highly efficiency, and low cost adsorbents.
With the rapid development in nanotechnology, carbon nanomaterials have been investigated in water treatment, such as the carbon nanotubes [Citation12] and graphene.[Citation13] Graphene, an ideal two-dimensional sheet of hexagonally arrayed sp2-bonded carbon atoms, has drawn tense attentions due to its unique electronic, thermal, and mechanical properties.[Citation14,Citation15] Graphene's oxidised derivative, graphene oxide (GO), also possesses some amazing properties including good mechanical strength, abundant oxygen-containing and, therefore, hydrophilic functional groups, and large surface area. Furthermore, GO can easily be produced in bulk via a chemical exfoliation process of natural graphite.[Citation16,Citation17] Because of these advantages, GO has proven to be a promising adsorbent for removal of pollutants from water. There are some publications which report that the synthetic GO can be used directly for water treatment and exhibit high adsorption capacities toward dyes [Citation18] and heavy metal ions.[Citation19] However, after adsorption, the GO must be separated via centrifugation at higher speeds because of its relative stability in water.[Citation20] Separation of GO from solution will be costly and poses a secondary pollution risk in water, because it cannot be separated completely due to its nanoscale.
To solve this problem, some papers regarding graphene oxide based materials have been reported. For example, Tao et al. [Citation21] prepared a three-dimensional monolithic carbon material through the linkage of functionalised graphene sheets under hydrothermal conditions. The abundant oxygen-containing groups from PVA and GO surface will both react via a dehydration reaction, and interact by hydrogen bonding as the hydrogel is forming. Similarly, our group in previous studies has prepared GO/chitosan fibres [Citation22] and GO/calcium alginate fibres,[Citation23] and investigated the adsorption properties for Congo red and methylene blue. From these experiments, we found that these GO-based materials have a good adsorption capacity, and can be easily separated.
As the most abundant renewable organic resource on earth, cellulose has attracted more and more attention in wastewater treatment due to its good adsorption capability and degradability. Shi et al. [Citation24] produced a magnetic cellulose/graphene oxide (CGO) composite for the adsorption of MB. However, the adsorption capacity (70 mg/g) is much lower than other common adsorbents; this may be attributed to the occupation of adsorption sites by magnetic Fe3O4 nanoparticles. Herein, cellulose was chose to act as the supporter to immobilise and link the GO sheets and form the CGO fibres. The CGO fibres were first prepared by wet-spinning technique to our knowledge, and the effects of adsorbent dosage, solution Ph, the initial MB concentration and temperature, and contact time on adsorption of MB onto the CGO fibres were investigated in detail. In particular, the great stability and easy separation are the highlights in my work.
2. Materials and methods
2.1. Materials
The expandable graphite was purchased from Henglide Graphite Company (Qingdao, China). Sodium cellulose xanghate (8.35 wt %) was supplied by Shandong Helon Co., Ltd., China. Methylene blue (C16H18ClN3S.3H2O, >98.5% in purity) was purchased from Tianjin Chemical Reagent Manufacturing Co., Ltd., China. All reagents were used without further purification. All other reagents were of analytical grade and purchased from Sinopharm Chemical Reagent Co., Ltd., China.
2.2. Preparation of GO
GO was prepared by the modified Hummer method from expandable graphite.[Citation25] KMnO4 (15 g) and NaNO3 (2.5 g) were added into H2SO4 (115 mL, 98 wt %) in an ice bath under constant stirring followed by addition and complete dispersion of expandable graphite (2.5 g). The obtained mixture was kept at 273 K for 24 h. Then, the mixture was kept at 308 K for 30 min with constant stirring and slowly diluted by adding deionised water into the mixture. The reaction temperature of the suspension got to 371 K rapidly and maintained for 15 min. Upon addition of several millilitres of 30% H2O2, the colour of the mixture turned into yellow. Finally, the mixture was washed with HCl (5%) to remove metal ions and rinsed with deionised water several times until the pH of the solution was neutral.
2.3. Preparation of the CGO fibres
The CGO fibres were prepared by a wet-spinning technique. First, 1.87 g sodium cellulose xanghate was added into 10 g GO suspension (1.56 wt %) under constant stirring for 30 min. Then, the mixture (the weight ratio of GO and sodium cellulose xanghate is 1:1) was poured into coagulation bath containing 10 wt % H2SO4, 12.5 wt % Na2SO4, and 1.5 wt % ZnSO4 by a syringe pump. Finally, the obtained fibres were washed several times with deionised water until the pH of the solution was neutral and the samples were allowed to dry in air. The CGO fibres with different weight ratios of GO and sodium cellulose xanghate (0:1, 1:1, 2:1, 3:1, 4:1, and 5:1) were prepared.
2.4. Characterisation of the samples
The surface morphologies of cellulose and CGO fibres were characterised by scanning electron microscope (SEM, Hitachi S4800). The surface functional groups of GO and CGO fibres were determined by a Tensor 27 Fourier transform infrared spectrometer (FT-IR) (Bruker, German) within the wavenumber range from 400 to 4000 cm−1. Thermo-gravimetric analysis (TGA) was carried out using a SHIMADZU DTG-60H thermo-gravimetric analyzer (Japan). These samples were heated from 298 to 973 K at a rate of 10 K/min under nitrogen environment.
2.5. Batch adsorption experiments
Initial solutions with different concentrations of MB were prepared by proper dilution from stock 1000 mg/L MB standards. Adsorption experiments were carried out in a temperature-controlled water bath shaker (SHZ-82) at 298 K with the desired solution pH, contact time, and CGO dosage in a glass flask containing 50 mL solution. The solution pH was adjusted from 2.0 to 10.0 by adding diluted HNO3 or NaOH solution. In order to ensure accuracy of the obtained data, all experiments were repeated at least three times.
Comparing adsorption capacity of the CGO fibres with different weight ratios of GO and sodium cellulose xanghate was conducted by adding 20 mg CGO fibres (0:1, 1:1, 2:1, 3:1, 4:1, and 5:1) into 50 mL solution with MB concentration 160 mg/L. The solution pH and temperature were controlled at 6.0 and 298 K, respectively. The effect of MB concentration on the adsorption was tested by adding 20 mg CGO fibres into 50 mL solution with MB concentration ranging from 100 to 220 mg/L. The solution pH and temperature were controlled at 6.0 and 298 K, respectively. The effect of the CGO dosage on the adsorption was conducted by adding different CGO fibres weight from 5 to 35 mg into 50 mL solution with initial MB concentration of 160 mg/L at solution pH 6.0 and temperature 298 K.
After adsorption equilibrium, the residual concentration of MB in the solution was measured at the wavelength of 665 nm by a UV-visible spectrophotometer (TU-1810, Beijing Purkinje General Instrument Co. Ltd., China). The adsorption capacity (qe) and removal percentage E (%) were calculated according to following equations:
(1)
(2)
where C0 (mg/L), Ct (mg/L), and Ce (mg/L) are the MB concentrations at initial, at time t (min), and at equilibrium time, respectively. V is the volume of the solution (mL) and m is the mass of dry adsorbent (mg).
3. Results and discussion
3.1. Characterisation of the CGO fibres
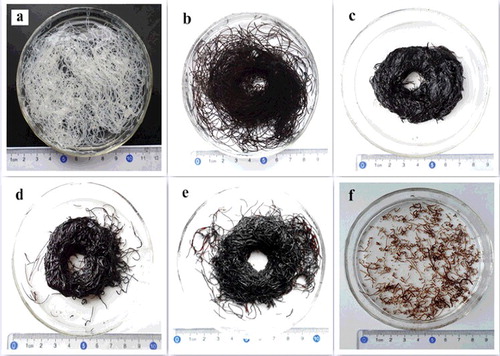
shows the optical photographs of the fibres with different weight ratios of GO and sodium cellulose xanghate. It can be seen that pure cellulose fibre ((a)) has good formability and can be easily spun by a wet-spinning method. With increasing the amount of GO content, the formability of the fibres decreases gradually ((b–e)). As the weight ratio of GO and sodium cellulose xanghate reaches 5:1, the formability of the fibres becomes very poor and only short fibres are observed ((f)).
Figure 1. (Colour online). Photographs of fibres with different weight ratios of GO and sodium cellulose xanghate: (a) pure cellulose, (b) 1:1, (c) 2:1, (d) 3:1, (e) 4:1, and (f) 5:1.
shows the SEM images of pure cellulose and CGO fibres. It can be seen that pure cellulose fibres have homogeneous and smooth surface ((a,b)). In contrast, the CGO fibres have rougher surfaces and lots of humps, perhaps caused by the wrinkles of GO sheets, and this results in a larger number of potential adsorption sites.
Figure 2. SEM images of cellulose fibres (a, b) and CGO fibres (c, d).
The FT-IR spectra of pure cellulose fibre, GO, and CGO fibres are shown in (a). For the FT-IR spectrum of cellulose, there are peaks at 3440, 2900, 1640, 1400, and 1070 cm−1 correspond to the stretching vibration of −OH, C−H stretching vibration, the O–H bending vibration, C−OH stretching vibration, and C−O stretching vibration, indicating that cellulose was successfully prepared. As the FT-IR spectrum of GO shows, the peaks at 1070, 1380, 1630, and 1710 cm−1 correspond to C−O−C stretching vibration, C−OH stretching, C˭C stretching mode of the sp2 carbon skeletal network, and the C˭O stretching vibration of the −COOH groups, respectively. The broad and intense band observed at 3440 cm−1 can be ascribed to the stretching vibration of −OH. Compared with GO, there are several characteristic absorption peaks of GO, indicating that GO is successfully introduced into CGO fibres. Furthermore, one characteristic absorbance band located at 2900 cm−1 corresponded to C−H stretching vibration, which is caused by methyl and methylene of the cellulose.
Figure 3. (Colour online). (a) FT-IR spectra of cellulose, GO, and CGO fibres. (b) TGA and DTA curves of CGO fibres.
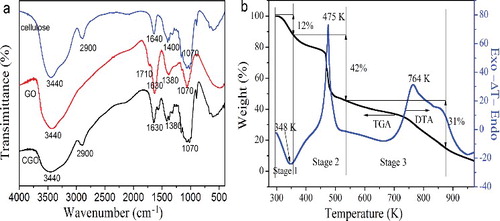
(b) shows the TGA/DTA (differential thermal analysis) curves of CGO fibres, which exhibit a stepwise degradation pathway corresponding to the thermal decomposition of the different organic components. The process can be divided into three distinctive regions. The first stage is a process of dehydration and desiccation. The release of absorbed water molecules leads to a weight loss of 12% at a temperature range of 298–363 K, and an endothermic peak of 348 K is found in the DTA curve. During the second stage, there is a rapid weight loss at around 473 K, which can be attributed to the removal of oxygen-containing functional groups from GO. The third stage, the decomposition of cellulose and the bulk pyrolysis of carbon skeleton of graphene, made the weight losses from 46% to 15% when the temperature has risen from 533 to 873 K, and there is an endothermic peak at 764 K in the DTA curve.
3.2. Comparing adsorption capacity of CGO fibres with different weight ratios of GO and sodium cellulose xanghate
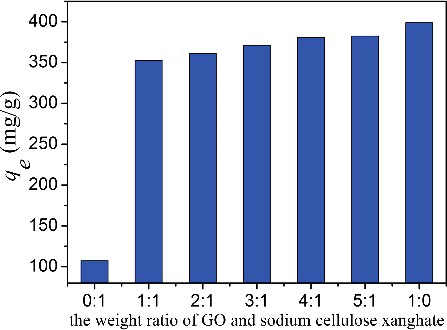
The effect of different weight ratios of GO and sodium cellulose xanghate on the adsorption property of the fibres is shown in . It can be seen that pure cellulose fibres have a lower adsorption capacity for MB. The adsorption capacity is 107.4 mg/g, which is higher than powdered activated carbon (91 mg/g), suggesting that cellulose is a good adsorbent. Furthermore, the cellulose can act as the supporter to form composite fibres to improve the stability and easy separation. As 50 wt % GO is mixed with sodium cellulose xanghate, the adsorption capacity of the CGO fibres increases sharply and reaches 352.7 mg/g. By further increasing the weight ratio of GO, the adsorption capacity of the fibres also increases correspondingly and reaches a maximum of 382.4 mg/g for a weight ratio of GO and sodium cellulose xanghate at 5:1. For the pure GO, the adsorption capacity is 398.8 mg/g. Compared to the pure GO, although the adsorption capacity of CGO fibres is decreased, the cellulose and GO composite have improved stability and are easily separated from solution, which have great impact to the real application. Due to the insufficient formation of the CGO fibres (5:1) and only a slight difference in adsorption capacity between two samples with weight ratios of 4:1 and 5:1, the CGO fibres with the weight ratio of GO and sodium cellulose xanghate at 4:1 are chosen in the following adsorption experiments.
Figure 4. (Colour online). Comparison of the adsorption capacity (qe) of the fibres with different weight ratios of GO and sodium cellulose xanghate (initial MB concentration: 160 mg/L, pH: 6.0, dosage: 20 mg, and temperature: 298 K).
3.3. Effect of adsorbent dosage
The effect of different adsorbent dosages on MB removal was investigated and illustrated in (a). It is obvious that the removal percentage increases with increasing CGO dosage as a result of increased available adsorption active sites and surface area.[Citation26] However, not all of the active sites on adsorbent can be occupied by MB molecules at the higher dosage of the CGO fibres, so the adsorption capacity decreases as the adsorbent dose increases.
Figure 5. (Colour online). (a) Effect of adsorbent dosage (initial MB concentration: 160 mg/L, pH: 6.0, and temperature: 298 K). (b) Effect of solution pH (initial MB concentration: 160 mg/L, dosage: 20 mg, and temperature: 298 K).
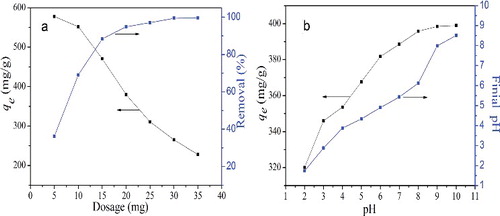
3.4. Effect of initial solution pH
Solution pH plays an important role on the adsorption process, because it can change the protonation of functional groups on the surface of the adsorbent and adsorbing species. The adsorption experiments were carried out by varying pH range from 2.0 to 10.0, and the results are illustrated in (b). It can be seen that the adsorption capacity increased as the pH increased from 2.0 to 10.0. The decrease of the adsorption capacity under acidic condition may be attributed to the electrostatic repulsion between the positively charged surface of CGO fibres and MB cations.[Citation24] As the pH increases, the carboxyl and hydroxyl groups of the CGO fibres are deprotonated to form –COO— and –O— groups, which leads to an electrostatic attraction between the negatively charged surface of the CGO fibres and the MB cations, thus, leading to an increase in the adsorption capacity.[Citation27]
3.5. Effect of initial MB concentration and temperature
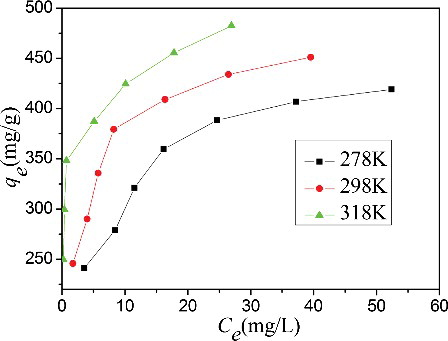
The initial MB concentration and temperature are important factors to determine the process of adsorption. shows that the adsorption capacity increases with increasing the initial MB concentration because of the increased driving force from an enhanced concentration gradient.[Citation28] The adsorption capacity increases from 245.7 to 451.2 mg/g at 318 K as the initial MB concentration increases from 100 to 220 mg/L. Moreover, the adsorption capacity also increases with increasing temperature. The maximum adsorption capacity increases from 419.09 to 451.18 mg/g with the increasing in temperature from 278 to 313 K, suggesting that the process of adsorption of MB onto the CGO fibres is an endothermic process.
Figure 6. (Colour online). Effect of initial MB concentration and temperature on the adsorption of MB onto CGO fibres (pH: 6.0, dosage: 20 mg).
3.6. Adsorption isotherm
Several adsorption isotherm models are used to evaluate adsorption phenomena, and to predict the adsorption capacity of the adsorbent. The Langmuir and Freundlich models have been widely used to fit adsorption data. The Langmuir model assumes that adsorption occurs at a homogeneous monolayer surface.[Citation29] This equation can be expressed as [Citation30]
(3)
where qmax (mg/g) is the maximum adsorption capacity and kL (L/mg) is the Langmuir constant related to the affinity of the binding sites and energy of adsorption. Plotting Ce/qe against Ce gives a straight line, and the qmax, kL can be calculated from the slopes and intercepts.
The Freundlich model assumes that adsorption occurs at a heterogeneous surface. This equation can be expressed as [Citation31]
(4)
where kF (L/mg) is a Freundlich constant related to the adsorption capacity, and n is the heterogeneity factor. Plotting ln qe against ln Ce gives a straight line, and the kF, n could be calculated from the intercepts and slopes.
shows that all the determination coefficients (R2) obtained from Freundlich model are lower than those obtained from the Langmuir model, which are all higher than 0.97. This suggests that the Langmuir model describes the experimental data better than the Freundlich model due to the homogeneous distribution of active adsorption sites on the surface of the CGO fibres.[Citation32] The values of kF and n increase with increasing temperature, indicating that adsorption of MB onto the CGO fibres is favourable at higher temperature.
Table 1. Parameters of Langmuir and Freundlich models for the adsorption of MB onto CGO fibres.
The calculated maximum adsorption capacity of the CGO fibres from Langmuir model is 480.77 mg/g at 318 K. The comparisons of maximum adsorption capacity of different adsorbents for MB are listed in . As the table shows, the MB adsorption capacity of CGO fibre is higher than carbon nanotube,[Citation12] graphene,[Citation13] magnetic CGO,[Citation24] magnetic chitosan/graphene oxide,[Citation33] and graphene oxide/calcium alginate.[Citation23]
Table 2. Maximum adsorption capacity for MB onto various adsorbents.
Furthermore, the Langmuir isotherm model can be described by a separation factor, which is defined by the following equation [Citation34]:
(5)
where kL is the Langmuir constant (L/mg) and C0 is the initial dye concentration (mg/L). Previous studies have shown that the adsorption is unfavourable (RL > 1), favourable (RL < 1), linear (RL = 1), or irreversible (RL = 0).[Citation35] shows that the RL values are between 0 and 1, which indicate that the adsorption of MB onto the CGO fibres is a favourable process. The low RL value (<0.1) indicates that the adsorption of MB onto the CGO fibres may be relatively strong.
3.7. Effect of contact time
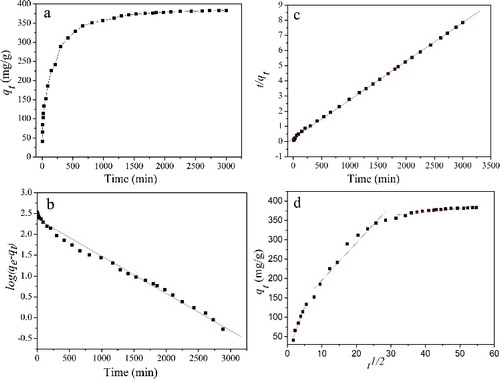
The effect of contact time on adsorption of MB onto the CGO fibres was performed and shown in (a). It is apparent that the adsorption capacity rapidly increases at beginning and gradually slows down until equilibrium. This may be explained by a large number of available adsorption sites at initial time.[Citation36] As contact time increases, there are less available adsorption sites on the CGO fibres; therefore, the adsorption capacity gradually slows down until equilibrium. It took about 50 h to reach adsorption equilibrium, and the adsorption capacity was determined to be 383.3 mg/g under these conditions.
Figure 7. (Colour online). (a) Effect of constant contact time on the adsorption of MB onto CGO fibres (initial MB concentration: 160 mg/L, pH: 6.0, dosage: 20 mg, and temperature: 298 K). Adsorption kinetics of MB onto CGO fibres, (b) pseudo-first-order; (c) pseudo-second-order; and (d) intra-particle diffusion models.
3.8. Adsorption kinetics study
In the adsorption experiments, adsorption kinetics is used to predict the adsorption rate and explain the controlling mechanism of the adsorption process. Pseudo-first-order, pseudo-second-order, and intra-particle diffusion models are investigated to describe the behaviour of MB adsorption onto the CGO fibres. The pseudo-first-order model is expressed as [Citation37]
(6)
where qe and qt are the adsorption capacities (mg/g) of MB on adsorbent at equilibrium and at a given time t (min), respectively. k1 is the rate constant of adsorption (1/min). The values of k1 and qe () were determined from the slope and intercept of the linear plot of log(qe − qt) against t.
Table 3. Parameters of pseudo-first-order and pseudo-second-order and intra-particle diffusion models for the adsorption of MB onto CGO fibres.
The pseudo-second-order model is expressed as [Citation38]
(7)
where k2 (g/mg min) is the rate constant for the pseudo-second-order adsorption process. The values of k2 and qe were evaluated from the intercept and slope of the linear plot of t/qt versus t (min).
Each kinetic model was drawn by the fitted straight lines in (b,c). It can be seen that the determination coefficient (R2 > 0.999) obtained from the pseudo-second-order model is higher than that of the pseudo-first-order model (). In addition, the experimental adsorption capacity (383.3 mg/g) is in greater agreement with calculated adsorption capacity (392.2 mg/g) from the pseudo-second-order model. Therefore, it can be concluded that the experimental data are well described by the pseudo-second-order model.
In order to determine the rate-controlling step, the intra-particle diffusion model was fitted to the experiment data. The equation can be expressed as
(8)
where kid is intra-particle diffusion constant (mg/g min0.5), qt (mg/g) is the adsorption capacity at time t (min), and Ci is the intercept at stage i.
(d) shows that the plot is nonlinear, and Ci is not equal to zero. It also indicated that there may be three steps during the adsorption process of MB onto the CGO fibres. The first step is the external surface adsorption or instantaneous adsorption stage with high slope (23.79). In this stage, the rate of MB removal is higher due to the instantaneous availability of large active adsorption sites and large surface area. The second stage is a gradual adsorption stage, where intra-particle diffusion is rate-controlled. The third stage with a small slope (0.99) indicates that the adsorption experiment has achieved equilibrium. All the model parameters are listed in . The value of K1d (23.79 mg/g min0.5) is higher than K2d (9.62 mg/g min0.5) and K3d (0.99 mg/g min0.5), suggesting that the external diffusion and intra-particle diffusion play the main role in the adsorption kinetics.
3.9. Adsorption thermodynamic study
In order to evaluate the effect of temperature on adsorption process of MB onto the CGO fibres, the thermodynamic parameters such as enthalpy (ΔH) and entropy (ΔS) are calculated by the van't Hoff equation [Citation39]:
(9)
The Gibbs free energy (ΔG) can be calculated from the following equation:
(10)
where T is absolute temperature in Kelvin (K) and R is the universal gas constant (8.314 J/mol K). Plotting ln(qe/Ce) against 1/T gives a straight line with slope and intercept equal to −ΔH/T and ΔS/R, respectively.
The thermodynamic parameters are listed in . The negative values of ΔG suggest that adsorption is a spontaneous process. While ΔG decreases from −7.23 to −11.51 kJ/mol when the temperature increases from 278 to 318 K, indicating that higher temperature is more conductive to the adsorption process. The positive value of ΔH indicates that the adsorption reaction is endothermic. The positive value of ΔS demonstrates the increased randomness at the solid–solute interface.
Table 4. Thermodynamic parameters at different temperatures.
3.10. Regeneration of CGO fibre
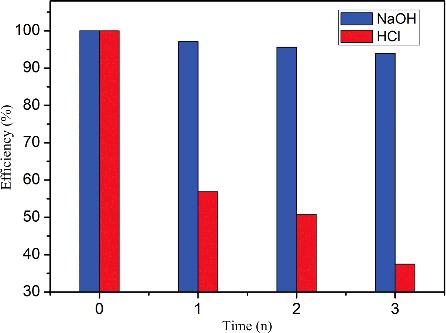
Regeneration and reuse of adsorbents is a good factor for evaluating the economy in commercial applications. After adsorption, the MB adsorbed CGO fibre was added into 0.2 M NaOH or 0.2 M HCl solution, and was stirred for 3 h. The CGO fibre was washed with deionised water two times to remove the residual NaOH or HCl solution. Then, the CGO fibre was regenerated through vacuum drying at 323 K and reused for adsorption. The relative capacity for each cycle was calculated by qe,n/qe,0, where n was the recycling number. As shows, the NaOH solution more effectively regenerated the CGO fibre, with 93% capacity retention after three cycles. Therefore, the CGO fibre is a stable, cost-effective, and effective adsorbent for MB removal.
Figure 8. (Colour online). Regeneration and reuse of CGO fibres. The labels of NaOH and HCI represent the relative capacity after NaOH solution and HCI solution washing, respectively (initial MB concentration: 160 mg/L, dosage: 20 mg, temperature: 298 K, and pH: 6).
4. Conclusions
A novel and efficient CGO fibre adsorbent with enhanced adsorption capacity for the removal of MB was prepared by wet-spinning technique. The adsorption capacity was found to increase with increasing solution pH, initial MB concentration, and temperature. The equilibrium adsorption isotherm revealed that the Langmuir model better describes the adsorption process than the Freundlich model, and the maximum adsorption capacity of MB onto the CGO fibres was 480.77 mg/g. The kinetic adsorption followed pseudo-second-order kinetic model. The negative values of ΔG and positive values of ΔH indicated that adsorption of MB on the fibres was a spontaneous and endothermic process. Furthermore, the CGO fibres can be effectively regenerated with a dilute NaOH solution and still retain high adsorption capacity after three cycles. The investigation proves that the CGO fibre is an efficient and cost-effective adsorbent for practical application in the treatment of dye wastewaters.
Disclosure statement
No potential conflict of interest was reported by the authors.
Additional information
Funding
References
- Parida KM, Sahu S, Reddy KH, et al. A kinetic, thermodynamic, and mechanistic approach toward adsorption of methylene blue over water-washed manganese nodule leached residues. Ind Eng Chem Res. 2011;50:843–848.
- Aksu Z. Application of biosorption for the removal of organic pollutants: a review. Process Biochem. 2005;40:997–1026.
- Santos SCR, Boaventura RAR. Adsorption modeling of textile dyes by sepiolite. Appl Clay Sci. 2008;42:137–145.
- Li YH, Du QJ, Liu TH, et al. Preparation of activated carbon from enteromorpha prolifera and its use on cationic red X-GRL removal. Appl Surf Sci. 2011;257:10621–10627.
- Coasne B, Alba-Simionesco C, Audonnet F, et al. Adsorption, structure and dynamics of benzene in ordered and disordered porous carbons. Phys Chem Chem Phys. 2011;13:3748–3757.
- Du QJ, Sun JK, Li YH, et al. Highly enhanced adsorption of congo red onto graphene oxide/chitosan fibers by wet-chemical etching off silica nanoparticles. Chem Eng J. 2014;245:99–106.
- Sadrnourmohamadi M, Gorczyca B. Removal of dissolved organic carbon (DOC) from high DOC and hardness water by chemical coagulation: relative importance of monomeric, polymeric, and colloidal aluminum species. Separ Sci Technol. 2015;50:2075–2085.
- Kumar RV, Ghoshal AK, Pugazhenthi G. Fabrication of zirconia composite membrane by in-situ hydrothermal technique and its application in separation of methyl orange. Ecotoxicol Environ Saf. 2015;121:73–79.
- Kar A, Smith YR, Subramanian V. Improved photocatalytic degradation of textile dye using titanium dioxide nanotubes formed over titanium wires. Environ Sci Technol. 2009;43:3260–3265.
- Gulshan F, Yanagida S, Kameshima Y, et al. Various factors affecting photodecomposition of methylene blue by iron-oxides in an oxalate solution. Water Res. 2010;44:2876–2884.
- El-Naas MH, Al-Muhtaseb SA, Makhlouf S. Biodegradation of phenol by pseudomonas putida immobilized in polyvinyl alcohol (PVA) gel. J Hazard Mater. 2009;164:720–725.
- Yao YJ, Xu FF, Chen M, et al. Adsorption behavior of methylene blue on carbon nanotubes. Bioresource Technol. 2010;101:3040–3046.
- Liu T, Li YH, Du QJ, et al. Adsorption of methylene blue from aqueous solution by graphene. Colloid Surf B: Biointerfaces. 2012;90:197–203.
- Liang YY, Wu DQ, Feng XL, et al. Dispersion of graphene sheets in organic solvent supported by ionic interactions. Adv Mater. 2009;21:1679–1683.
- Su Q, Pang SP, Alijani V, et al. Composites of graphene with large aromatic molecules. Adv Mater. 2009;21:3191–3195.
- Park S, Ruoff RS. Chemical methods for the production of graphenes. Nat Nanotechnol. 2009;4:217–224.
- Dreyer DR, Park S, Bielawski CW, et al. The chemistry of graphene oxide. Chem Soc Rev. 2010;39:228–240.
- Yang ST, Chen S, Chang YL, et al. Removal of methylene blue from aqueous solution by graphene oxide. J Colloid Interface Sci. 2011;359:24–29.
- Wang H, Yuan XZ, Wu Y, et al. Adsorption characteristics and behaviors of graphene oxide for Zn(II) removal from aqueous solution. Appl Surf Sci. 2013;279:432–440.
- Wu ZB, Zhong H, Yuan XZ, et al. Adsorptive removal of methylene blue by rhamnolipid-functionalized graphene oxide from wastewater. Water Res. 2014;67:330–344.
- Tao Y, Kong DB, Zhang C, et al. Monolithic carbons with spheroidal and hierarchical pores produced by the linkage of functionalized graphene sheets. Carbon. 2014;69:169–177.
- Du QJ, Sun JK, Li YH, et al. Highly enhanced adsorption of congo red onto graphene oxide/chitosan fibers by wet-chemical etching off silica nanoparticles. Chem Eng J. 2014;245:99–106.
- Li Y, Du Q, Liu T, et al. Methylene blue adsorption on graphene oxide/calcium alginate composites. Carbohydr Polym. 2013;95:501–507.
- Shi HC, Li WS, Zhong L, et al. Methylene blue adsorption from aqueous solution by magnetic cellulose/graphene oxide composite: equilibrium, kinetics, and thermodynamics. Ind Eng Chem Res. 2014;53:1108–1118.
- Hummers WS, Offeman RE. Preparation of graphitic oxide. J Am Chem Soc. 1958;80:1339.
- Roy A, Adhikari B, Majumder SB. Equilibrium, kinetic, and thermodynamic studies of azo dye adsorption from aqueous solution by chemically modified lignocellulosic jute fiber. Ind Eng Chem Res. 2013;52:6502–6512.
- Shen Y, Fang QL, Chen BL. Environmental applications of three-dimensional graphene-based macrostructures: adsorption, transformation, and detection. Environ Sci Technol. 2015;49:67–84.
- Debnath S, Ghosh UC. Nanostructured hydrous titanium (IV) oxide: synthesis, characterization and Ni(II) adsorption behavior. Chem Eng J. 2009;152:480–491..
- Körbahti BK. Response surface optimization of electrochemical treatment of textile dye wastewater. J Hazard Mater. 2007;145:277–286.
- Langmuir I. The adsorption of gases on plane surfaces of glass, mica and platinum. J Am Chem Soc. 1918;40:1361–1403.
- Freundlich HMF. Over the adsorption in solution. Z Phys Chem. 1906;57:385–471.
- Ramesha GK, Vijaya Kumara A, Muralidhara HB, et al. Graphene and graphene oxide as effective adsorbents toward anionic and cationic dyes. J Colloid Interface Sci. 2011;361:270–277.
- Fan LL, Luo CN, Li XJ, et al. Fabrication of novel magnetic chitosan grafted with graphene oxide to enhance adsorption properties for methyl blue. J Hazard Mater. 2012;215–216:272–279.
- Bulut E, Özacar M, Sengil IA. Equilibrium and kinetic data and process design for adsorption of Congo Red onto bentonite. J Hazard Mater. 2008;154:613–622.
- Chen M, Chen Y, Diao GW. Adsorption kinetics and thermodynamics of methylene blue onto p-tert-butyl-calix[4,6,8] arene-bonded silica gel. J Chem Eng Data. 2010;55:5109–5116.
- Hameed BH. Evaluation of papaya seed as a novel non-conventional low-cost adsorbent for removal of methylene blue. J Hazard Mater. 2010;162:939–994.
- Dogan M, Alkan M, Demirbas O, et al. Adsorption kinetics of maxilon blue GRL onto sepiolite from aqueous solutions. Chem Eng J. 2006;124:89–101.
- Ho YS. Second-order kinetic model for the sorption of cadmium onto tree fern: a comparison of linear and non-linear methods. Water Res. 2006;40:119–125.
- Neghlani PK, Rafizadeh M, Taromi FA. Preparation of aminated-polyacrylonitrile nanofiber membranes for the adsorption of metal ions: comparison with microfibers. J Hazard Mater. 2011;186:182–189.