
 ?Mathematical formulae have been encoded as MathML and are displayed in this HTML version using MathJax in order to improve their display. Uncheck the box to turn MathJax off. This feature requires Javascript. Click on a formula to zoom.
ABSTRACT
The mass susceptibility (χmass) and mass magnetization (Mmass) were determined for a series of ternary manganese and zinc ferrite nanoparticles (Mn–Zn ferrite NPs, MnxZn1−xFe2O4) with different Mn:Zn ratios (0.08 ≤ x ≤ 4.67), prepared by the thermal decomposition reaction of the appropriate metal acetylacetonate complexes, and for the binary homologs (MxFe3−xO4, where M = Mn or Zn). Alteration of the Mn:Zn ratio in Mn–Zn ferrite NPs does not significantly affect the particle size. At room temperature and low applied field strength the mass susceptibility increases sharply as the Mn:Zn ratio increases, but above a ratio of 0.4 further increase in the amount of manganese results in the mass susceptibility decreasing slightly, reaching a plateau above Mn:Zn ≈ 2. The compositional dependence of the mass magnetization shows less of a variation at room temperature and high applied fields. The temperature dependence of the mass magnetization of Mn–Zn ferrite NPs is significantly less for Mn-rich compositions making them more suitable for downhole imaging at higher temperatures (>100 °C). For non-shale reservoirs, replacement of nMag by Mn-rich Mn–Zn ferrites will allow for significant signal-to-noise enhancement of 6.5× over NP magnetite.
1. Introduction
Despite moves towards green energy and energy conservation, there is an ever-increasing global demand for hydrocarbon fuels [Citation1]. Unfortunately, the majority of oil and natural gas near the surface and in large, highly pressurized, reservoirs have already been exploited, thus, resources have moved to sources that while easier to locate are more difficult to exploit. In the United States, the largest potential energy source is found in shale reservoirs [Citation2,Citation3]. It is, however, difficult to obtain hydrocarbons from shale since it has very low permeability (nD—µD). It was only recently that it became economically viable to extract shale oil and gas due to hydraulic fracturing and horizontal drilling methods. Despite advances, hydraulic fracturing has significant issues (in addition to environmental concerns) including the placement of proppant and damage of the reservoir rock. In order to obtain the maximum amount of production from a well, more information is needed of the well itself during the hydraulic fracturing process [Citation4].
Characterization is presently achieved using seismic measurements and NMR well logging, but new methods are being investigated, including: conductive polymers, active or passive devices, or proppant tracking materials [Citation5,Citation6]. The low porosity and permeability even after hydraulic fracturing, requires any sensor or tracer to have a size sufficiently small to allow for its transport through the fractured rock formation. Nanoparticles (NPs) offer potential because one can change the surface properties to allow mobility [Citation7] and their core may have a range of properties that can be sensed or reported [Citation8–10]. One such proposal [Citation11,Citation12] is the use of non-toxic nanoscale magnetite (nMag) by analogy with its use as a tracer in biological applications [Citation13,Citation14].
We have previously reported that nanoscale magnetite (nMag) has a high magnetic susceptibility, which would give a high signal-to-noise against the two proppants (sand or ceramic) we studied [Citation15]. The quantity of the NPs that would be required for differentiation against the background levels in the proppant pack was calculated to be 0.269 g/L for sand and 1.01 g/L for ceramic. This means 15,000 kg of nMag would be required per well using sand proppant or 56,000 kg of nMag using ceramic proppant. Moreover, intervals of a typical shale gas reservoir rock were shown to have a higher magnetic susceptibility, which would necessitate at least 86,400 kg of nMag per well at ambient temperatures in order to provide contrast with the reservoir [Citation15]. Subsequent work showed that mixtures of proppants and nanoparticles (60-70 nm with an iron oxide core and carbon shell) can characterize small fractures in some carbonates and shales [Citation16]. Recently, Kanji and Kosynkin have reported that nMag type materials could be used for typical carbonate reservoirs [Citation17]. In this case the detection limit is similar to that we have calculated for sand proppant [Citation15].
Based upon these studies it would initially appear that while nMag can be used for imaging against typical sandstone or limestone oil reservoirs, it would be cost prohibitive for shale. Fortunately shale generally contains a large proportion of paramagnetic clays, such as illite, whose magnetic susceptibility decreases significantly with increasing temperature according to the Curie law [Citation18,Citation19]. This means that far less nMag would be required at typical shale reservoir temperatures, which are typically 120–150 °C [Citation20,Citation21]. For example, at 150 °C the mass magnetic susceptibility of a shale comprising 80% illite and 20% quartz will decrease to about 0.7 of the value at 20 °C according a model template given by Ali and Potter [Citation19]. This would mean that only around 63,000 kg of nMag would be required per well under these circumstances. Nevertheless this level of nMag additive would still essentially be impractical. One approach to overcome this issue is to choose a magnetic NP with a significantly higher magnetic susceptibility than nMag.
There is a wide range of magnetic NPs reported especially in the spinel ferrite class. In view of the temperature conditions of typical reservoirs an important consideration will be the temperature dependence of the magnetic susceptibility of the ferrite NPs. In particular, it would be useful to know the Curie temperature of the ferrites, where the magnetic susceptibility drops close to zero (there may still be a small magnetic susceptibility due to paramagnetic behaviour beyond the Curie temperature). Superparamagnetic Mn–Zn ferrite (MnxZn1−xFe2O4) NPs have been shown to have a high magnetic susceptibility [Citation22], and their use in ferrofluids has been demonstrated [Citation23]. Prior synthetic strategies have included co-precipitation [Citation24–27], hydrothermal processing [Citation28,Citation29], and sol-gel [Citation30]. NPs produced by hydrothermal synthesis show a broad particle size distribution (4–18 nm) [Citation29], while those prepared by co-precipitation show a dependence on the composition and particle size, but also appear highly agglomerated. Jang et al. [Citation31] have reported that the high magnetism of ZnxMn1−xFe2O4 ferrite nanoparticles can be very effectively modulated and achieved by Zn2+ dopant control. Their synthesis involved both halide and acetylacetonate (acac) complexes and the goal was the formation of highly uniform particles for medical imaging applications. We have previously reported the synthesis of Mn–Zn ferrite NPs using the thermal decomposition of only the appropriate metal acetylacetonate complexes [Citation32]. These NPs were shown to be highly crystalline and of uniform particle size, and the surface functionalization ensures dispersion in a wide range of solvents, including the ability to optimize transportation through a reservoir [Citation7]. We have reported that the synthetic route used for Mn–Zn ferrite NPs has a significant control over their morphology and composition [Citation32], and demonstrated the scalability of the process for magnetite NPs [Citation33]. We are interested in determining if the NPs prepared by our modified synthetic route also effects the magnetization of the NPs.
In this study the dependence of mass susceptibility and mass magnetization on temperature of various ternary manganese and zinc ferrites (Mn–Zn ferrite, MnxZn1−xFe2O4) were studied, along with their binary homologs (MxFe3−xO4, where M = Mn or Zn). Using this data we have determined the amount of these ferrites per well in order to provide contrast with the reservoir. The superparamagnetic ferrite contrast agents described in this paper could be applied not only in hydrocarbon reservoirs, but also in water reservoirs.
2. Experimental procedure
2.1. Materials
Fe(acac)3 (97%), Mn(acac)2, and Zn(acac)2·x(H2O) hydrate, were obtained from Sigma Aldrich and used without further purification. Oleic acid [CH3(CH2)7CH=CH(CH2)7CO2H, 90%], oleylamine ([CH3(CH2)7CH=CH(CH2)8NH2, > 70%], 1,2-hexadecanediol [CH3(CH2)13CH(OH)CH2OH, HDD], benzyl ether (98%), and hexanes (mixture of isomers) were all purchased from Aldrich and used as received. Ethanol (200 proof) from Decon Laboratories Inc. was used as received.
2.2. Nanoparticle synthesis
The synthesis used for the Mn–Zn ferrite, Mn ferrite and Zn ferrite NPs is a thermal decomposition reaction of the appropriate metal acetylacetonate complexes [Citation32]. It is carried out in an oxygen-free three-necked round bottom flask. The overall ratio of metal (2 mmol) to surfactant was kept constant. In a general synthesis, 1,2-hexadecanediol (0.3876 g, 1.5 mmol), oleic acid (951.1 µL, 3 mmol), and oleylamine (987.1 µL, 3 mmol) in benzyl ether (37.5 mL, 197.28 mmol) was used for each run. When all chemicals were added argon was flushed through the system to remove any oxygen. The system was then heated to 200 °C at a rate of 10 °C/min. Once at 200 °C, heating was held constant for two hours. After two hours, heating was increased to reflux at the same rate of 10 °C/min. Once refluxing, heating was held constant for one hour. After one hour, the heating was turned off and the entire system was cooled to room temperature. Ethanol (40 mL) was added to the solution to precipitate out the NPs. The solution was then split into 50 mL centrifuge tubes and centrifuged. The supernatant was discarded and ethanol (15 mL) was added to each tube to wash the NPs. The samples were centrifuged and washed twice more, discarding the supernatant each time. Our previous work [Citation32] showed that this was sufficient to remove contaminants. After washing, the NPs were allowed to air-dry overnight and then suspended in hexanes.
2.3. Characterization
Size determination of the nanoparticles was achieved by small angle X-ray scattering (SAXS) using a Rigaku SmartLab X-Ray diffractometer using a Cu-Kα radiation source. Samples were prepared by sealing a concentrated NP solution in hexanes into a 1 mm ‘Glass Number 50 Capillary’ tube (Hampton Research Inc.) and the data was resolved using Rigaku's NANO-solver. Inductively coupled plasma-optical emission spectroscopy (ICP-OES) measurements were obtained on a Perkin Elmer Optima 4300DV. Samples were prepared by digesting 0.5 mL of concentrated NP solution in 9.5 mL of concentrated nitric acid. An aliquot of the digested solution (0.5 mL) was diluted into 9.5 mL of NANOpure™ water. ICP standards were obtained from Inorganic Adventures and diluted using NANOpure™ water. X-ray photoelectron spectroscopy (XPS) was conducted via a PHI Quantera X-ray photoelectron spectrometer using an aluminium X-ray source at 1486.7 eV. Samples were prepared by first drying the sample and then placing it on a small piece of indium foil. Data was analysed via MultiPak.
2.4. Magnetic measurements
Mass susceptibility and mass magnetization studies were performed on a Quantum Design MPMS SQUID System. The range of magnetic field used was from −930 to 930 mT in 35 mT increments. Samples were prepared by grinding a powdered form of the NPs into a uniform powder and weighing out the sample on a small piece of commercial grade ½ inch wide TaegaSeal PTFE tape. The tape was then carefully folded around the sample and rolled into a small oblong shape. Quartz wool was put into the copper sample holder followed by the sample and more quartz wool. This is to prevent the sample from moving too much during measurements. Temperature dependent magnetic hysteresis curves were also obtained for the NPs using a variable field translation balance (VFTB) at the University of Alberta. This type of VFTB used an electromagnet (rather than a solenoid) in order to generate higher fields. The nanophase particles were mixed with calcium fluoride powder and this mixture was then poured into the sample containers in order to obtain the measurements. The calcium fluoride powder provides a good medium in which to disperse the particles to minimize interactions between the nanophase particles, and also provides an inert matrix for the temperature measurements.
3. Results and discussion
3.1. Magnetic measurements of Mn–Zn ferrite NPs
We have previously shown that for Mn–Zn ferrite NPs the composition is controlled by the relative ratio of the reagents [Citation32], making it possible to prepare a range of controlled compositions. As with our prior work and that of others [Citation26,Citation27,Citation29,Citation34] the iron precursor concentration was maintained constant, while the relative amounts of the Mn and Zn precursors [Mn(acac)2 and Zn(acac)2, respectively] were varied. Samples were prepared with nominal reagent composition of MnxZn1−xFe2O4 and the Mn:Zn ratio was determined by ICP-OES [Citation32].
It is important that the NP size (av. 7 nm) is not affected by composition if meaningful comparisons are to be made. In larger particles surface effects become competitive [Citation22,Citation34]. As shown in , there was no significant trend or change in NP size (as determined by SAXS) as a function of Mn:Zn ratio [Citation32]. This is unlike the observation of NPs prepared using co-precipitation [Citation26,Citation27,Citation34]. In addition, the present NPs are smaller (and show a narrower size distribution) than those prepared by hydrothermal methods [Citation28]. Finally, it is worth noting that the Mn–Zn ferrite NPs (7 ± 1 nm) are smaller than those of nMag prepared under identical conditions (11.82 nm) [Citation32].
Figure 1. Dependence of Fe–Mn–Zn–O nanoparticle (MnxZn1−xFe2O4) size as a function of the Mn composition (x) used in the reaction.
In the Mn–Zn ferrite spinel the magnetic ordering is due to a super-exchange interaction between the metal ions in the A (tetrahedral) and B (octahedral) sites [Citation35]. The introduction of the weakly magnetic Zn, which has a preference for the tetrahedral A site, affords a reduction of the magnetic exchange interaction between the sites. Thus, it is expected that altering the Zn content will result in a change in the magnetic properties of the NPs.
The mass magnetization for the Mn–Zn ferrite NPs was initially measured at 27 °C, and 125 °C using a SQUID, and a representative plot for a sample measured at 27 °C is shown in . One of the goals of this study was to determine what Mn–Zn ferrite NP would allow for the highest magnetic susceptibility versus the potential background of our two previously studied proppants (diamagnetic sand or paramagnetic ceramic proppant) [Citation15].
Figure 2. Selected hysteresis plot of mass magnetization (Am2/kg) as a function of applied field (mT) for Mn–Zn ferrite NPs (Mn0.35Zn0.65Fe2O4) at 27 °C.
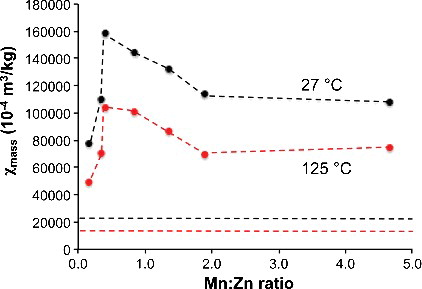
shows the plot of the mass susceptibility (χmass) as a function of the Mn:Zn ratio (in MnxZn1−xFe2O4) at a low magnetic field (17.5 mT) at both 27 °C and 125 °C. Nanoscale magnetite (i.e. no Mn or Zn) has a lower, positive mass susceptibility (straight lines in ), while the Mn–Zn ferrite compositions have higher positive magnetic susceptibilities. As the Mn:Zn ratio initially increases (i.e. increase of x in MnxZn1−xFe2O4) the mass susceptibility increases dramatically. However, above a ratio of 0.4 (i.e. Mn0.28Zn0.72Fe2O4) further increase in the amount of manganese results in the mass susceptibility decreasing slightly, reaching a plateau above Mn:Zn ≈ 2.
Figure 3. A plot of mass susceptibility (χmass) as a function of Mn:Zn ratio for Mn–Zn ferrite NPs at 27 °C (black) and 125 °C (red) in a low applied magnetic field of 17.5 mT. The dashed line represents the values for nMag.
A potentially better indication of how composition affects magnetic properties would be to look at the changes in mass magnetization (Mmass) as the quantities of manganese and zinc are varied in relation to each other. If just the mass magnetization is observed at a high applied magnetic field (930 mT) there is only a small variation across compositional differences (). Although ill defined, the maximum values occur for a Mn:Zn ratio between 0.4 and 2. Thus, in our high temperature synthesis (200 °C) the maximum mass magnetization is observed for relatively Zn rich materials. This is in agreement with the results of Jang et al. who reported a maximum saturation magnetization at a Mn:Zn ratio = 1.5 [Citation31]. A value within our range was also reported for Mn–Zn ferrite NPs prepared by hydrothermal synthesis (180 °C) in which a maximum magnetization intensity was observed for a Mn:Zn = 0.66. This is in direct contrast to the results reported for Mn–Zn ferrite NPs prepared by precipitation [Citation26,Citation27,Citation34]. In that case, there was a distinct maximum at Mn:Zn = 4. Thus the data for co-precipitated samples (80 °C) suggest that maximum mass magnetization occurs in Mn rich compositions [Citation26,Citation34].
Figure 4. A plot of mass magnetization (Mmass) as a function of Mn:Zn ratio of Mn–Zn ferrite nanoparticles at 27 °C in a high applied magnetic field of 930 mT. The lower dashed line represents the values for nMag.
Two observations should be made here. First, it would appear that the temperature of synthesis has a factor in determining the composition at which the mass magnetization reaches a maximum, which will have an impact to the choice of large-scale synthesis [Citation33]. Second, such a change in the dependence of magnetization on composition suggests that the site occupancy of Mn and Zn in A and B sites in the spinel lattice are altered by the temperature of reaction (see below).
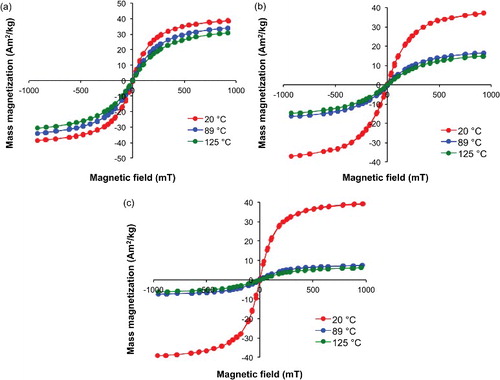
As noted above, if NPs are to be used as tracers in the reservoir [Citation9,Citation10] then it is their properties at reservoir temperatures (120-150 °C) that are important [Citation20,Citation21]. In order to accomplish this magnetic hysteresis plots of the NP samples were measured at different temperatures using a variable field translation balance (VFTB). shows the temperature dependence of magnetic hysteresis plots of mass magnetization measured as a function of applied field for selected Mn–Zn ferrite NPs. It can be seen that while the mass magnetization at 20 °C is very similar irrespective of the Mn:Zn ratio (c.f. ), the temperature dependence varies significantly.
Figure 5. Hysteresis plots of mass magnetization (Am2/kg) as a function of applied field (mT) from the VTFB at 20, 89, and 125 °C for Mn–Zn ferrite NPs: (a) Mn0.63Zn0.37Fe2O4, (b) Mn0.35Zn0.65Fe2O4, and (c) Mn0.13Zn0.87Fe2O4.
The change in mass magnetization with temperature (EquationEq. 1(1)
(1) ) as a function of Mn:Zn ratio is shown in . The percentage change of the mass magnetizations at the two different temperatures decreases with increasing Mn content. This means there is a greater drop in mass magnetization as the Zn content increases.
(1)
(1) The temperature at which the thermomagnetic coefficient (kT = −ΔMmass/ΔT) changes decreases with the increase in zinc substitution. The effect is likely related to the Curie temperature, which increases with increasing Mn content (decreasing Zn content), as shown in . The Curie temperatures were determined using a Bartington magnetic susceptibility system comprising a MS2W sensor, MS2WF furnace and MS2 meter.
Figure 6. A plot of the change in mass magnetization from the VFTB results between 20 and 125 °C (%) as a function of Mn:Zn ratio in Mn–Zn ferrite NPs (R2 = 0.9562).
Figure 7. A plot of the Curie point as a function of Mn:Zn ratio in Mn–Zn ferrite NPs (R2 = 0.8667).
3.2. Magnetic measurements of Mn ferrite NPs and Zn ferrite NPs
In order to better understand the effect of manganese or zinc substitution on both the mass susceptibility and mass magnetization, as well as the changes of the aforementioned as temperature increases, a series of Mn ferrite and Zn ferrite nanoparticles with different Fe:M ratios (where M = Mn or Zn in ferrites of composition MxFe3−xO4) were synthesized and studied. summarizes the physical and magnetic properties of Mn ferrite NPs. The diameter of the Mn ferrite NPs obtained from SAXS shows no change as the manganese content is increased. They are towards the high end of the range observed for Mn–Zn ferrite NPs prepared in an analogous manner [Citation32]. shows there is a slight decrease in mass susceptibility with increased Mn, but there is greater temperature dependence in the mass susceptibility than observed for Mn–Zn ferrite NPs, although the latter does not change dramatically as composition is altered. The change of mass magnetization with temperature is small, but appears to be similar to that observed for Mn–Zn ferrite NPs.
Table 1. Summary of particle size, mass susceptibility and mass magnetization for Mn ferrite NPs.
lists the mass susceptibility and mass magnetizations at different temperatures of Zn ferrite NPs, along with their particle size. The size of Zn ferrite nanoparticles is not as constant across a range of compositions, as compared to Mn–Zn and Mn ferrite NPs. As the zinc content in the Zn-ferrite NPs is increased, there is a marked decrease in mass magnetization, which is nearly linear (). This trend does not obviously match the trend seen with Mn–Zn ferrite NPs. There is also significant temperature dependence in the magnetization for the Zn ferrite NPs (). A large temperature dependence has been proposed to be a consequence of the uniform distribution of the cations across the A and B sites in the spinel structure, which is counter to the strong preference of the Zn2+ to occupy only the A sites [Citation36].
Table 2. Summary of particle size, mass susceptibility and mass magnetisation for Zn ferrite NPs.
Note that bulk Zn ferrite only has BB interactions, due to the distribution of Zn into only the A sites and Fe into only the B sites, whereas nanoscale Zn ferrite redistributes both the Zn and Fe into both A and B sites, giving rise to the increase in AB interactions and thus an increase in magnetization and mass susceptibility over the bulk Zn ferrite [Citation37–39]. These AB interactions, however, tend to be ferrimagnetic, which means that as the Zn content increases in Zn ferrite nanoparticles, the mass susceptibility decreases as seen in .
3.3. Detection with regard to reservoir geology
One of the key questions is whether magnetic NPs could ever be practical for hydrocarbon or water reservoir imaging. We have previously shown that the quantity of the n-Mag that would be required for differentiation against the background levels of the reservoir was calculated to be 0.269 g/L for sandstone and between 1.56-13.2 g/L for shale [Citation15]. Based on the above results, a NP with the composition Mn0.28Zn0.72Fe2O4 (i.e., zinc rich) would show the highest sensitivity, i.e., 7.6x that of nMag at 27 °C (see ). This would mean that a decrease in the concentration of NPs would be needed per well to 35 mg/L for sandstone and 0.205–1.73 g/L for shale. While this is a considerable improvement over nMag, it would still be impractical for shale reservoirs.
As noted in the Introduction, the downhole mass magnetic susceptibility of a shale comprising 80% illite and 20% quartz will decrease to about 0.7 of the value at 20 °C [Citation19]. However, as shown in , the mass magnetic susceptibility of Mn0.28Zn0.72Fe2O4 would decrease to 0.66 of its value at typical reservoir temperatures. Thus, its advantage would be partially reduced. Our results show that a NP with Mn-rich composition closer to Mn0.63Zn0.37Fe2O4 would show a sensitivity 6.5× that of nMag at 127 °C (see ). This would mean that the concentration per well of NPs for downhole detection would be 41 mg/L for sandstone and 1.75-2.02 g/L for shale.
4. Conclusions
The Mn–Zn ferrites give a significantly higher mass magnetic susceptibility signal compared to the nMag described in our previous work [Citation15]. While there is an increase in mass susceptibility for the best composition (Mn0.28Zn0.72Fe2O4) over nMag at room temperature (7.6x), the greater decrease as a function of increased temperature means that under downhole conditions the sensitivity is reduced slightly to 6.5x over that of nMag. This means that even using superparamagnetic NPs such as Mn–Zn ferrite, a large volume of NP tracers would be needed for downhole imaging of shale reservoirs. However, the decrease in magnetic susceptibility of the paramagnetic clays in the shale at reservoir temperatures would help increase the signal-to-noise of the Mn–Zn ferrite nanoparticles, thus requiring somewhat lower volumes of NP tracers. Most importantly, this work shows that for non-shale reservoirs replacement of nMag by Mn–Zn ferrites will allow for significant signal-to-noise enhancement .
Disclosure statement
No potential conflict of interest was reported by the authors.
Additional information
Funding
References
- OPEC. 2014 World Oil Outlook. Vienna: OPEC; 2014.
- Nicot JP. Scanlon BR. Water use for shale-gas production in Texas, U.S.. Environ Sci Technol. 2012;46:3580–3586.
- Dammel JA, Bielicki JM, Pollak MF, et al. A tale of two technologies: hydraulic fracturing and geologic carbon sequestration. Environ Sci Technol. 2011;45:5075–5076.
- Sahimi M. Flow and transport in porous media and fractured rock: from classical methods to modern approaches second, revised, and Enlarged edition. Weinheim, Germany: Wiley-VCH; 2012.
- Nguyen PD, Fulton DD, inventor. Halliburton Energy Services, Inc., assignee. Electroconductive proppant compositions and related methods. United States patent 7,073,581. 2006 Jul 11.
- McDaniel RR, McCarthy SM, Smith M, inventor. Methods and compositions for determination of fracture geometry in subterranean formations; Momentive Specialty Chemicals Inc., assignee. US Patent, 8129318, 2012 Mar 6.
- Maguire-Boyle SJ, Garner DJ, Heimann JE, et al. Automated method for determining the flow of surface functionalized nanoparticles through a hydraulically fractured mineral formation using plasmonic silver nanoparticles. Env Sci Process Impact. 2014;16:220–231.
- Barron AR, Tour JM, Busnaina AA, et al. Big things in small packages. Oilfield Rev. 2010;3:38–49.
- Cocuzza M, Pirri C, Rocca V, et al. Current and future nanotech applications in the oil industry. Am J Appl Sci. 2012;9:784–793.
- Byerlee JD, Johnston MJS. A magnetic method for determining the geometry of hydraulic fractures. Pure Appl Geophys. 1976;114:425–433.
- Zawadzki J, Bogacki J. Smart magnetic markers use in hydraulic fracturing. Chemosphere. 2016;162:23–30.
- Khalil M, Jan BM, Tong CW, et al. Advanced nanomaterials in oil and gas industry: design, application and challenges. Appl Energy. 2017;191:287–310.
- Sun C, Lee JSH, Zhang M. Magnetic nanoparticles in MR imaging and drug delivery. Ad Drug Delivery Rev. 2008;60:1252–1265.
- Roca AG, Veintemillas-Verdaguer S, Port M, et al. Effect of nanoparticle and aggregate size on the relaxometric properties of mr contrast agents based on high quality magnetite nanoparticles. J Phys Chem B. 2009;113:7033–7039.
- Morrow L, Potter DK, Barron AR. Detection of magnetic nanoparticles against proppant and shale reservoir rocks. J Exp Nanosci. 2015;10:1028–1041.
- Aderibigbe A, Cheng K, Heidari Z, et al. Application of magnetic nanoparticles mixed with propping agents in enhancing near-wellbore fracture detection. J Petrol Sci Eng. 2016;141:133–143.
- Kanji MY, Kosynkin DV. Proc. SPIE 9467, Micro- and Nanotechnology Sensors, Systems, and Applications VII, 94671D. 2015. DOI:10.1117/12.2179249.
- Ali A, Potter DK. Model templates for quantifying permeability controlling paramagnetic clay minerals at in situ reservoir temperatures. International Symposium of the Society of Core Analysts. Austin, TX, USA: Paper SCA2011-47, 6 pages; 2011.
- Ali A, Potter DK. Temperature dependence of the magnetic properties of reservoir rocks and minerals and implications for in situ borehole predictions of petrophysical parameters. Geophysics. 2012;77:WA211–WA221.
- Kargbo DM, Wilhelm RG, Campbell DJ. Natural gas plays in the Marcellus shale: challenges and potential opportunities. Environ Sci Technol. 2010;44:5679–5684.
- Jarvie DM, Hill RJ, Ruble TE, et al. Unconventional shale-gas systems: The Mississippian Barnett Shale of north-central Texas as one model for thermogenic shale-gas assessment. AAPG Bulletin. 2007;91:475–499.
- Rath S, Anand RP, Das KK, et al. Dependence on cation distribution of particle size, lattice parameter, and magnetic properties in nanosize Mn–Zn ferrite. J Appl Phys. 2002;91:2211.
- Jayadevan B, Chinnasamy CN, Shinoda, K, et al. Mn–Zn ferrite with higher magnetization for temperature sensitive magnetic fluid. J Appl Phys. 2003;93:8450.
- Auzans E, Zins D, Blums E, et al. Synthesis and properties of Mn-Zn ferrite ferrofluids. J Mater Sci. 1999;34:1253–1260.
- Auzans E, Zins D, Maiorov MM, et al. Properties of Mn–Zn ferrite nanoparticles for aqueous ferrofluids. Magn Girdrodin. 1999;36:78–86.
- Arulmurugan R, Vaidyanathan G, Sendhilnathan S, et al. Decoupled superconductivity in the four- and five-layered ferromagnet–superconductor nanostructures and control devices. J Magn Magn Mater. 2006;298:83–88.
- Arulmurugan R, Vaidyanathan G, Sendhilnathan S, et al. Preparation and properties of temperature-sensitive magnetic fluid having Co0.5Zn0.5Fe2O4 and Mn0.5Zn0.5Fe2O4 nanoparticles. Physica B. 2005;368:223–230.
- Rozman M, Drofenik M. Hydrothermal synthesis of manganese zinc ferrites. J Am Ceram Soc. 1995;78:2449–2455.
- Xuan Y, Li Q, Yang G. Synthesis and magnetic properties of Mn–Zn ferrite nanoparticles. J Magn Magn Mater. 2007;312:464–469.
- Thakur A, Singh M. Preparation and characterization of nanosize Mn0.4Zn0.6 Fe2O4 ferrite by citrate precursor method. Ceram Int. 2003;29:505–511.
- Jang J-T, Nah H, Lee HJ-H, et al. Critical Enhancements of MRI Contrast and Hyperthermic Effects by Dopant-Controlled Magnetic Nanoparticles. Angew Chem. 2009;121:1260.
- Orbaek W, Morrow L, Maguire-Boyle SJ, et al. Reagent control over the composition of mixed metal oxide nanoparticles. J Exp Nanosci. 2015;10:324–349.
- Morrow L, Barron AR. Issues affecting the synthetic scalability of ternary metal ferrite nanoparticles. J Nanoparticles. 2015;2015:105862. DOI:10.1155/2015/105862.
- Arulmurugan R, Jeyadevan B, Vaidyanathan G, et al. Effect of zinc substitution on Co–Zn and Mn–Zn ferrite nanoparticles prepared by co-precipitation. J Magn Magn Mater. 2005;288:470–477.
- Lima E Jr, Brandl AL, Aerlaro AD, et al. Spin disorder and magnetic anisotropy in Fe3O4 nanoparticles. J Appl Phys. 2006;99:083908.
- Rath C, Sahu KK, An S, et al. Preparation and characterization of nanosize Mn–Zn ferrite. J Magn Magn Mater. 1999;202:77–84.
- Zhou ZH, Xue JM, Wang J, et al. NiFe2O4 nanoparticles formed in situ in silica matrix by mechanical activation. J Appl Phys. 2002;91:6015.
- Deraz NM, Alarifi A. Microstructure and magnetic studies of zinc ferrite nano- particles. Int J Electrochem Sci. 2012;7:6501–6511.
- Shim JH, Lee S, Park JH, et al. Coexistence of ferrimagnetic and antiferromagnetic ordering in Fe-inverted zinc ferrite investigated by NMR. Phys Rev B. 2006;73:064404.