
 ?Mathematical formulae have been encoded as MathML and are displayed in this HTML version using MathJax in order to improve their display. Uncheck the box to turn MathJax off. This feature requires Javascript. Click on a formula to zoom.
Abstract
Toxic effects of nanoparticles on human health are considerably increasing their worldwide recognition. Currently silver nanoparticles are being widely used in consumer medical products, due to its uniqueness in biomedical applications. Uptake of these particles via various administration routes can also lead to different toxic effects. In this study, we assessed the toxic effect of 11–75 nm ranged biogenic silver nanoparticles (Bio-AgNPs) on male wistar rats by using two different administration routes namely, intraperitoneal and intravenous routes. The three different concentrations, No Observable Adverse Effect Concentration (NOAEC), Inhibitory concentration (IC50) and Total lethal concentration (TLC) was appraised at the dose range of 97.64 to 132 µg/kg for both i/p and i/v routes. There is no considerable changes in hematological parameters in i/p and i/v routes on 14th and 28th day of observation, but the increase was trivial significant for platelet count at the dose of 97–105 µg/kg (IC50) for i/p route of injection. There is no remarkable adverse impact on liver, spleen and kidney were observed in IC50 and TLC treated group, when determined by biochemical and histopathological analysis both in i/p and i/v routes treated rats. This estimation confirms that, Bio-AgNPs are not going effect the human metabolic system.
1. Introduction
Nanotoxicology has emerged as a new discipline to investigate the adverse effects of nanoparticles. In view of the fact that nano-sized particles have been shown to be comparatively more toxic than other size particles. In addition, different size and shape silver nanoparticles have different toxicities [Citation1]. In the recent years, the uses of silver nanoproducts in human activities have been gradually increasing [Citation2]. Because of this, significantly the study on biological effect of nanoparticles and especially their effects on animal and human organisms is also increasing [Citation3]. According to the experiments done on a variety of metal nanoparticles, silver nanoparticles have been shown more toxicity than other metals such as iron, nickel, manganese and aluminium [Citation4].
In order to assess the acute in vivo toxicity of nanomaterials, the Organization for Economic Cooperation and Development [Citation5] guidelines recommend oral toxicity test, eye irritation, corrosion and dermal toxicity, and lethal Dose50 (LD50). In vivo toxicity studies include many parameters like, dose, route of exposure, metabolism, excretion and immune response. From the last few years, the number of ongoing nanotoxicology studies to investigate the biological pathways taken by nanoparticles and induced toxic effects have increased substantially. However, very little is known about the underlying toxicity mechanisms responsible for the toxic actions of nanoparticles [Citation2]. Induction of oxidative stress by free radical formation directly into the acidic environment of lysosomes is the most important mechanism of in vivo nanotoxicity. In case of silver nanotoxicity, hydrogen peroxide generated in vivo will react with silver nanoparticles and lead to releasing of Ag+ ions. The excess free radical generations cause the damage of cellular macromolecules through the oxidation of lipids, proteins and DNA. Injury of cell membranes results in leakage of cytoplasmic contents and necrosis [Citation6].
In biological evaluation, intravenous administration of nanoparticles is also another important route used in determine the toxicological assessment in experimental animals. De Jong et al. study reports on particle size dependent organ distribution of nanoparticles through intravenous route of administration in the tail vein of rat with diameters of 10, 50, 100 and 250 nm, respectively. Their results gave an oxidative stress in the rat’s liver cells. The 10 nm nanoparticles showed the most widespread presence in the various organ systems including brain, heart, kidneys, lungs, testis and thymus [Citation7].
Park et al. state that in mice treated orally with different sizes of silver nanoparticles 1 mg/kg body weight for 14 days, small particles in brain, lung, liver, kidneys and testis were found while large particles were not identified in these tissues [Citation8]. Guo et al. have shown that chronic, repeated exposure to small size silver particles increased the mucins production in nasal respiratory mucosa suggesting the importance of mucus in defence against air pollutants [Citation9]. Another study showed that silver nanomaterials had negligible impact on the nasal cavity and lungs [Citation10].
The present study was performed to evaluate the toxic effects of Bio-AgNPs in male wistar rats. Toxicity was determined through performing at three different concentrations, that is, no observable adverse effect concentration (NOAEC), inhibitory concentration (IC50) and total lethal concentration (TLC) at the dose range 97.64–132 µg/kg for both i/p and i/v routes in 14th and 28th day of observations. Toxicity was evaluated through determination of serum ALT, AST, ALP and serum creatnine. Changes in body weight, organ weight to body weight ratios, haematology testes and histopathological examination for liver, kidney, spleen and brain organs have been carried as well.
2. Materials and method
2.1. Animals
Specific disease free, 12–13 weeks old male Wistar rats were purchased from Mahaveera Enterprises, Hyderabad, India. Animals are selected within a weight range of 160–200 g for each group and acclimatised for one week prior to the initiation of treatment. During this acclimatisation period, the health status of the rats was monitored daily. The animals were housed under standard conditions of temperature (24 ± 1 °C) and relative humidity (55 ± 10%), respectively, in 12 h light/dark cycles. During treatment, animals were housed in cages with stainless steel mesh lids. Animals were fed with commercially available standard pellet diet (VRK Nutrition Solutions, Sangli, Maharashtra, India Ltd.,). Drinking water was supplied to the animals, ad libitum.
Toxicity studies were performed at Luqman College of Pharmacy, Kalaburagi, India. Animal handling was performed according to Good Laboratory Practice. The study protocol was approved by Institute Animals Ethics Committee (Approval number: 346/CPCSEA).
2.2. Biosynthesis of silver nanoparticles
Enterococcus faecalis culture was inoculated in sterilised Luria-Bertani broth and incubated at 37 °C for 72 h. Culture was centrifuged at 10,000 rpm for 10–15 min to separate supernatant from pellet. The bacterial supernatant was added separately to the reaction vessels’ containing 100 mM (v/v) silver nitrate [Citation11], and controls (only with bacterial supernatant) are maintained separately to the each reaction. The reaction was carried out in for 24 h, at 37 °C, pH 7 in rotary shaker at 120 rpm at dark condition. Further, morphology and crystalline nature of synthesised nanoparticles were confirmed through UV–Visible spectrum (T90+ UV–VIS spectrophotometer, Beijing, China), Field Emission Scanning Electron Microscopy and XRD (PW3040/60 X’pert PRO, CSIR-CECRI, Karaikudi, India) analysis [Citation11].
2.3. Preparation of Bio-AgNPs
The stock solutions of 50 mg/ml of Bio-AgNPs were dissolved in double distilled water for overnight. Using 0.22 μ syringe filters stock solutions are filtered. And the filtrates are used to prepare the working standard of concentrations ranging from 1.25 to 175 μg/ml.
2.4. Dosing of Bio-AgNPs
Animals were divided in three groups of three different concentration containing six rats per group codes for Intravenous route of administration in Experiment (A) set. Another three groups for three different concentrations Bio-AgNPs, each group with six rats in Experiment (B) set codes for intraperitoneal route of administration. Experiment (A) set represents ‘Intravenous route’ shown in and Experiment (B) set codes for ‘Intraperitoneal route’ for Bio-AgNPs shown in . In both experiment sets Group A served as control (vehicle distilled water).
Table 1. Intravenous route of administration of three different concentrations for Bio-AgNPs: Experiment (A).
Table 2. Intraperitoneal route of administration of three different concentration for Bio-AgNPs: Experiment (B).
2.5 Haematology analysis
Using a standard saphenous vein blood collection technique, blood was drawn for haematology analysis (using potassium–methylenediaminetetraacetic acid collection tubes). Standard haematologic analysis was performed. For blood analysis, 300 μl of blood was collected from the rat. At 14 and 28 days, standard haematologic parameters, that is, platelet count, haematocrit, haemoglobin, red blood cell count and white blood cell count are performed [Citation12].
2.6 Effects on body weight
Every two days after injection, rats were weighed and assessed for behavioural changes.
2.7 Biochemical assay of serum
To determine the serum biochemical levels including the alanine aminotransferase (ALT/GPT), creatinine (CRE), aspartate aminotransferase (AST) and alkaline phosphatase (ALP), the whole blood was centrifuged at 3000 rpm for 15 min and assayed by an automatic biochemical analyser for 14th and 28th days samples [Citation13].
2.8 Detection of organelles weight and histological study
After 14 and 28 days, the rats were anesthetised by ether with phosphate-buffered saline and were dissected. Heart, lung, thymus, brain, kidney, liver and spleen were separated carefully and washed with sodium chloride solution and then their morphology, colour was investigated and weight of each organ is measured. To examine the grade of changes explicitly caused by Bio-AgNPs, the organ index (OX) was calculated separately by using formula [Citation14]:
where organ index (OX) may change as: heart index (HX), liver index (LiX), spleen index (SX), lung index (LuX), kidney index (KX), thymus index (TX), brain index (BX).
One rat from each group was fixed with 10% buffered formalin following phosphate-buffered saline exsanguinations. A small piece of liver, kidney, spleen and brain was fixed by 10% formalin and then embedded into paraffin, sectioned for 5–6 mm thick, and mounted on the glass microscope slides using standard histological techniques for 14th and 28th days samples along with control (untreated). The sections were stained with haematoxylin eosin and examined by light microscopy [Citation15].
2.9 Statistical analysis
All data are expressed in mean ± SD of the mean of the three independent experiments; each was carried out in triplicate, N = 6 rats per group.
3. Results and discussion
The results of synthesis of Bio-AgNPs were carried out by extracellular enzymatic method during exposure of reactants to E. faecalis extract, reduction of metal ions into nanoparticles was monitored as a result of change in the colour from yellowish white to brown. The characteristic surface Plasmon resonance of silver nanoparticles ranges between 300 and 325 nm due to excitation of Surface Plasmon vibrations. FeSEM analysis of Bio-AgNPs can be seen with core shell morphology of size 9–130 nm and it is observed that there is a marginal variation in the particle size. Maximum of the particles are in the range of 11–75 nm. The particles appear to be polydispersed in nature and are roughly spherical in shape [Citation11]. The average size and crystalline nature of the Bio-AgNPs were confirmed by studying the powder X-ray diffraction peaks. The four prominent peaks obtained at 2θ angle (Bragg reflections peaks) = 38.19°, 44.22°, 64.65° and 77.7°, corresponding fraction between the intensity of (1 1 1), (2 0 0), (2 2 0) and (3 1 1) diffraction peaks. Intensity of the (1 1 1) facets for the very sharp diffraction peak at 38.19° is considered for the face centred cubic structure. The (1 1 1) facet is extremely reactive and stable due to high rate of electron transfer. The XRD facets of the Bio-AgNPs (Ag, JCPDS card No. 04-0783) compared and indexed with standard, which was published by JCPDS file (International centre of Diffraction Data). The average crystallite size (D) of Bio-AgNPs was calculated using the Debye–Scherer equation by determining the width of the (1 1 1) and the similar Bragg reflection was found to be around 96.64 nm.
3.1 Haematology analysis
To measure the toxicity of Bio-AgNPs in treated rats, the important entity is estimation of standard haematologic parameters, that is, red blood cell count, white blood cell count, platelet count, haemoglobin level and blood clotting time. After the administration of nanoparticles, blood and its components are the first physiologic system they interact. Indeed, particles can also induce an inflammatory response and increase or decrease the activity of the immune system and alter related haematologic factors such as blood cell counts [Citation16,Citation17]. Concentration-dependent haematology results are present in for intraperitoneal (i/p) and intravenous (i/v) route of administration at 14th and 28th day of observation, respectively. For rats treated with Bio-AgNPs through intravenous route of administration, haemoglobin level, platelet count and white blood cells have changed, but no significant difference is observed for all three concentrations (NOAEC, IC50 and TLC). But in case of rats treated through i/p route of administration, shown significant decrease and changes in red blood cell count, white blood cells, haemoglobin level and platelet count for 14th day of observation, yet again for the 28th day of observation haematologic effects are normal.
Table 3. Haematology study for rat treated with biogenic nanoparticles through intravenous and intraperitoneal route of administration after 14th and 28th day of observation.
The haematologic effects of the different injection methods (i/v, i/p) in 14th and 28th day of observations are trivial diverse. This indicates that the different injection routes did not induce significant differences in haemoglobin, white blood cells red blood cells and platelet count both at 14th and 28th day [Citation12].
3.2 Effects on body weight
Variation in the body weight of rats after i/v and i/p administration of Bio-AgNPs at three different concentrations up to 28th day observation is shown in . It can be seen that i/v and i/p administration of Bio-AgNPs in the three different doses did not cause mortality, and body weight was slightly reduced up to second week of administration compared with the control group. And after 14th day of observation there is regain in the body weight was observed. In case of i/p route of administration, Bio-AgNPs (105.47 μg/kg) at a dose of total lethal concentration, induced the slight reduction in body weight but significantly lower than in the control group, this indicates the trivial toxicity of nanoparticles via intraperitoneal route of injections (, ). Furthermore, in our investigation no abnormal clinical signs or behaviour were detected in either the control or treated groups. And our study suggests that the toxicity of Bio-AgNPs is dose dependent and time dependent.
Figure 1. Change in body weight for untreated (control) and treated rats with Bio-AgNPs through (A) intraperitoneal (i/p), (B) intravenous (i/v) route of administration up to 28th day of observation. *All treatments of Bio-AgNPs (Ag) at their total lethal concentration were administered through i/v and i/p and kept in observation for 28 days; N = 6 rats per group.
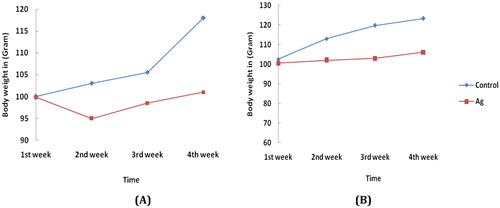
Table 4. Body weight changes for rat treated with biogenic nanoparticles through intravenous and intraperitoneal route of administration.
3.3 Biochemical assay of serum
Serum creatinine is waste product; high level of creatinine production indicates kidney damage. Bio-AgNPs (i/v route: dose in a range of 124–132 µg/kg, i/p route: dose in a range of 97–105 µg/kg) did not significantly affect serum creatinine level as compared to normal control at 14th and 28th day of observation (, ). The blood serum has large number of enzymes but to assess the normal and pathological symptoms of liver, alanine transaminse (glutamate pyruvate transaminase) and aspartate transaminases (glutamate oxalate acetate transaminase) are used. Aspatate transaminase is of mitochondrial origin present in large quantities in liver, heart, kidney and skeletal muscles. Serum alkaline phosphatase is a globulin enzyme of low molecular weight found in higher concentration in bones, hepatobiliary tract and kidney. The activity of this enzyme can be determined by the estimation of organic phosphate liberated from the glycerol phosphate. The serum level of these enzymes was increased in both hepatocellular and obstructive Jaundice. In i/v route of administration, Bio-AgNPs (42.7 mg/dl, 34.13 IU/L, 82.7 IU/L) did not significantly affect serum ALT, serum AST level and ALP level as compared to control respectively, although i/p administration showed significant increase in ALT, AST and ALP level as compared to normal control at 14th and 28th day (, ). Results of toxicity study on serum showed that Bio-AgNPs up to 28 days did not affect creatinine, ALT, AST and ALP level for i/v route of injection. In hepatic necrosis, the serum levels of AST and ALT could be expected to increase from 2- to 20-folds of the upper limit of normal depending upon intensity of liver damage, whereas Bio-AgNPs did not induce any effect compared to the control at i/v route. The liver is the target organ obviously affected moderately in i/p route by Bio-AgNPs [Citation18]. Heavy metals are toxic and therefore they inactivate the endogenous enzymes strongly by interacting with thiol groups of these enzymes [Citation19]. In addition, it is believed that nanoparticles (NPs) bind to functional groups of proteins, resulting in protein deactivation and denaturation [Citation20]. According to Al-Harbi et al. [Citation20] and Ben-Slama et al. [Citation21] rats treated with AgNPs and ZnONPs did not show any remarkable changes in creatinine level (estimated as kidney marker), respectively. Our results agreed with these reports, the unchanged levels of creatinine, indicated normal renal functions in the Bio-AgNPs exposed group (both in i/v and i/p).
Figure 2. Biochemical results for rats treated with Bio-NPs through intraperitoneal and intravenous route of administration at [A] 14th day and [B] 28th day. Note: Ag: Bio-AgNPs, i/p: intraperitoneal, i/v: intravenous. *All data are expressed in mean ± SD of the mean of the three independent experiments; each was carried out in triplicate, N = 6 rats per group.
![Figure 2. Biochemical results for rats treated with Bio-NPs through intraperitoneal and intravenous route of administration at [A] 14th day and [B] 28th day. Note: Ag: Bio-AgNPs, i/p: intraperitoneal, i/v: intravenous. *All data are expressed in mean ± SD of the mean of the three independent experiments; each was carried out in triplicate, N = 6 rats per group.](/cms/asset/5a6167fc-64ed-411d-954f-977cd83538f0/tjen_a_1502479_f0002_c.jpg)
Table 5. Biochemical assays for rat treated with biogenic nanoparticles through intraperitoneal and intravenous route of administration for 14th and 28th day of observation.
The biochemical tests revealed that Bio-AgNPs caused insignificant effects on AST, ALP and ALT in i/v route and a moderate significance effects in i/p route. Meanwhile, the results for kidney function agreed with those did not support any toxic effect of Bio-AgNPs on liver and kidney functions. We can interpret this result by that the Bio-AgNPs are small enough to be excreted easily by the kidney and therefore the organ did not suffer from its toxicity.
3.4 Detection of organelles weight and histological study
Organ weights of rat at different concentration of Bio-AgNPs doses illustrate the effect of nanoparticles on organs. Due to the prevalence of phagocytic cells in their reticulo-endothelial system in the liver and the spleen organs, these two are most exposed organs to nanomaterials. In addition, the organs with high blood flow such as kidneys and lungs can be affected [Citation22]. In our reports, it can be seen that the weights of the heart, liver, spleen, lung, kidneys and brain are decreased in rats treated with Bio-AgNPs at the dose range as shown in and , but not significantly reduced as compared to the control. However, the weight of the thymus is increased in Bio-AgNPs treated rat with increased concentration (in total lethal concentration) at 14th and 28th day of observation. To further consideration the organ reaction and grade of changes were examined by calculating organ index (OX) of each organ separately. The organ index for heart, liver, spleen, lung, kidneys, brain and thymus are present in .
Table 6. Weight of organs or organ index (OrganX) for rat treated with biogenic nanoparticles through intraperitoneal and intravenous route of administration for 14th and 28th day of observation.
The average values of thymus index in the control group were 0.18 and in the Bio-AgNPs treated group increased to 0.64 and 0.94 for IV and IP route, respectively, at a TLC dose. There are still no statistically significant differences between the treated group and the control group, which shows that injections of Bio-AgNPs at different doses do not cause obvious toxicologic effects on heart, liver, spleen, lung, kidneys and brain. The spleen index is decreased by intraperitoneal injection, and increased by intravenous administration in case of Bio-AgNPs treatment only for 14th day of observation. In case of i/p Bio-AgNPs administration, immune system of rat is recurring to the normal level after 14th day, this specifies the effect is not prolonged in this case (). This is in accordance with our previous finding indicating the absence of toxic signs and mortality in adult rats exposed to AgNPs [Citation23,Citation24]. Some differences for spleen and thymus weights were observed with both i/v and i/p administration in the Bio-AgNPs treated rats. The spleen index is decreased by intraperitoneal injection and increased by intravenous administration with negligible disparity only for 14th day of observation as compared to the control, comparable results were obtained in H&E staining, confirms the non-toxic nature of Bio-AgNPs towards spleen.
3.5 Toxicological changes in rats
This study was strived to identify the adverse effects of Bio-AgNPs using rats injected through i/v and i/p routes. In count, we also tried to scrutinise the effects of toxicity, at different doses and time intervals of Bio-AgNPs. Tissues for treated with Bio-AgNPs (i/v route: dose in a range of 124–132 µg/kg, i/p route: dose in a range of 97–105 µg/kg) showed no differences in the kidney (), spleen (), liver () and brain () as same as control tissues. Necropsy observations (autopsy: dissective examination of dead rat) specified that all organs of the Bio-AgNPs treated rats exhibited the anatomic features (e.g. characteristics of colour, shape and size) to be expected based on their appearance in untreated animal.
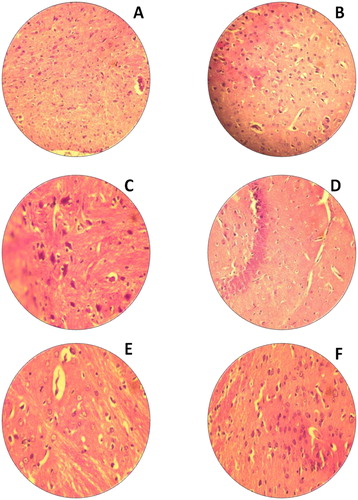
Figure 3. H&E staining of rat kidney. (A) Untreated rat for 14th day (−); (B) Untreated rat for 28th day, normal kidney tissues glomerular cells, bowman capsule (−); (C) Rats treated with Bio-AgNPs, i/p route for 14th day (−); (D) Rats treated with Bio-AgNPs, i/p route for 28th day (+); (E) Rats treated with Bio-AgNPs, i/v route for 14th day (+); (F) Rats treated with Bio-AgNPs, i/v route for 28th day (−). *where (−) indicates no changes, (+) indicates mild changes, (++) indicates moderate changes, (+++) indicates severe changes.
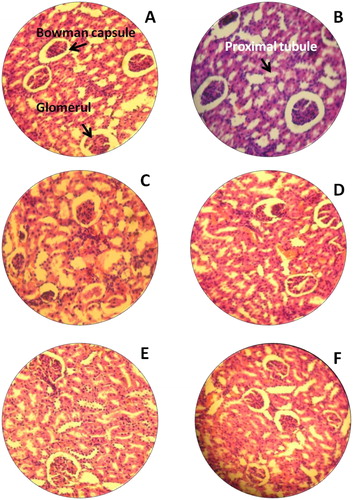
Figure 4. H&E staining of rat spleen. (A) Untreated rat for 14th day (−); (B) Untreated rat for 28th day, normal spleen tissues white palp and red palp (−); (C) Rats treated with Bio-AgNPs, i/p route for 14th day (+); (D) Rats treated with Bio-AgNPs, i/p route for 28th day (−); (E) Rats treated with Bio-AgNPs, i/v route for 14th day (−); (F) Rats treated with Bio-AgNPs, i/v route for 28th day (−). *where (−) indicates no changes, (+) indicates mild changes, (++) indicates moderate changes, (+++) indicates severe changes.
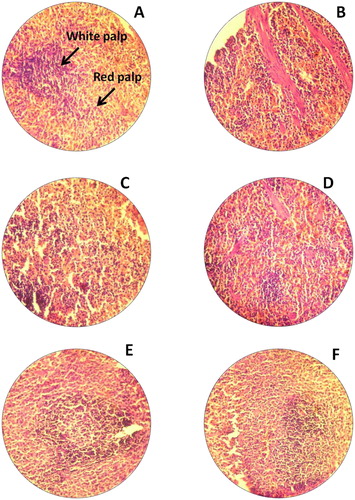
Figure 5. H&E staining of rat liver. (A) Untreated rat for 14th day (−); (B) Untreated rat for 28th day, normal liver tissues central vein and sensual (−); (C) Rats treated with Bio-AgNPs, i/p route for 14th day (+); (D) Rats treated with Bio-AgNPs, i/p route for 28th day(−); (E) Rats treated with Bio-AgNPs, i/v route 14th day (+); (F) Rats treated with Bio-AgNPs, i/v route for 28th day (−). *where (−) indicates no changes, (+) indicates mild changes, (++) indicates moderate changes, (+++) indicates severe changes.
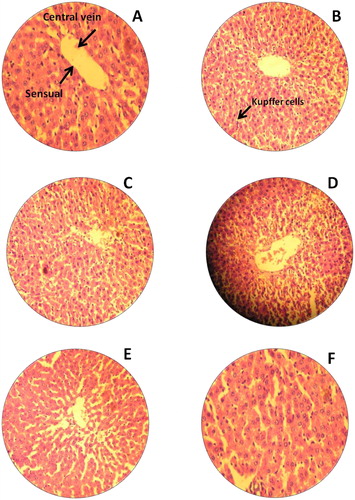
Figure 6. H&E staining of rat brain. (A) Untreated rat for 14th day (−); (B) Untreated rat for 28th day (−); (C) Rats treated with Bio-AgNPs, i/p route for 14th day (−); (D) Rats treated with Bio-AgNPs, i/p route for 28th day (−); (E) Rats treated with Bio-AgNPs, i/v route for 14th day (−); (F) Rats treated with Bio-AgNPs, i/v route for 28th day (−). *where (−) indicates no changes, (+) indicates mild changes, (++) indicates moderate changes, (+++) indicates severe changes.
Liver tissue treated with Bio-AgNPs, for 14th day of i/p route administered group showed moderate changes demonstrated by fatty changes of hepatocytes (). There is a slight improvement and significant hepatoprotective activity was observed in 28th day as compared to that 14th day (). On 14th day onwards, restoration of normal hepatic architecture is taken place in Bio-AgNPs treated animals.
Bio-AgNPs treated spleen tissue did not show any changes in its morphology (). In H&E-stained brain sections of rats by i/v and i/p administration showed no changes in multiple brain regions, including most prominently the olfactory bulb (perivascular localisation) and the choroid plexus and ependyma of the lateral ventricles ().
4. Conclusions
An animal toxicity study using 11–75 nm sized biogenic silver nanoparticles (Bio-AgNPs) in male wistar rat was carried out. Animal survival, animal weight, haematology, organ weight and there histopathology were characterised at range of 97.64–132 µg/kg for both i/p and i/v routes over 14–28 days. The results show that Bio-AgNPs at low concentrations (i.e. NOAEC and IC50) do not cause appreciable toxicity even after their breakdown in vivo over time both in i/v and i/p infusions. Increasing concentrations of Bio-AgNPs at a dose of total lethal concentration (105.47 μg/kg) in i/p route of administration, induced the slight reduction in body weight but significantly lower than the control group, this indicates the trivial toxicity of nanoparticles via intraperitoneal route of injection, but from 14th day onwards again the animal regained their body weight with normal healthy conditions. In our investigation, enzyme activity, organ index and histopathological studies shows no severe changes in Bio-AgNPs (i/v route) treated rats for 14th and 28th day of observation. Moderate effects on organ index have been observed at high concentration at i/p route of infusion in rats. Moreover, of the two different administration routes, the intraperitoneal injection show the moderate toxicity up to 14th day of observations, and intravenous injection shows the no toxicity. Considering the results of all of these studies, targeting biogenic silver nanoparticles by intravenous injection is promising for possible biomedical application. And our study also concludes that Bio-AgNPs (dose range 97.64–132 μg/kg) are safe and non-toxic to the animals. According to our previous report [Citation11] the potential antibacterial dose of Bio-AgNPs ranges from 3 to 16 μg/kg were recorded against both gram-positive and gram-negative pathogens. This estimation confirms that the antibacterial doses are more potential against pathogenic bacteria and is not going effect the human metabolic system.
Acknowledgements
We are thankful to Dr. Syed Sanaullah, Principal, Luqman College of Pharmacy, Gulbarga, for providing the necessary facilities and support.
Disclosure statement
No potential conflict of interest was reported by the authors.
Additional information
Funding
References
- Sardari RR, Zarchi SR, Talebi A, et al. Toxicological effects of silver nanoparticles in rats. Afr J Microbiol Res. 2012;6(27):5587–5593.
- Bakand S, Hayes A, Dechsakulthorn F. Nanoparticles: a review of particle toxicology following inhalation exposure. Inhal Toxicol. 2012;24(2):125–135.
- Reidy B, Haase A, Luch A, et al. Mechanisms of silver nanoparticle release, transformation and toxicity: a critical review of current knowledge and recommendations for future studies and applications. Materials. 2013;6(6):2295–2350.
- Pavagadhi S, Sathishkumar M, Balasubramanian R. Uptake of Ag and TiO2 nanoparticles by zebrafish embryos in the presence of other contaminants in the aquatic environment. Water Res. 2014;55:280–291.
- OECD. Test guideline 405. Acute eye irritation and corrosion. OECD guidelines for the testing of chemicals Paris. France: Organization for Economic Cooperation and Development. Organization for Economic Cooperation and Development (OECD); 2002.
- Singh RP, Ramarao P. Cellular uptake, intracellular trafficking and cytotoxicity of silver nanoparticles. Toxicol Lett. 2012;213:249–259.
- De Jong WH, Hagens WI, Krystek P, et al.. Particle size-dependent organ distribution of gold nanoparticles after intravenous administration. Biomaterials. 2008;29(12):1912–1919.
- Park EJ, Bae E, Yi J, et al. Repeated-dose toxicity and inflammatory responses in mice by oral administration of silver nanoparticles. Environ Toxicol Pharmacol. 2010;30(2):162–168.
- Guo D, Zhu L, Huang Z, et al. Anti-leukemia activity of PVP-coated silver nanoparticles via generation of reactive oxygen species and release of silver ions. Biomaterials. 2013;34(32):7884–7894.
- Lee HY, Choi YJ, Jung EJ, et al. Genomics-based screening of differentially expressed genes in the brains of mice exposed to silver nanoparticles via inhalation. J Nanoparticle Res. 2010;12(5):1567–1578.
- Ashajyothi C, Oli AK, Prabhurajeshwar C. Potential bactericidal effect of silver nanoparticles synthesised from Enterococcus species. Orient J Chem. 2014;30(3):1253–1262.
- Zhang XD, Wu HY, Wu D, et al. Toxicologic effects of gold nanoparticles in vivo by different administration routes. Int J Nanomed. 2010;5:771–781.
- Hong TK, Tripathy N, Son HJ, et al. A comprehensive in vitro and in vivo study of ZnO nanoparticles toxicity. J Mater Chem B. 2013;1(23):2985–2992.
- Bergin IL, Witzmann FA. Nanoparticle toxicity by the gastrointestinal route: evidence and knowledge gaps. Int J Biomed Nanosci Nanotechnol. 2013;3(1–2):163–210.
- Sarhan OM, Hussein RM. Effects of intraperitoneally injected silver nanoparticles on histological structures and blood parameters in the albino rat. Int J Nanomed. 2014;9:1505.
- Gjetting T, Arildsen NS, Christensen CL, et al. In vitro and in vivo effects of polyethylene glycol (PEG)-modified lipid in DOTAP/cholesterol-mediated gene transfection. Int J Nanomedicine. 2010;5:371–383.
- Hauck TS, Anderson RE, Fischer HC, et al. In vivo quantum-dot toxicity assessment. Small. 2010;6(1):138–144.
- Kulthong K, Maniratanachote R, Kobayashi Y, et al. Effects of silver nanoparticles on rat hepatic cytochrome P450 enzyme activity. Xenobiotica. 2012;42:854–862.
- Elechiguerra JL, Burt JL, Morones JR, et al. Interaction of silver nanoparticles with HIV-1. J Nanobiotechnol. 2005;3(1):6.
- Al-Harbi MS, El-Deeb BA, Mostafa N, Amer SA. Extracellular biosynthesis of AgNPs by the bacterium proteus mirabilis and its toxic effect on some aspects of animal physiology. Adv Nanoparticles. 2014;3:83–91.
- Ben-Slama I, Mrad I, Rihane N, et al. Sub-acute oral toxicity of zinc oxide nanoparticles in male rats. J Nanomed Nanotechnol. 2015;6: 284.
- Aillon KL, Xie Y, El-Gendy N, et al. Effects of nanomaterial physicochemical properties on in vivo toxicity. Adv Drug Deliv Rev. 2009;61(6):457–466.
- Pujari K, Duarah S, Ghosh J, Unnikrishnan D. Safety evaluation study of repaglinide loaded polymeric nanoparticles formulation. Res J Pharm Biol Chem Sci. 2015;6(3):1167–1177.
- Seagrave JC, Mc Donald JD, Giglotti AP, et al. In-vitro versus in-vivo exposure to combustion emissions. Exp Toxicol Pathol. 2005;57:233–238.