
 ?Mathematical formulae have been encoded as MathML and are displayed in this HTML version using MathJax in order to improve their display. Uncheck the box to turn MathJax off. This feature requires Javascript. Click on a formula to zoom.
Abstract
This study aimed to synthesise TiO2 nanoparticles (NPs) in pure rutile structure at moderate temperature without calcination and use them as the catalyst for alachlor removal under UV-C radiation. The crystal structure, composition, and particle size of the synthesised TiO2 NPs were analysed using an X-ray diffractometer (XRD) and a scanning electron microscope (SEM). The XRD spectra revealed the production of pure rutile TiO2. The individual and interactive effects of initial alachlor concentration (15–75 mg/L), TiO2 concentration (25–125 mg/L), pH (3–11), temperature (20–40 °C) and reaction time (15–75 min) on alachlor removal were investigated using the central composite design model based on the response surface methodology for experimental design, modelling and process optimization. The analysis of variance and multiple linear regression showed a good fit of the experimental data to the second-order polynomial model, with a coefficient of determination (R2) value of 0.8176 and a model F-value of 19.55975, implying that the model was significant. The results showed that decrease in pH and the initial alachlor concentration and increase in TiO2 concentration resulted in an increase in alachlor removal rate. The maximum rate of alachlor removal (98.44%) at optimum conditions occurred at pH = 5, alachlor = 30 mg/L, TiO2=100 mg, temperature = 35 °C and reaction time = 60 min.
1. Introduction
Alachlor (2-Chloro-N-(2,6-diethylphenyl)-N-(methoxymethyl)acetamide), which has been commercially used to inhibit the growth of annual grasses and many broadleaf weeds in maize, peanut and soybean fields since 1969, is a member of the chloroacetanilide family of herbicides [Citation1,Citation2]. It is a selective, systemic pesticide that interrupts both protein production and synthesis of long-chain fatty acids in targeted plants [Citation3–5]. Due to its high water solubility (242 mg/L) and relatively low soil adsorption coefficient, alachlor can be detected in surface, ground and drinking water in many countries [Citation5–7]. Its existence in water resources is particularly concerning due to its possible effects on human health and its toxic effects on aquatic fauna and ecosystems [Citation8].
The maximum concentration of alachlor allowed in drinking water was set at 0.002 mg/L by the United Stated Environmental Protection Agency, while the European Union (EU) allowed a maximum contamination of 0.0001 mg/L [Citation9–11]. The World Health Organization’s recommended guideline for alachlor in drinking water is 20 μg/L based on a lifetime cancer risk in excess of 1:100,000 [Citation12]. The maximum concentration of alachlor established by the Institute of Standards and Industrial Research of Iran is 0.02 mg/L [Citation13]. Alachlor was banned in the EU in 2006 [Citation14].
Short-term exposure to alachlor causes minor eye and skin irritation, but such exposure may cause organ failure and cancer in the long run [Citation8]. This compound is lipophilic and is metabolised to a little extent in living organisms. Hence, environmental exposure to this compound results in its accumulation and persistence in fatty tissues [Citation15].
Alachlor is persistent and not easily biodegradable in water resources. Thus, conventional physicochemical processes and bioremediation, such as biological method, pre-oxidation by permanganate, coagulation, filtration and chlorination, do not ensure its removal from water resources [Citation6,Citation8]. Many oxidation treatments for degrading Alachlor have been reported in the literature, including adsorption, photolysis, ozonation [Citation1,Citation6], gamma radiolysis, photo-Fenton, anodic Fenton treatment [Citation8], hydrodynamic cavitation, sonochemical reactors and heterogeneous photocatalysis with titanium dioxide (TiO2) [Citation15–17].
Photodegradation with TiO2 as a photocatalyst has recently attracted much attention as a promising method of water purification, because TiO2 is relatively inexpensive, photochemically stable and non-toxic and can be easily recycled on an industrial scale [Citation18–20]. The anatase phase of TiO2 has been accepted as the most photoactive TiO2. Studies have generally focused on the calcination temperature for the formation of the anatase phase on a support [Citation21]. Nevertheless, increasing attention has been paid to rutile TiO2 synthesis in the recent years due to superior properties, including thermodynamic stability and possession of chemical inertness even in acidic and basic conditions [Citation18,Citation20]. In general, the adsorption ability of rutile TiO2 hardly depends on temperature (the adsorption ability of rutile TiO2 becomes low at high temperatures). Indeed, the degradation effect of rutile TiO2 mainly originates from its self-catalytic ability [Citation22]. The photodegradation rate of organic compounds with rutile TiO2 is limited by the rate of electron transfer to oxygen. Therefore, rutile TiO2 alone has a low photoactivity.
UV-based oxidation has a significant potential due to its high treatment efficiency and low cost. Some organic pollutants can be absorbed and destroyed by UV radiation [Citation23]. Photocatalytic degradation using UV/TiO2 effectively degraded and mineralised chlorinated pesticides [Citation19]. Moreover, the reaction of the produced photoindused electrons (e–) and positives holes (h) with the environment produced hydroxyl radicals (°OH), which served as the main oxidizing agents responsible for photo oxidation of organic compounds [Citation24]. A study by de Luna et al. [Citation25] found 99.74% alachlor removal under UV radiation. The total organic carbon analysis confirmed the mineralization of alachlor with UV photocatalysis at 92.44% removal [Citation25]. Furthermore, Dehghani et al. [Citation26] demonstrated that decrease in pH and increase in the amount of the catalyst and contact time resulted in an increase in the antibiotic removal rate (90%) [Citation25]. Alvarez-Corena et al. [Citation27] also pointed to the significant degradation of various contaminates (77% for 1,4 dioxane, 92% for n-nitrosodimethylamine, 45% for tris-2-chloroethyl phosphate, 95% for gemfibrozil and 93% for 17 b estradiol) after five minutes of UV/TiO2 reaction [Citation27]. In the same vein, Kim et al. [Citation18] found that the constant rate (Ka) increased by decreasing the pH value. Accordingly, the constant rate was 0.030, 0.050 and 0.060 h–1 at pH levels of 9, 7 and 5, respectively [Citation18].
Alachlor is a selective, systemic pesticide and despite being banned, it is still used extensively in agricultural fields due to its low cost and high effectiveness. On the other hand, the effect of alachlor on human health is a concern. To address its dangerous effects, its residual concentration in water resources must be identified. Therefore, the main objective of this study is to determine alachlor removal rate from aqueous solutions using TiO2 Nanoparticles (NPs) under UV radiation. It should be noted that the current work is the first study on the synthesis of TiO2 in the pure rutile structural format at moderate temperature without calcination and its usage as the catalyst for alachlor removal under UV-C radiation.
2. Materials and methods
2.1. Chemicals and analytical method
Alachlor (99.9%) was purchased from Sigma Aldrich Company (USA). Titanium tetrachloride (TiCl4, Sigma Aldrich) was used as a precursor to TiO2 and hydrochloric acid (HCl, Sigma Aldrich) was used as a solvent at the synthesis stage. Acetonitrile and ultra-pure water (High Performance Liquid Chromatography (HPLC) grade) were prepared form Sigma Aldrich Company and were used in chromatographic analysis. Other chemical products were purchased from Merck (Germany). A UV lamp, 125 w/m2, was used as the radiation source.
For alachlor detection in the aqueous phase, an HPLC system (KNAUER, AZURA, Germany) including C18 columns with precolumn (Eurosphere, 250 × 4.6 mm) equipped with a UV-photo array detector and 20 μL injection loop was calibrated and tested prior to injection of the samples. The mobile phase included acetonitrile and water (80:20 V/V) with a flow rate of 1.0 mL/min. The absorbance of alachlor at a wavelength of 197 nm was followed. Before injection, the samples were passed through a CSM syringe filter cellulose acetate membrane with a pore size of 0.45 μm (Korea).
2.2. Synthesis of TiO2
TiO2 was synthesised via acid hydrolysis of TiCl4, following the procedure reported by Yener et al. [Citation20]. Briefly, the aqueous solution of TiCl4 (0.5 M) was prepared using HCl (3 M) to control the fast hydrolysis reaction of TiCl4 in water. In a typical synthesis, 250 mL of acidic TiCl4 solution was added in a homemade reactor system. The hydrolysis reaction was carried out at 95 °C at a constant stirring rate of 500 rpm under reflux for 3 h. After aging at room temperature for 24 h, the white precipitate and the white supernatant were separated. The precipitate was repeatedly washed with water to reduce the acidity of the suspension by removing Cl ions until the pH of the rinsing water became neutral. The precipitate was then dried at 60 °C for 24 h to obtain the final rutile form of TiO2 NPs.
2.3. Characterizations
The crystallite structure of the NPs was investigated by analysing their X-ray diffraction (XRD; D8 advance, Bruker, wavelength: 1/54 Kα Cu). The morphologies and particle sizes were measured using Scanning Electron Microscopy (SEM; TESCAN-Vega 3, TESCAN). The samples were first prepared using ultrasonic dispersion of oxide powder in ethanol and were then dropped on a Cu grid. Subsequently, sputtering coating (Q150R-ES, Quorum Technologies) was added.
2.4. Reactor specifications
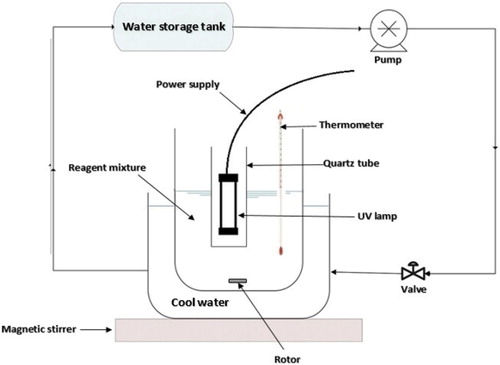
The photocatalytic degradation of alachlor was carried out in an aqueous medium in a homemade crystalline cylindrical reactor [Citation20]. The reactor volume was 500 mL. The temperature of the reaction medium was adjusted to the desired temperatures by circulating cool water in the jacket of the reactor. Radiation was provided by a UV-C lamp (125 w/m2) placed at the center of the reactor in a quartz tube. Uniformity in the solution’s temperature, pH, and concentration during the reaction period was achieved via magnetic stirring. The lamp was switched on to initiate photoreaction. At regular time intervals, the samples were placed in the test tubes and centrifuged to remove the catalyst NPs. The whole system was wrapped in aluminum foil to prevent reflection. A schematic representation of the utilised reactor has been shown in .
Figure 1. The specification of the photochemical reactor.
Alachlor removal efficiency was calculated using the following formula:
(1)
(1)
Where and A represented alachlor concentration before and after the TiO2/UV process, respectively. Besides, E represented the efficiency.
2.5. Experimental design
Response Surface Methodology (RSM) is a combination of statistical and mathematical methods used to select the best experimental conditions to obtain robust results with the lowest possible number of experiments [Citation28]. A Central Composite Design (CCD) with five independent variables was applied to analyse the parameters and their interaction effects. The studied parameters have been presented in . It is worthy to note that model construction was done using both the actual values of the factors and their coded values (–2, –1, 0, +1, +2) presented in . A total of 60 experiments were found to be sufficient to calculate the coefficients of the quadratic polynomial regression model for the five variables.
Table 1. The parameters and levels used for the experimental design.
3. Results and discussion
3.1. XRD analysis
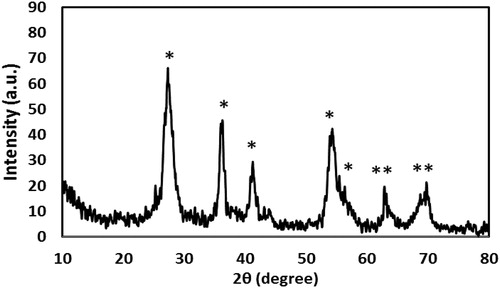
The XRD patterns of the NPs have been shown in . The XRD pattern of the synthesised TiO2 NPs showed that all observed diffraction peaks could be the indicator of a well-crystallised rutile TiO2 structure (JCPDS No 77-0441) [Citation20]. Based on , XRD peaks were at 2θ = 28.1°, 37.5°, 42.2°, 55.3°, 64.7° and 69.9°, which corresponded to the rutile form of TiO2. The diffraction peaks of other crystallite forms of TiO2 (brookite and anatase) were not obtained. The average crystalline size obtained from the four sharpest peaks in XRD patterns based on Scherrer equation was 5.77 nm.
Figure 2. The XRD pattern of synthesised TiO2 NPs. The most important peaks of rutile TiO2 have been marked by “*” on the figure.
3.2. SEM studies
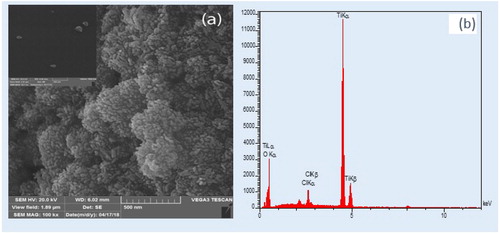
The morphology of TiO2 NPs was studied by SEM. The corresponding SEM photographs have been presented in . Accordingly, the crystallites of NPs had well-defined, spherical, grain-like crystals. Indeed, most NPs had total apparent dimensions ranging from 20 to 60 nm. However, based on XRD, the crystalline size of NPs was very low. Moreover, the elemental analysis (EDX) of the NPs detected Ti (), O, and a small amount of Cl, which could be attributed to utilization of HCl as the solvent in the process of photocatalyst synthesis. The EDX data have been presented in Table S1 (Supporting Information).
Figure 3. SEM image of TiO2 (a) and elemental analysis (EDX) for TiO2 (b).
3.3. Photocatalytic reactions
The removal of alachlor using the synthesised TiO2 NPs in each designed condition (See next section) was evaluated in the generated reactor and the remained alachlor concentration was checked using HPLC. A typical chromatogram of alachlor in two different concentrations has been depicted in Figure S1 (Supporting Information). Accordingly, the retention time for alachlor in photocatalytic reactions was around 5.7 min. It should be noted that the detection limit for alachlor was 0.001 mg/L.
3.4. CCD study
The data matrix obtained from the 60 experiments was checked using different models and was analysed via ANOVA. The HPLC peaks of one out of the 60 runs before and after treatment have been shown in Figure S2 (Supporting Information), which indicated the effectiveness of the applied process in removal of alachlor. The results showed that the quadratic polynomial model was a good option to cover the variation in the data. However, to avoid the possible over fitting in the model [Citation29], variable reduction was applied based on the backward elimination strategy. The final model for both non-coded (actual) and coded variables has been presented in EquationEquations (2)(2)
(2) and Equation(3)
(3)
(3) , respectively.
(2)
(2)
(3)
(3)
These equations revealed how individual variables and double interactions (between variables or within the same variable) affected the removal of alachlor from the aqueous solution. The negative sign indicates that individual or double interaction factors negatively affected alachlor removal (i.e. pH); whereas a positive sign indicates that, the factors increased the removal of alachlor within the tested range.
The results of ANOVA concerning alachlor removal have been shown in . The F-value of the model or each term in the model is the ratio of the mean square for the model or individual term to the mean square for the residual. The p-value is the probability of the F-value and is used to test the null hypothesis. Therefore, the larger the F-value and the smaller the p-value, the more significant the corresponding coefficient will be. The parameters with F-statistic probability values <0.05 are considered to be significant [Citation30]. The overall F-value of the model was 19.56, indicating that the model was significant.
Table 2. Analysis of variance to evaluate the significance of the model obtained by CCD for alachlor removal.
In this work, C, E, A2, B2 and D2 were highly significant parameters (p < 0.0001). A, B, BC and C2 were significant, as well (p < 0.05). p-Values > 0.05 implied that the model terms were insignificant at the 0.05 level of significance. According to , temperature and the interaction between pH and the initial concentration of alachlor (AB in the model) was insignificant with a higher p-value. Although temperature showed a high and insignificant p-value, it was retained in the model to prevent its hierarchy. The F-value of lack-of-fit was equal to 1.90, which implied that the lack of fit was not significant relative to the pure error. Therefore, it can be concluded that pH, initial concentration of alachlor, TiO2 concentration and reaction time played important roles in alachlor removal.
The results of ANOVA for the regression model revealed an R2 value of 0.818, indicating that the model could explain 81.8% of the variance in the data. For a model to be adequate, the R2 value should not be <0.75 [Citation31]. However, a large value of R2 does not always imply that the regression model is a good one. Such inference can only be made based on a similarly highly adjusted R2 value [Citation32]. An acceptable value of the adjusted determination coefficient (= 0.776) was estimated in this study, indicating a good agreement between the experimental and predicted values of alachlor removal. According to Rai et al. [Citation33], the values of adjusted R2 and R2 of prediction (R2pred) should be within 20% of each other to be in good agreement. This requirement was satisfied in this study, with an R2pred value of 0.717 [Citation33]. In addition, the signal-to-noise ratio was found to be 19.463, indicating that the model had an adequate signal. It should be noted that the goal of this work was using the suggested model for optimization of the experimental conditions rather than specific prediction [Citation34]. To reach this goal, a model with acceptable prediction is required, which can be obtained by a liner model with
of around 0.77 [Citation35].
The actual and predicted removal percentages and internally studentised residuals can be obtained from diagnostic case statistics. The limit of the internally studentised residuals is 3σ [Citation36]. According to , all conducted experiments showed studentised residuals in the permitted range. Besides, the residual plot was approximated along a straight line. The analysis of the diagnostic case statistics of the data showed that the model fitted well to optimise the independent variables for alachlor removal.
Figure 4. Normal probability plot of the studentised residual (a) and alachlor removal observed in the experiment versus predicted values by the model (b).
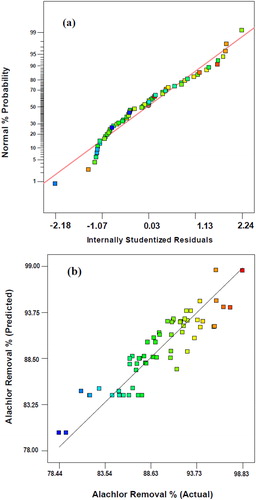
The plot of removal predicted by the developed model against the experimental values has been depicted in . Accordingly, the model successfully captured the correlation between the process conditions and alachlor removal because the predicted values were in good agreement with the observed values.
3.5. Analysis of response surface
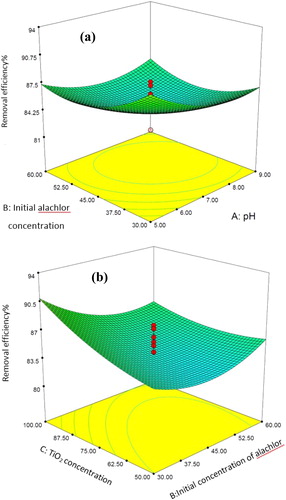
Three-dimensional response surfaces were plotted to investigate the interaction among the variables and to determine the optimum condition of each variable for maximum alachlor removal from aqueous phases. The effect of the initial alachlor concentration and pH on alachlor removal at a constant reaction time of 45 min has been presented in . Accordingly, as the initial concentration and pH decreased, alachlor removal increased. Maximum alachlor removal was obtained at the initial concentration of 30 mg/L and pH of 5. Indeed, a net positive interactive effect was found between pH and the initial alachlor concentration, strongly suggesting the dependency of alachlor removal on both variables.
Figure 5. Response surface plot of the interactive effect of the initial alachlor concentration and pH on alachlor removal. Actual value of other factors: TiO2 concentration = 75.0 mg, temperature = 30.0 °C and time = 45.0 min. Response surface plot of the interactive effect of the initial alachlor concentration and TiO2 concentration on alachlor removal percentage. Actual values of other factors: pH = 7.0, temperature = 30.0 °C and time = 45.0 min.
Dehghani et al. [Citation5] reported that a low alachlor concentration in the enrichment culture might result in higher alachlor degradation capability using a bacterial consortium. In addition, Dehghani et al. [Citation39] showed that the samples with lower initial atrazine concentrations had a higher chance of removal compared to those with higher atrazine concentrations [Citation37–39]. Tang and An [Citation40] also found that the removal efficiencies were lower at higher dye concentrations, because fewer photons were able to reach the surface of TiO2 NPs, reducing the hydroxyl radical flux on the catalyst surface [Citation40]. This may apply to alachlor, as well. pH affects the production of hydroxyl radical as a powerful oxidizing agent [Citation41]. In the research by de Luna et al. [Citation25], Fe–TiO2 was loaded on granular activated carbon to evaluate alachlor photocatalytic degradation. The results demonstrated that a low pH increased the removal efficiency [Citation25]. In the same vein, Bagal and Gogate stated that low initial operating pH levels and acidic conditions were favourable for degradation [Citation42]. Kim et al. also reported a decrease in alachlor concentration from 5, 4.6, 4.3, 4.1 and 3.9 to 3.7 mg/L in 1, 2, 3, 4 and 5 h at a pH of five and constant rate of 0.060 L/h [Citation18].
The interactive effect of the initial alachlor and TiO2 concentrations on alachlor removal has been presented in . A negative significant interaction was found between the initial alachlor concentration and TiO2 concentration. Therefore, the removal efficiency was reduced with an increase in the initial alachlor concentration and a decrease in TiO2 concentration. In addition, an increased initial alachlor concentration might decrease the ability of UV radiation to reach the TiO2 surface because the UV light is attenuated and/or scattered by solids [Citation19,Citation43]. Moreover, the photocatalytic degradation rates increased with TiO2 dosages, but the reaction was retarded at higher TiO2 dosages. The increase in the rates was probably due to an increase in the total surface area (or number of active sites) available for the photocatalytic reaction as the dosage of TiO2 increased. However, when TiO2 was overdosed, the UV light intensity was attenuated due to decreased light penetration and increased light scattering. Thus, as the dosage increased, the effect was increasingly positive, thereby declining the overall alachlor removal efficiency [Citation19].
3.6. Optimised conditions
After model construction, statistical evaluations, and discussion about the effects of the factors and their interactions, the simplex strategy was used to find the maximum efficiency of alachlor removal. It was concluded that at pH = 5, alachlor concentration = 30 mg/L, TiO2 = 100 mg, temperature = 35 °C and reaction time of 60 min, a removal efficiency of about 98.44% was obtained. This predicted efficiency by the model in the optimised conditions was evaluated experimentally. Interestingly, this efficiency was obtained in the real process (98.5%).
4. Conclusion
TiO2 can be synthesised into NPs through TiCl4 acid hydrolysis. The crystallites of NPs had well-defined spherical grain-like crystals with particle sizes of ∼20–60 nm. The XRD pattern of TiO2 suggested that all diffraction peaks could be assigned to a well crystallised rutile TiO2. The synthesized TiO2 NPs had the ability to significantly reduce the concentration of alachlor in the aqueous phase. The CCD based on RSM was used to evaluate and optimise the effects of the initial alachlor concentration, pH, TiO2 concentration, temperature and reaction time on alachlor removal. The results of ANOVA on the regression model revealed an R2 value of 0.818, indicating that the model could explain 81.76% of the variance. Overall, the optimal conditions for alachlor removal (98.44%) were as follows: pH of 5, alachlor concentration of 30 mg/L, TiO2 concentration of 100 mg, temperature of 35 °C and reaction time of 60 min.
Author’s contributions
The corresponding author was the leader of the research team (named as the authors of this article) for all parts of the work, including its design, experiments, data analysis and manuscript preparation. All the authors approved the final version of manuscript.
Supplemental Material
Download MS Word (392.7 KB)Acknowledgements
This article was extracted from the thesis written by Fatemeh Jamshidi, MSc student of environmental health engineering. They would also like to appreciate the facilities and excellent technical assistance at the Department of Chemistry of Shiraz University. Thanks also go to Ms. A. Keivanshekouh at the Research Improvement Center of Shiraz University of Medical Sciences for improving the use of English in the manuscript.
Additional information
Funding
Related Research Data
References
- Wang C, Liu C. Decontamination of alachlor herbicide wastewater by a continuous dosing mode ultrasound/Fe2+/H2O2 process. J Environ Sci. 2014;26(6):1332–1339..
- Elsayed OF, Maillard E, Vuilleumier S, et al. Degradation of chloroacetanilide herbicides and bacterial community composition in lab-scale wetlands. Sci Total Environ. 2015;520:222–231.
- Szewczyk R, Soboń A, Słaba M, et al. Mechanism study of alachlor biodegradation by Paecilomyces marquandii with proteomic and metabolomic methods. J Hazard Mater. 2015;291:52–64.
- El-Nahhal Y, Hamdona N. Phytotoxicity of alachlor, bromacil and diuron as single or mixed herbicides applied to wheat, melon, and molokhia. Springerplus. 2015;4(1):367.
- Dehghani M, Nasseri S, Zamanian Z. Biodegradation of alachlor in liquid and soil cultures under variable carbon and nitrogen sources by bacterial consortium isolated from corn field soil. Iranian J Environ Health Sci Eng. 2013;10(1):21.
- Xin Y, Liu H, Han L, et al. Comparative study of photocatalytic and photoelectro catalytic properties of alachlor using different morphology TiO2/Ti photoelectrodes. J Hazard Mater. 2011;192(3):1812–1818.
- Bolobajev J, Trapido M, Goi A. Improvement in iron activation ability of alachlor Fenton-like oxidation by ascorbic acid. Chem Eng J. 2015;281:566–574.
- Pipi ARF, De Andrade AR, Brillas E, et al. Total removal of alachlor from water by electrochemical processes. Sep Purif Technol. 2014;132:674–683.
- WHO. Alachlor in drinking-water. Background document for preparation of WHO Guidelines for drinking-water quality. Geneva: World Health Organization (WHO/SDE/WSH/03.04/31); 2003.
- EPA. Ambient water quality value for protection of sources of potable water. New York: Human Health Fact Sheet; 1998.
- Suwannaruang T, Wantala K. Single-step uncalcined N-TiO2 synthesis, characterizations and its applications on alachlor photocatalytic degradations. Appl Surf Sci. 2016;380:257–267.
- Institute of Standards and Industrial Research of Iran. Drinking water - Physical and chemical specifications. Tehran: Institute of Standards and Industrial Research of Iran; 2010. (5th revision).
- Vitanov NK, Lekova KI, Dobreva NI. Monitoring river water in the lower danube for atrazine contamination. Acta Chromatogr. 2003;(13):230–242.
- Elsayed OF, Maillard E, Vuilleumier S, et al. Using compound-specific isotope analysis to assess the degradation of chloroacetanilide herbicides in lab-scale wetlands. Chemosphere. 2014;99:89–95.
- Shaker EM, Elsharkawy EE. Organochlorine and or ganophosphorus pesticide residues in raw buffalo milk from agroindustrial areas in Assiut, Egypt. Environ Toxicol Pharmacol. 2015;39(1):433–440.
- Sette LD, Alves M, Da Costa LA, et al. Biodegradation of alachlor by soil streptomycetes. Appl Microbiol Biotechnol. 2004;64(5):712–719.
- US Environmental Protection Agency. Alachlor. Rev Environ Contam Toxicol. 1988;104:9–20.
- Kim MS, Ryu CS, Kim BW. Effect of ferric ion added on photodegradation of alachlor in the presence of TiO2 and UV radiation. Water Res. 2005;39(4):525–532.
- Wong CC, Chu W. The direct photolysis and photocatalytic degradation of alachlor at different TiO2 and UV sources. Chemosphere. 2003;50(8):981–987.
- Yener HB, Yılmaz M, Deliismail Ö, et al. Clinoptilolite supported rutile TiO2 composites: Synthesis, characterization, and photocatalytic activity on the degradation of terephthalic acid. Sep Purif Technol. 2017;173:17–26.
- Kamimura S, Miyazaki T, Zhang M, et al. (Au@Ag)@Au double shell nanoparticles loaded on rutile TiO2 for photocatalytic decomposition of 2-propanol under visible light irradiation. Appl Catal. 2016;180:255–262.
- Cao B, Yao W, Wang C, et al. Simple fabrication of rutile titanium dioxide whiskers. Mater Lett. 2010;64(16):1819–1821.
- Xu Y, Lin Z, Zhang H. Mineralization of sucralose by UV-based advanced oxidation processes: UV/PDS versus UV/H2O2. Chem Eng J. 2016;285:392–401.
- Zabihi-Mobarakeh HR, Nezamzadeh-Ejhieh AR. Application of supported TiO2 onto Iranian clinoptilolite nanoparticles in the photodegradation of mixture of aniline and 2, 4-dinitroaniline aqueous solution. J Ind Eng Chem. 2015;26:315–321.
- de Luna MDG, Rivera KKP, Suwannaruang T, et al. Alachlor photocatalytic degradation over uncalcined Fe–TiO2 loaded on granular activated carbon under UV and visible light irradiation. Desalin Water Treat. 2016;57(15):6712–6722.
- Dehghani M, Nasseri S, Ahmadi M, et al. Removal of penicillin G from aqueous phase by Fe + 3-TiO2/UV-A process. J Environ Health Sci Eng. 2014;12(1):56.
- Alvarez-Corena JR, Bergendahl JA, Hart FL. Advanced oxidation of five contaminants in water by UV/TiO2: Reaction kinetics and byproducts identification. J Environ Manage. 2016;181:544–551.
- Hanini AE, Hanini S, Merzouk NK. Using central composite experimental design to optimize the degradation of tylosin from aqueous solution by photo-fenton reaction. Materials. 2016;9(6):428.
- Ramezani AM, Yousefinejad S, Nazifi M, et al. Response surface approach for isocratic separation of some natural anthraquinone dyes by micellar liquid chromatography. J Mol Liquids. 2017;242:1058–1065.
- Bayraktar E. Response surface optimization of the separation of DL-tryptophan using an emulsion liquid membrane. Process Biochem. 2001;37(2):169–175.
- Owolabi RU, Usman MA, Kehinde A. Modelling and optimization of process variables for the solution polymerization of styrene using response surface methodology. J King Saud Univ Eng Sci. 2018;30(1):22–30.
- Koocheki A, Taherian AR, Razavi S, et al. Response surface methodology for optimization of extraction yield, viscosity, hue and emulsion stability of mucilage extracted from Lepidium perfoliatum seeds. Food Hydrocoll. 2009;23(8):2369–2379.
- Rai A, Mohanty B, Bhargava R. Supercritical extraction of sunflower oil: a central composite design for extraction variables. Food Chem. 2016;192:647–659.
- Amin MM, Yousefinejad S, Dehghani M, et al. Electro Fenton process catalyzed by Fe@ Fe2O3 nanowire for degradation of carbamazepine from aqueous solutions. Desalin Water Treat. 2019;162:44–59.
- Golbraikh A, Tropsha A. Predictive QSAR modeling based on diversity sampling of experimental datasets for the training and test set selection. Mol Divers. 2000;5(4):231–243.
- Arivoli S, Hema M, Parthasarathy S, et al. Adsorption dynamics of methylene blue by acid activated carbon. J Chem Pharm Res. 2010;2(5):626–641.
- Dehghani M, Nasseri N, Amin SA, et al. Assessment of atrazine distribution in Shiraz soils, south of Iran. Pak J Biol Sci. 2010;13(2):66–72.
- Dehghani M, Nasseri S, Hashemi H. Study of the bioremediation of atrazine under variable carbon and nitrogen sources by mixed bacterial consortium isolated from corn field soil in fars province of Iran. J Environ Public Health. 2013;973165. Article ID
- Shamsedini N, Dehghani M, Nasseri S, et al. Photocatalytic degradation of atrazine herbicide with Illuminated Fe + 3-TiO2 Nanoparticles. J Environ Health Sci Eng. 2017;15(1):7.
- Tang WZ, An H. UV/TiO2 photocatalytic oxidation of commercial dyes in aqueous solutions. Chemosphere 1995;9(31):4157–4170.
- Gupta VK, Kumar R, Nayak A, et al. Adsorptive removal of dyes from aqueous solution onto carbon nanotubes: a review. Adv Colloid Interface Sci. 2013;193-194:24–34.
- Bagal MV, Gogate PR. Sonochemical degradation of alachlor in the presence of process intensifying additives. Sep Purif Technol. 2012;90:92–100.
- Brandi RJ, Martín CA, Alfano OM, et al. A laboratory reactor for photocatalytic studies in slurry operation. J Adv Oxid Technol. 2002;5:175–185.