
 ?Mathematical formulae have been encoded as MathML and are displayed in this HTML version using MathJax in order to improve their display. Uncheck the box to turn MathJax off. This feature requires Javascript. Click on a formula to zoom.
Abstract
In this study, adsorption treatment of phenol pollutant using electrospun poly(3-hydroxybutyrate) [P(3HB)] and poly(3-hydroxybutyrate-co-3-hydroxyhexanoate) [P(3HB-co-3HHx)] is highlighted for the first time. Both P(3HB) and P(3HB-co-3HHx) were extracted from bacterial cells and nanofibres were fabricated through electrospinning technique for the adsorption of phenol. The electrospun nanofibres were optimised after preliminary study of the electrospinning parameters (i.e. applying different voltages, polymer concentrations and mixed solvent ratios). The effects of adsorption under different variables such as contact of time, pH, initial concentration and temperature were studied. The raw polymers were characterised with gas chromatography (GC), gas permeation chromatography (GPC) while the electrospun fibres were investigated using thermogravimetric analysis (TGA), differential scanning calorimetry (DSC) and viewed under field emission scanning electron microscope (FESEM). P(3HB) had higher molecular weight as well as higher crystallinity and thermal stability than P(3HB-co-3HHx). The maximum phenol adsorption capacity of optimised nanofibre with weight of 0.14 g was 35.7 mg/g. The adsorption trend of the isotherm followed the Freundlich (R2 = 0.99) and adsorption kinetics of pseudo-second-order. The equilibrium contact time was 10 min with 99.8% of the phenol removed and attained 99.9% removal after optimal contact time of 270 min for all samples. This innocuous product has strong affinity towards organic pollutants and zero by-products were produced after the adsorption.
1. Introduction
The most studied pollutant compound for wastewater treatment is phenol and its derivatives because of its major presence in most processing and refining industries effluent. Phenolic compounds are found in crude petroleum and distillation of coal tar [Citation1]. Phenol is toxic and persistent in the environment and is subjected to regulation in some countries as priority pollutants. For example, US Environmental Protection Agency (EPA) has classified phenol as priority pollutant while WHO stipulated that only <2 µg/L concentration of phenol can be entered into water resources from conventional water treatment plant. Moreover, chlorophenols (2,4,6-trichlorophenol) in drinking water are required to be set at <0.1 µg/L in order for it to be classified as safe [Citation2]. Physicochemical, biological treatment, advanced oxidation processes (AOP, e.g. photocatalyst, Fenton & cavitation), ion-exchanges, emulsion liquid membrane and activated carbon techniques are commonly used to treat consistent organic contaminants like phenols from wastewater. Other techniques such as chemical oxidation, photochemical, ultrasound waves, electrochemical and hybrids methods from many of these treatments also are done to degrade the phenols. Yet, the method for chemical wastewater treatment is often challenging and energy demanding. Furthermore, its sensitivity effects towards the environments must be analysed and there is a need to take into consideration in meeting local regulation standard. For example, water for domestic use according to the US EPA local regulation standard must only contain maximum of 0.3 mg/L of phenol and 2.6 mg/L for fisheries while Japan only permits 5 mg/L of phenol in wastewater effluent which is quite different from the US EPA [Citation3].
When a molecule binds to a surface through the formation of chemical bonds, it is known as chemisorption [Citation4]. The porous nanofibre mats of P(3HB) homopolymer and P(3HB-co-3HHx) copolymer was examined in the presented manuscript to clarify the effective adsorption at the removal of water contaminants. In this study, it is proposed that adsorption could be an effective solution for the treatment of phenol pollution. This highly contaminating petrol element has been used to compare the capabilities of two nanostructured adsorbents. The preparation of ultra-thin polyhydroxyalkanoate (PHA) via electrospinning was studied as a potential method for phenol adsorption. The introduction of flexible and relatively cheap nano-fabrication techniques will improve the market demand for P(3HB) derivatives. Moreover, the special inherent characteristics of PHA nanofibres such as eco-friendly, high biodegradability, hydrophobicity, viable processability, etc. will promote the production of PHA based filtration and adsorption systems.
Research and development of biodegradable polymer materials to adsorb pollutants have shown many useful applications in wastewater treatment. PHAs are 100% biodegradable polyesters produced from various HAs [Citation5]. In this study, the natural phenol adsorption was achieved using hydrophobic interaction of PHAs namely P(3HB) and P(3HB-co-3HHx). Extracted PHA is hardly being used directly as adsorbent especially in its bulk form. Physical modification can be used to alter the surface properties [Citation6] via electrospinning, whereby PHA can be tailored into a porous, high surface area matrix suitable for adsorption of organic molecules.
The use of PHA to adsorb phenol has not yet been studied. The only other pollutant that has been studied for adsorption using electrospun P(3HB) was done by Sridewi et al. to absorb malachite green dye pollutant. The study showed that 78% of 30 µM malachite green dye was decolourised and adsorbed. The study also discovered that the solvent-cast P(3HB) film eliminated nearly 24% of malachite green dye from aqueous solution [Citation7]. This indicates that even with the application of simple fabricated cast P(3HB) films, the dye uptake value is promising. Furthermore, the methylene blue dye adsorption and its photocatalytic degradation using P(3HB)-TiO2 cast films were also reported [Citation8]. Activated carbons obtained from palm oil empty fruit bunches (EFB) has been utilised to get rid of phenol from aqueous solution with maximum adsorption capacity (Qmax) of 11.61 mg/g as reported by Alam et al. [Citation9]. Meanwhile, Gawande et al. [Citation10] investigated that the optimum photocatalytic activity and phenol degradation of Graphene@BiPO4 composite at 5 wt.% of graphene under visible light is almost three times greater compared to the pure BiPO4. It was tested that 4-chlorophenol and bisphenol compounds were degraded by the use of surface-fluorinated and platinised TiO2 catalyst generated hydrogen gas [Citation11]. In this present work, we focussed on the development of ultra-thin PHA fibres using electrospinning to increase the surface area per volume ratio of the resultant film for phenol adsorption.
2. Experimental procedure
2.1. Materials
2.1.1. PHA sources
PHA granules amassed in the lyophilised bacterial cells were extracted by mixing with chloroform and were stirred for 5 days in the ratio of 1 g:100 mL. The agitated cells suspension were filtered using Whatman® No. 1 filter paper to filter off the cell fragments and to collect the chloroform extract. The filtrate was then concentrated to 30 mL of volume using rotary evaporator Eyela N-1000 (Eyela, Japan). The concentrated polymer solution was precipitated by dropwise method until white precipitations were produced during addition of the solution into stirred chill methanol [Citation12]. The precipitations were poured into glass petri dish and air-dried in the fume hood where the purified dried polymer was later collected. A few different sources of polymer were used, which are listed in .
Table 1. Types of polymer used and their sources in this study.
2.1.2. Chemicals
Chloroform was purchased from Fisher Scientific (Malaysia). Dimethylformamide and methanol were purchased from Merck Malaysia. Phenol solution of 99% purity was purchased from R&M Chemicals. The chemicals were used without further purification.
2.2. Fabrication of P(3HB) and P(3HB-co-3HHx) electrospun films
P(3HB) and P(3HB-co-3HHx) (10 w/v %) precursor solution were prepared respectively by dissolving 5 g of the polymer in 50 mL of CHCl3/DMF mixed solvent at 8:2 ratio. The P(3HB) and P(3HB-co-3HHx) precursor solution percentage was prepared using formula 1 in Schott bottle:
(1)
(1)
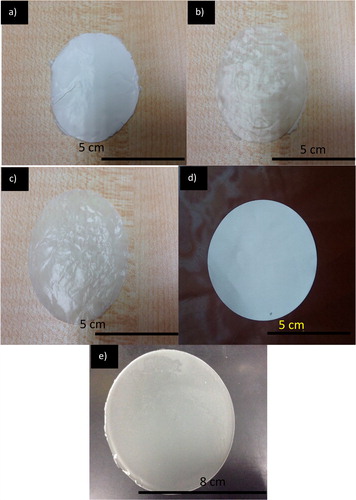
The Schott bottle lid was then closed and sealed with paraffin film and aluminium foil to prevent evaporation and the bottle was left for stirring for 2 days. Then, it was heated at 55 °C and stirred simultaneously for 2 h prior to electrospinning. The precursor solution was then cooled down and 1 mL of the solution was loaded into a glass syringe to be electrospun. The process was fulfilled using Esprayer ES-2000 (Fuence Co. Ltd., Japan) at 15, 18, 20, 25 and 30 kV. The solution used were prepared at different concentrations: 5, 10, 15 and 20 w/v % for P(3HB-co-24.8 mol% 3HHx) and 10, 15, 20 and 25 w/v % for P(3HB-co-14.7 mol% 3HHx) while 10% and 15% were used for P(3HB). The humidity in the spinning chamber was set between from 27% to 30% while the temperature was set from 24 °C to 29 °C. The precursor solutions were loaded into glass syringes with inner needle diameter of 0.5 mm. The distance was fixed at 20 cm between the collector and the needle tip. The electrospun fibres were deposited on a 5 cm diameter circular area by insulating the rest of the collection plate surface with a plastic sheet. About 5 mL of precursor solution was used in the electrospinning process to form a film. The resulting films were vacuum dried to remove residual solvent and were kept in the dark until further analyses. The optimised samples images are shown in .
Figure 1. Digital photographs of P(3HB) and P(3HB-co-3HHx) films showing (a) electrospun P(3HB-co-14.7 mol% 3HHx), (b) electrospun P(3HB-co-24.8 mol% 3HHx), (c) electrospun P(3HB), (d) electrospun Commercial P(3HB-co-8.4 mol% 3HHx) and (e) P(3HB) cast film.
2.3. Characterisation techniques
PHA content and composition in polymer samples were analysed by using Gas Chromatography (GC) SHIMADZU GC-2010 (Shimadzu, Japan). The molecular weight of the polymers used was determined by using Agilent Technologies 1200 series with SHODEX K-806M (Shodex, Japan) and SHODEX K-802 (Shodex, Japan) columns at 40 °C. Chloroform was used as eluent with flow rate of 0.8 mL/min. Glass transition temperature (Tg) and crystalline melting point (Tm) of the nanofibres (50 mg) were determined using Pyris 1 DSC Differential Scanning Calorimeter, (PerkinElmer, USA) by sealing the samples into a round shape aluminium cylinder. The thickness of the electrospun nanofibres film was measured at the centre of the round shaped films by using Digimatic Micrometre (Mitutoyo, Japan). The thermal degradation of nanofibres and the decomposition temperature (T) at 5% weight loss were determined using STA 6000 Perkin Elmer. Ten milligrams of the sample was exposed to heating temperature of 50–900 °C at heating rate of 10 °C min−1 under nitrogen gas. SEM micrographs of the nanofibers were observed under 10,000 magnification using Leo Supra 50 VP Field Emission SEM at Electron Microscopy Unit, USM, Penang and FEI Quanta 400 F at Faculty of Engineering, Nottingham University, Semenyih. The samples were mounted on aluminium stumps, coated with gold for 15 s, and viewed at an acceleration voltage of 5 kV. Energy-dispersive X-ray (EDX) analysis was done using the Oxford Model via INCA 400 instruments with X-Max Detector. The tilt, elevation and azimuth degree of analysis was 0, 35 and 0 degree, respectively under the magnification of 5000 times. The accelerating voltage used was 20 kV with five times processing time.
2.4. Removal of phenol via adsorption
Standard phenol aqueous solution (100 ppm, 10 mg/100 mL) was prepared at room temperature and used throughout the adsorption studies excluding for the effects of initial concentration of phenol test. Batch studies were conducted in 50 mL of predetermined initial concentrations of phenol in aqueous solution with a single sheet or electrospun P(3HB) nanofilm incubated in the dark for phenol adsorption studies. The suspensions were stirred at 100 rpm in 50 mL beaker at room temperature for a specified time and filtered using 0.45 µm (PTFE) membrane filters (Fisher Scientific) when necessary to prevent residues from affecting the spectrophotometer readings. Agitation speed of 0 (as control) and 100 rpm was chosen in the process of adsorption as it is influenced by mass transfer parameters and also to achieve equilibrium. The absorbance of initial phenol solution and after adsorption sample at specific time was determined using a Jenway 6505 UV-Vis spectrophotometer at 300 nm. The adsorption capacity of electrospun film was calculated from the change in phenol solution concentration before and after equilibrium sorption. The adsorption capacity at any time, q (mg/g) was calculated using the following mathematic formula:
(2)
(2)
where Ci = initial phenol concentration (ppm), Ct = final phenol concentration at time t (ppm), V = volume of the solution (L) – 50 mL, W = weight of nanofibre used (g) – 0.14 g.
Finally, the percentage of phenol removal was calculated using the following formula:
(3)
(3)
where Ci = initial phenol concentration (ppm), Ct = final phenol concentration at time t (ppm)
2.4.1. Effect of contact time on adsorption capacity
Different contact times at 10, 30, 60, 90, 120, 150, 180, 210, 240, 270, 300, 330 min were investigated. After equilibrium contact time was calculated, changes in phenol solution concentration before and after adsorption were analysed. A nanofibre sheet mixed with distilled water was prepared as a control experiment. From the data of contact time, kinetic models of pseudo-first order and pseudo-second order were generated to analyse the kinetics of phenol adsorption by the adsorbent. Lagergren kinetic equation has been most extensively exploited for the adsorption of adsorbate from an aqueous solution. The pseudo-first-order kinetic model of Lagergen is much applicable for lower concentrations of solute and its linear form equation is as follows:
(4)
(4)
where qt = adsorption capacity at time t (mg/g), qe = adsorption capacity at equilibrium (mg/g), k1 = rate constant of pseudo-first-order-model
The values of k1 and qe were calculated from the plot of log (qe – qt) versus t. The acquired linear line yields k1 as the gradient and lnqe functions as the intercept. Meanwhile, pseudo-second-order kinetic model based on adsorption capacity was constructed based on the following formula:
(5)
(5)
where qt = adsorption capacity at time t (mg/g), qe = adsorption capacity at equilibrium (mg/g), k2 = rate constant of pseudo-second-order-model and t = time (min)
2.4.2. Effect of temperature on adsorption capacity
The electrospun nanofibre was added to 50 mL of 100 ppm phenol/water mixture in a beaker at an equilibrium contact time, constant light condition and pH. Then it was stirred at 100 rpm at various temperatures: 25, 30, 40, 50 and 60 °C.
2.4.3. Effect of pH on adsorption capacity
The electrospun nanofibre was added to 50 mL of 100 ppm phenol/water mixture at a constant light condition, temperature and at different pH: 2, 4, 6, 8 and 10. It was stirred at 100 rpm at room temperature at 25 °C for an equilibrium contact time.
2.4.4. Effect of initial phenol concentration on adsorption capacity
The electrospun nanofibre was added to various initial concentrations (25, 50, 100, 150, 200 and 300 mg/L) in 50 mL phenol/water mixture at a constant temperature and at its original pH and stirred at 100 rpm at room temperature (25 °C) for an equilibrium contact time. Langmuir (Equation (Equation6(6)
(6) )) and Freundlich (Equation (Equation7
(7)
(7) )) isotherm models were generated to provide reasonable fittings for this sorption data.
In order to construct a reasonable fitting for the sorption data, Langmuir and Freundlich isotherm values were calculated using these two calculation methods:
Langmuir isotherm calculation:
(6)
(6)
where qe = adsorption capacity at equilibrium (mg/g), qs = maximum amount of phenol per unit weight of electrospun nanofibres to form a complete monolayer coverage on the surface bound at high equilibrium dye concentration (mg/g), Ce = equilibrium phenol concentration (mg/L), Kads = Langmuir adsorption constant related to the affinity of binding sites.
Freundlich isotherm calculation:
(7)
(7)
where Kf = Freundlich constant (mg/g (L/mg)1/n) n = Freundlich constant, 1/n = effectiveness of adsorption, Ce = equilibrium phenol concentration (mg/L).
3. Results and discussion
3.1. Preliminary studies to determine optimum electrospinning parameters
Preliminary electrospinning studies were done to determine whether the nanofibre can be peeled off and have smooth homogenous texture and surface. The optimum electrospinning parameters were selected based on the presence of homogeneous nanofibrous network when viewed under FESEM in order to achieve high surface area for maximum phenol adsorption. shows the difference of morphological structures on the fibres. From the observation, the viable electrospun films had been produced under the parameters of 25 kV and at extrusion rate of 40 µL/min and the polymer solution volume was 5 mL with 20 cm distance between collector plate and needle tip. Applied voltage of 25 kV, 40 µL/min of intrusion rate and 10% of polymer solution had been selected to further fabricate the fibres for characterisation analysis and adsorption studies.
Figure 2. Morphological features of P(3HB-co-24.8 mol% 3HHx) using 5 w/v % solution in CHCl3:DMF (ratio:8:2) electrospun at (a) 20 kV; (b) 25 kV and (c) 30 kV, using 10 w/v % solution in CHCl3:DMF (ratio:7:3) electrospun at (d) 18 kV; (e) 20 kV; (f) 25 kV and (g) 30 kV, the same polymer in CHCl3:DMF (ratio:6:4) electrospun at (h) 18 kV; (i) 20 kV; (j) 25 kV and (k) 30 kV. P(3HB-co-24.8 mol% 3HHx) using 15 w/v % solution in CHCl3:DMF (ratio:8:2) electrospun at (l) 25 kV and in CHCl3:DMF (ratio:8:2) electrospun at (m) 18 kV; (n) and (o) 25 kV. All these polymer solutions were electrospun at constant extrusion rate: 40 μL/min.
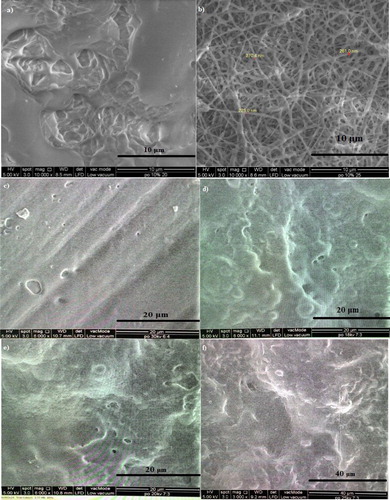
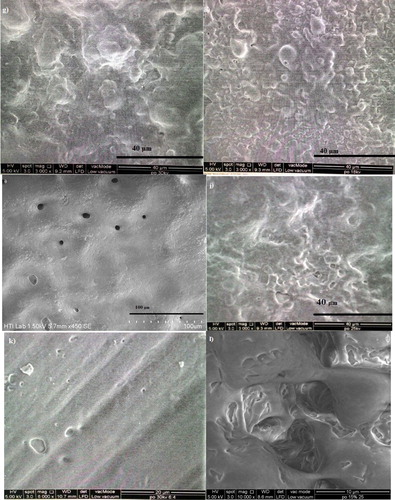
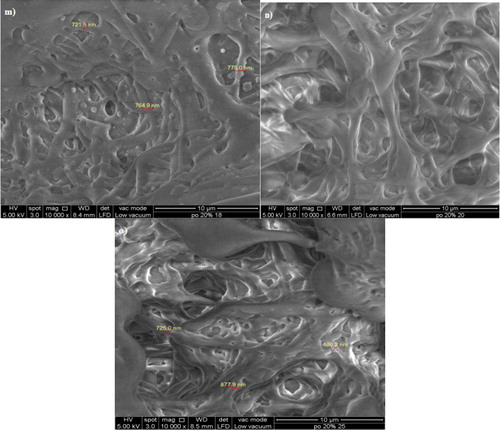
Figure 3. Morphological features of P(3HB-co-14.7 mol% 3HHx) using 5 w/v % solution in CHCl3:DMF (8:2) mixed solvent system at electrospun at (a) 18 kV and (b) 25 kV, in CHCl3:DMF (7:3) mixed solvent system electrospun at (c) 20 kV and (d) 25 Kv and in CHCl3:DMF (6:4 ) mixed solvent system electrospun at (e) 30 kV. Meanwhile, the Morphological features of [P(3HB-co-14.7 mol % 3HHx)] using 10 w/v % solution in CHCl3:DMF (8:2) mixed solvent system at electrospun at (f) 18 kV; (g) 20 kV; (h) 25 kV and (i) 30 kV and using 15 w/v % solution electrospun at (j) 20 kV and (k) 25 kV. All these similar polymer solution electrospun at constant extrusion rate: 40 μL/min.
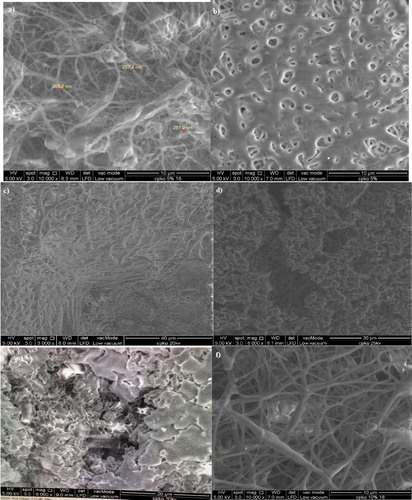
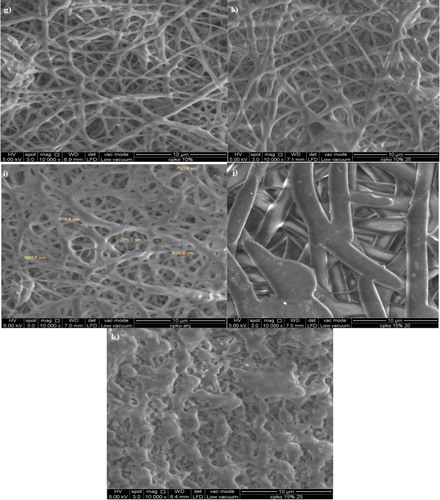
Figure 4. Morphological features of P(3HB) electrospun using 10 w/v % solution at (a) 15 kV and 15 w/v % solution electrospun at (b) 15 kV; (c) 18 kV; d) 20 kV, (e) 25 kV and (f) 30 kV at an extrusion of 40 µL/min using CHCl3:DMF (8:2) mixed solvent system.
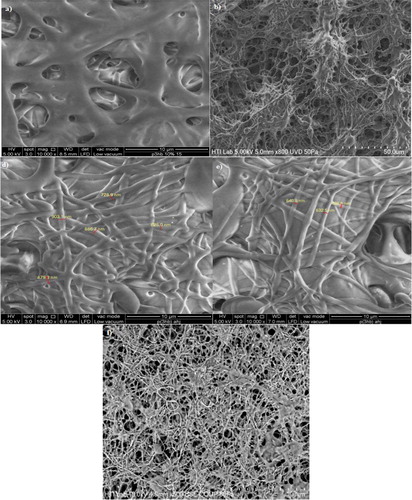
Figure 5. Morphological features of P(3HB-co-11.8 mol% 3HHx) electrospun at (a) 15 kV; (b) 18 kV; (c) 20 kV; (d) 25 kV and (e) 30 kV and P(3HB-co-8.4 mol% 3HHx) in CHCl3:DMF (ratio:8:2) electrospun at (f) 15 kV; (g) 20 kV and (h) 30 kV. Both these commercial polymer solutions were electrospun at constant extrusion rate: 40 μL/min, using 10 w/v % solution in CHCl3:DMF mixed solvent (ratio:8:2).
3.1.1. Effect of applied voltage on the fabrication of PHA electrospun film
To a certain degree, with the increase of voltage, the fibre becomes higher coalescence and the fibre diameters were found to be reduced especially in [P(3HB-co-14.7 mol % 3HHx)] 10 w/v. % (CHCl3:DMF) 8:2 and P(3HB) 15 w/v. % (CHCl3:DMF) 8:2. A previous study showed that the increasing applied voltage from 10 to 30 kV has caused the P(3HB) fibre to coalesce. This paper also reported the average fibre diameters were found to be decreased from 1.59 to 1.17 μm when the applied voltage is increased [Citation7]. Another recent study by Kuntzler et al. [Citation16] and Morais et al. [Citation17], the optimum conditions of their experiment was processed at 15 kV electric potential, and 0.45 mm diameter of the extrusion capillary.
Reduced nanofibre diameter was caused by the superior conductivity of the solution. The higher its charge capacity, the stronger the stretching forces [Citation18–20]. Spindle-like bead defects can be seen when lower voltage was used. This is due to the generation of the electrostatic repulsive force by the applied voltage that stretched out the solution jet, hence increased the evaporation rate, forming individual non-coalesce, thin and ultra-fine fibres which intensify the surface area. At the highest voltage of 30 kV, ridges and surface undulations were formed on the electrospun fibres due to fast extrusion and caused incomplete splaying of the jet, forming heterogeneous fibres which have lack of uniformity. This morphology observation has also been reported in other study [Citation21]. From these results, 25 kV was chosen as the optimum applied voltage for further fabrication of electrospun films as the fibres produced had less coalescence.
3.1.2. Effect of solution concentration on the fabrication of PHA electrospun film
It was determined that 40 μL/min of solution extrusion rate and 25 kV of voltage as the optimised parameter for further electrospinning process to fabricate homogenous individual strands. Electrospinning of PHA with different polymer solutions concentrations was tested. The PHA concentrations were set at 5, 10, 15 and 20 wt.% for P(3HB-co-24.8 mol% 3HHx), at 10, 15, 20 and 25 wt.% for P(3HB-co-14.7 mol% 3HHx) and only 10% and 15% for P(3HB) to test their homogeneity in order to improve fabrication technique. It was found that as concentration increased, the viscosity was also increased, thus making it difficult to be extruded through the capillary needle. Concentration of 15 wt.% and above cannot be used as dogging of the spinneret tip occurred and the solution cannot be pushed through the syringe needle. Low concentration of polymer at 5 wt.% was discovered to be incapable of producing perfect individual fibre as the solution was runny and tend to produce droplets. It was found that with less concentration, less entanglement of molecules happened, thus causing polymer jets to break into droplets rather than forming continuous jets. With the increase of concentration, some samples showed better fibre formation and homogenous pattern. It can be seen that 10 wt.% produced homogenous surface morphology and thus it was chosen as suitable parameter to further fabricate the nanofibres.
Electrospinning of polymer solutions with concentration higher than 10 wt.% was prohibited by their high viscosity as the solutions cannot be forced through the syringe needle, which can cause the flow rate to the tip to become uncontrolled, with messy and uneven spraying and having tendencies to form droplets. This parameter has also been tested in other study [Citation22] where at high concentration, the ability of the flow rate to be maintained and controlled by the processing parameter is difficult due to the cohesive nature of high viscosity fluid. High cohesiveness was caused by high viscosity of solution which resulted in instability of the fibre extrusion flow. Low viscosity will produce a lot of droplets while higher concentration was reported to form a bigger fibre diameter [Citation23]. From this study, polymer solution with concentration lower than 10 wt.% tends to form heterogeneous fibre, undulating morphology with a lot of fibre size variations and huge amount of overlapped fibre bundles or junctions. With these findings, it showed that combination parameters of 25 kV of voltage with 40 μL/min of solution extrusion rate and 10 w/v % of solution concentration give the best fibre morphology. These parameters were then used in the next step due to the fact that the nanofibres formed with these parameters have homogenous fibrous networks and much higher even fibre diameter.
3.1.3. Effect of solvent ratio on the fabrication of PHA electrospun film
The effects of (CHCl3:DMF) solvent ratio was tested by varying the mixed solvent ratio at 6:4, 7:3 and 8:2. These variations were conducted to study the viscosity and balance of up charges and electrostatic interaction of the concentration of samples from PO and CPKO for optimum fabrication process. It was found that the ratio of CHCl3:DMF of 8:2 produced homogenous nanofibres while other solvent ratios showed mostly flat surface and low quantity of homogenous fibrous network when viewed under FESEM. Thus, 8:2 ratio was selected for CHCl3:DMF mixing volume. Further fabrication test using this ratio for commercial and pure P(3HB) and its copolymer sample has proven the presence of fibrous network with low amount of overlapped strands and less occurrence of coalesce. These results showed the same outcome as when Sridewi et al. used optimised ratio of CHCl3:DMF of 4:1 to eectrospin P(3HB) nanofibres [Citation7]. When the mixed solvent was at 6:4 ratio, inadequate volume of CHCl3 caused insufficient polymer chain entanglement within the polymer solution. This happened due to the occurrence of Rayleigh instability as the spray jet broke down into droplets thus creating beads [Citation24]. As CHCl3 was increased, the degree of coalescence between fibre beads was reduced. Individual fibre formation is achieved with high concentration of solvent as sufficient chain entanglement overcome electrically driven jet and allows further jet elongation by electrostatic stress.
Suitable co-solvent helps to improve the electrical drive of the polymer-solvent system [Citation25] which in turn minimises its dependency towards high single solvent concentration. The integration of DMF helps to improve cohesion force of P(3HB) polymer chains. It also increases dielectric constant through increases electrical charges within the liquid so that the net charge density can be higher [Citation25] to upgrade stretching force to form homogenous fibres. The use of DMF eliminates bead defects. Certain agglomerates were seen entrapped in the porous beads due to the effect of phase separation. In order to form smooth and prolong stretching time, DMF was used which has higher boiling point than CHCl3 and can act to lower the evaporation rate of CHCl3 which is very volatile [Citation25]. Even though the evaporation rate of the solution was reduced, at the ratios of 6:4, the solvents caused intense charge repulsion of particles and ions and causing it to scattered to form many aggregates which tend to fuse the fibre. At 7:3 ratios, inhomogeneous fibre distribution was also seen, as the imbalance amount of DMF electrolytic solvent with CHCl3 has randomly dissociated the positive and negative charged ions in the polymer solution [Citation26]. However, at 8:2 ratios, homogenous fibres formation and even distribution was seen in the morphological features. This result is similar to that reported by Sudesh [Citation12]. As a result, the average nanofibre diameter obtained in this study is 252 nm.
3.2. Physicomechanical characteristics
3.2.1. PHA content
GC analysis showed that (P(3HB-co-3HHx) has two peaks at retention time of 4.3 min and 7.3 min which corresponds to 3HB and 3HHx monomers, respectively. On the other hand, P(3HB) has only single monomer of 3HB. CPKO substrate produced 54.75 w/v % of cell dry weight (CDW) of PHA content compared to PO which only gave 38.67 w/v % PHA content. Meanwhile, P(3HB) sample which was biologically recovered from mice faecal pellets is 46.50 w/v %.
The hydroxyalkanoic acids of the PHA copolymer are hydrolysed to the methyl esters [Citation27] to be analysed by GC which separate the composition and content of PHA. Theoretically and based on previous research, CPKO produced higher PHA content than any other oil palm products as it has higher saturated fatty acids content. GC result from this study showed similar outcome as CPKO substrate produced 54.75 w/v % of PHA content compared to PO which only gave 38.67 w/v % PHA content. This shows that the copolymer compositions vary depending on the carbon substrates supplied in the feed [Citation14]. P(3HB) sample recovered from mice faecal pellets had been chosen for further fabrication as the electrospinnability of the films were favourable than its counterpart which is commercially available P(3HB).
A study by Mifune et al. [Citation28] reported CPKO as substrate in PHA production showed high molar fractions of 3HHx, which was 56 mol %. The high content of lauric acid (C12) in CPKO which was 50% of total fatty acids had influenced the results obtained. This result is similar to previous studies where the short-chain length fatty acids (C4–C7) were highly favourable for the accumulation of higher 3HHx monomer [Citation28]. It was reported by Chee et al. [Citation29] that better cell growth and better production of P(3HB) was due to the presence of high concentrations of lauric acid and myristic acid in CPKO as Burkholderia sp. USM (JCM15050) produced high amount of P(3HB) with cell dry weight of 69 and 38 w/v %, respectively were produced at concentrations of 0.5% (w/v). In contrast, caproic acid (C6), caprylic acid (C8) and capric acid (C10) have no effect on cell growth. Even though Oleic acid (C18:1) which is an unsaturated fatty acid can produce P(3HB) of 48 w/v %, it provides negative effect on the cell biomass. Saturated stearic acid (C18:0) produced less than 1 w/v % P(3HB) [Citation28]. The effect of growth of C. necator on oleic acid and linoleic acid was also proven in previous studies. These two fatty acids are mainly rich in CPKO.
3.2.2. Molecular weight
GPC analysis in shows that the maximum weight-average molecular weight (Mw) obtained (590 × 103 Da) was from a commercial copolymer (Kaneka) which contained 8.4 mol% 3HHx monomer. The polydispersities (Mw/Mn) of the PHA homopolymer and copolymers investigated were within the area of 1.20–2.44. The number-average molecular weights (Mn) were in the range of 4.28–288 × 103 while the weight-average molecular weights (Mw) were in the range of 5.35–590 × 103. The commercial P(3HB) from Sigma-Aldrich has the lowest molecular weight and was found to be difficult to be dissolved in solvent and hence was not used for further electrospinning studies. The low molecular mass observed was due to the PHA synthase high expression level, which involves both soluble and granule bound PHA synthases. Meanwhile, P(3HB) recovered from mice faecal pellets had higher molecular weight than the commercial P(3HB) Sigma-Aldrich. It also showed higher electrospinnability, thus, it was further used for fabrication of nanofibres in adsorption studies.
Figure 6. Graph of molecular weight of polymer samples used in this study [where E + 05 is 10×5].
![Figure 6. Graph of molecular weight of polymer samples used in this study [where E + 05 is 10×5].](/cms/asset/3ad452ca-5da1-414f-a80d-edb98f160e16/tjen_a_1714599_f0006_b.jpg)
3.2.3. Thermal analysis
Differential scanning calorimetry (DSC) analysis showed that the melting temperature (Tm) of SCL-MCL polymer films decreased from 164.81 °C to 135.76 °C for the nanofibres and the enthalpy of fusion (ΔHm) decreased from 71.50 to 0.09 Jg−1 and 71.78–30.48 Jg−1 while the monomer compositions increased with the addition of 3HHx. The observed high heat fusion especially for P(3HB-co-3HHx) was due to the existence of long-chain monomer fraction which favoured side-chain crystallisation. This indicates that with the increase of 3HHx fraction, the crystallinity of nanofibres is also decreased. Despite all the 3HHx monomer content, the thermal degradation temperatures (Tm) of the copolymers persisted nearly unfluctuating at 274–284 °C at , P(3HB-co-3HHx) is much volatile as it thermal stability is inferior in contrast with P(3HB) as the overall T lowered compared to P(3HB). This is akin with previous studies results that showed the degradation T values rise with growing carbon number of the side chain for all the common copolymers, excluding P(3HB-co-3HHx). It was confirmed from the data recorded by other studies [Citation30,Citation31] that the highest degradation of polymers was in copolymers rather than homopolymers. P(3HB) recovered from mice pellet and P(3HB-co-11.8 mol% 3HHx) has greater melting temperature and enthalpy fusion than from the sample of the same type. The melting temperature and enthalpy of the nanofibrous material displayed slightly higher value. The temperatures at 5% weight loss (Td) of the polymers were in the range of 236–280 °C with the first derivative peak temperature (Tp) from 330 to 789.03 °C obtained by using TGA analysis (). The pinnacles of the first derivative demonstrate the point of most striking rate of progress on the weight reduction curve. shows the compilation of characterisation results.
Figure 7. The DSC thermogram of P(3HB-co-3HHx) electrospun polymer.
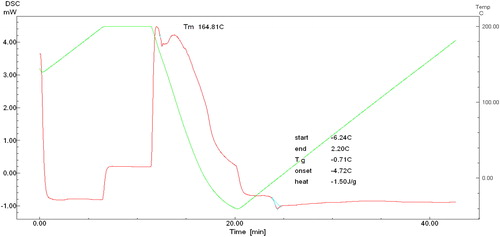
Figure 8. The TGA thermogram of P(3HB-co-3HHx) electrospun polymer.
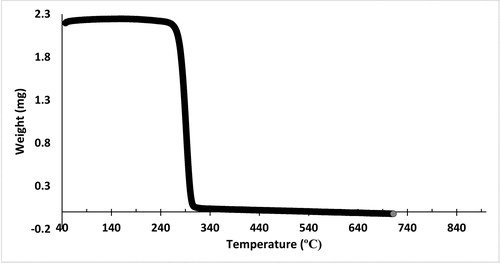
Table 2. Molecular weight, thermal characteristics and PHA composition of all nanofibres determined by GPC, DSC, TGA and GC respectively.
In comparison with P(3HB), PHA copolymers consisting of 3HB, 3HHx and other monomers are much flexible and have higher intensity of elongation to break. They have enhanced mechanical properties and process ability compared to P(3HB). It was also discovered that the copolymerisation of 3HB and 3HHx with extended alkyl side chain prevents isodimorphism as these monomers are incompatible into their respective crystalline lattices, hence causing the decreased in crystallinity. However, the elongation to break increased up to 85%. This type of PHA is used as film as the amounts of fused monomer units within it determine its physical and mechanical properties from hard, crystalline polymer to elastomeric rubber [Citation27]. P(3HB-co-3HHx) is a blended chain of scl and mcl-PHA which is intriguing as even with a small addition of 3HHx units (5 mol%) into the 3HB, it will reduce the melting point from 180 °C to less than 155 °C, in this manner essentially enhancing its thermal capacity and physical properties [Citation29]. This idea was also agreed by [Citation28] and [Citation27] as the decreased melting point below decomposition temperature has shown to have better mechanical properties and biocompatibility than homopolymer and scl-PHA. Apparently, P(3HB-co-3HHx) is less porous and much smoother compared to P(3HB) [Citation32] P(3HB)/3HHx blend and is suitable to be used for mouse fibroblast cell line L929 growth medium with 216 times effectiveness [Citation33].
3.3. Adsorption studies
3.3.1. Effect of contact time result on the adsorption of PHA polymer films
The effect of contact time on the adsorption of phenol onto electrospun nanofibre for a constant initial phenol concentration, (100 ppm) is as shown as in . The image of before and after the 270 min adsorption are shown as in , which exhibited clear colour changes after the experiment completed.
Figure 9. Graph of percentage of adsorption versus contact time of the most optimised sample.
[Initial phenol concentration = 100 ppm, aqueous solution volume = 50 mL, sample name of electrospun nanofibre = P(3HB-co-8.4 mol %3HHx), agitation = 100 rpm, aqueous solution original pH = 4.0, room temperature = 25 °C and weight of electrospun nanofibre = 0.14 g].
![Figure 9. Graph of percentage of adsorption versus contact time of the most optimised sample.[Initial phenol concentration = 100 ppm, aqueous solution volume = 50 mL, sample name of electrospun nanofibre = P(3HB-co-8.4 mol %3HHx), agitation = 100 rpm, aqueous solution original pH = 4.0, room temperature = 25 °C and weight of electrospun nanofibre = 0.14 g].](/cms/asset/272ac61f-8db6-467f-9bf0-cde512cdf48e/tjen_a_1714599_f0009_c.jpg)
Figure 10. Photograph image of phenol solution (a) before and (b) after 270 min of adsorption. [Initial phenol concentration = 100 ppm, aqueous solution volume = 50 mL, agitation = 100 rpm, aqueous solution original pH = 4.0, room temperature = 25 °C and weight of electrospun nanofibre = 0.14 g].
![Figure 10. Photograph image of phenol solution (a) before and (b) after 270 min of adsorption. [Initial phenol concentration = 100 ppm, aqueous solution volume = 50 mL, agitation = 100 rpm, aqueous solution original pH = 4.0, room temperature = 25 °C and weight of electrospun nanofibre = 0.14 g].](/cms/asset/ecd380fb-6316-4e49-a351-123f45b3877d/tjen_a_1714599_f0010_c.jpg)
It is worth to note in that the phenol adsorption is exceptionally proficient and rapid for the initial 10 min until the point that 150 min while it advance at a slower rate lastly achieves saturation point after 270 min where the amount of phenol adsorbed is almost constant for all samples. At this stage, the amount of adsorbed phenol achieved a dynamic equilibrium state with the amount of phenol in the solution. The phenol uptake process appeared to be rapid in less than 10 min and nearly 99.8% of total phenol uptake appeared within each contact time is adsorbed within that duration. Then, the adsorption increased from 99.8% starting at 180 min until 270 min to 99.9% after that period. The adsorption mechanism of phenol may be diminished as results of hydrogen bonding and van der Waals force. Physisorption occurred when the binding of adsorbate molecules to the surface worked through weak interactions of Van der Waals. The period required to reach the equilibrium state is termed as equilibrium time. The amount of adsorbed phenol at the equilibrium time demonstrated the greatest phenol adsorption under test conditions. The take-up of phenol onto the adsorbent is quick at starting stage and turned out to be slower towards the end. This is a result of countless surface sites or adsorption surface sites were accessible for adsorption amid the underlying stage, and after a specific timeframe, the staying empty surface destinations were hard to be possessed because of the repulsive forces between the solute particles on the strong and mass stages. The outcomes demonstrated that there are no variations in the adsorption limit following 270 min, along these lines 270 min is considered as the settled time for the adsorption process or known as retention time. Thus, P(3HB-co-8.4 mol% 3HHx) electrospun nanocomposite fibre is the optimum product to be used in the next kinetic adsorption calculations to determine maximum adsorption capacity. The equilibrium time for phenol to be adsorbed onto the adsorbent is found to be at 10 min contact time. These data are essential, as equilibrium time is one of the vital parameters for aggregate and sparing wastewater remediation system. The rate of phenol adsorption was remarkably high so that maximum uptake is sequestered from the aqueous solution. Characteristically, up to 99.8% of the adsorption takes place within the first 10 min of contact time. From , it shows that among all the samples tested, the commercial P(3HB-co-8.4 mol% 3HHx) has the highest noteworthy adsorption percentage.
Figure 11. Graph of percentage of adsorption versus contact time of the all sample.
[Initial phenol concentration = 100 ppm, aqueous solution volume = 50 mL, sample name of electrospun nanofibre = P(3HB-co-8.4 mol % 3HHx), agitation = 100 rpm, aqueous solution original pH = 4.0, room temperature = 25 °C and weight of electrospun nanofibre = 0.14 g]
![Figure 11. Graph of percentage of adsorption versus contact time of the all sample.[Initial phenol concentration = 100 ppm, aqueous solution volume = 50 mL, sample name of electrospun nanofibre = P(3HB-co-8.4 mol % 3HHx), agitation = 100 rpm, aqueous solution original pH = 4.0, room temperature = 25 °C and weight of electrospun nanofibre = 0.14 g]](/cms/asset/c1777239-e308-4102-bc8f-92d2c3becc52/tjen_a_1714599_f0011_c.jpg)
3.3.1.1. Adsorption kinetics
Based on , the nanofibre proved that the pseudo-second order is the isotherm kinetics of phenol adsorption and exhibited the highest degradation rate. is the result of pseudo-first and second kinetic order where the correlation coefficient was almost equal to 1 in pseudo-second-order plot compared to first-order plot.
Figure 12. Pseudo-second-order kinetic model on phenol adsorption capacity of P(3HB-co-8.4 mol %3HHx) electrospun nanofibre.
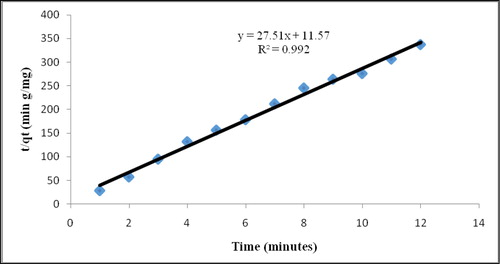
Table 3. Pseudo-first and second kinetic order results.
3.4. Effect of temperature
As shown in , electrospun nanofibre P(3HB-co-24.8 mol% 3HHx) has the utmost adsorption percentage with the increment of temperature. All samples adsorption percentage increased as the temperature increased. However, the nanofibres are not completely melted in the highest temperature set as their thermal degradation is higher than 60 °C. Thus, it is concluded that increment in temperature resulted in increased overall rate of adsorption.
Figure 13. Comparative plot of adsorption percentage of all samples versus temperature of aqueous solution [Initial phenol concentration = 100 mg/L, aqueous solution volume = 50 mL, zero agitation, aqueous solution original pH = 4.0 and weight of electrospun nanofibre = 0.14 g].
![Figure 13. Comparative plot of adsorption percentage of all samples versus temperature of aqueous solution [Initial phenol concentration = 100 mg/L, aqueous solution volume = 50 mL, zero agitation, aqueous solution original pH = 4.0 and weight of electrospun nanofibre = 0.14 g].](/cms/asset/c0e98160-0238-474b-aee6-7b4a0c765a51/tjen_a_1714599_f0013_c.jpg)
3.5. Effect of different pH on phenol adsorption
In this study, original pH of phenol/water mixture is measured to be pH 4.0 (acid). With the pH variations and alterations, the adsorption rate was observed to be also varied. The phenol adsorption percentage versus different pH plot is constructed as shown in .
Figure 14. Phenol adsorption percentage versus pH [Initial phenol concentration = 100 ppm, volume = 50 mL, agitation = 100 rpm, room temperature = 25 °C and weight of electrospun nanofibre = 0.14 g].
![Figure 14. Phenol adsorption percentage versus pH [Initial phenol concentration = 100 ppm, volume = 50 mL, agitation = 100 rpm, room temperature = 25 °C and weight of electrospun nanofibre = 0.14 g].](/cms/asset/f385ed58-ec9c-4582-b056-c89be6c5b9a0/tjen_a_1714599_f0014_c.jpg)
When phenol is in the water, it becomes a very weak acid. Phenoxide ion is formed as it stabilised and the negative charge on the oxygen atom is delocalised neighbouring the loop as shown in .
Figure 15. Formation of formamide ion when phenol is mixed with water [Citation3].
![Figure 15. Formation of formamide ion when phenol is mixed with water [Citation3].](/cms/asset/fbff6fad-4584-40a9-929e-b49a0a4b51de/tjen_a_1714599_f0015_c.jpg)
In another case, when phenol is attached to hydrocarbon, it can become very weak acid due to -OH group and a hydrogen particle can interfere with the bond from the -OH gathering and exchange to a base [Citation34]. From , phenol adsorption was observed to be efficient at acidic pH from 3 to 5. Commercial Kaneka P(3HB-co-8.4 mol% 3HHx) has the most elevated adsorption rate among all samples particularly at pH 4.0, followed by P(3HB-co-24.8 mol% 3HHx), P(3HB-co-14.7 mol% 3HHx) and P(3HB). At pH range of 3–5, phenol molecules are seeped into the adsorbent due to the associative characteristic of phenols which thereby increase adsorption.
At pH 6 and higher, the adsorption rate slowly declined till pH 10. Phenolates intermediates may have repulsed far from the impetus surface restricting adsorption of contaminant molecules at this pH. At pH 10, benzyl ring phenol becomes bulky and turned into hydrophobic. Thus, there is no electrostatic association between the layers of hydroxides present in the layers of the composite which likewise has a feeble proclivity for the phenolate anion. The presence of water as an oxidant and electron acceptor to the adsorption has expanded phenol elimination to 99.2%.
3.6. Effect of initial concentration on phenol adsorption
As appeared in , at low concentration, near total phenol molecules were adsorbed rapidly onto the nanofibre surface areas. Further increments in the underlying phenol concentration prompted abrupt saturation of adsorbent surface active sites where the adsorption proceeds to decline slowly starting at 100 ppm until 300 ppm of phenol concentration. It is noted that adsorption at various phenol fixations was quick at the underlying stages and continuously diminished with the advancement of adsorption until the point when equilibrium was achieved. At the point when the adsorption achieved the saturation point, there were no extra phenols could be taken up by the nanofibre surface sites, thus adsorption process subsided and gradually stops due to the repulsion between molecules of the solute that already binding with the sites and molecules of the solute that still remains within the solute [Citation35].
Figure 16. Adsorption percentage versus initial phenol concentration [aqueous solution volume = 50 mL, agitation = 100 rpm, aqueous solution original pH = 4.0, temperature = 25 °C and weight of electrospun nanofibre = 0.14 g].
![Figure 16. Adsorption percentage versus initial phenol concentration [aqueous solution volume = 50 mL, agitation = 100 rpm, aqueous solution original pH = 4.0, temperature = 25 °C and weight of electrospun nanofibre = 0.14 g].](/cms/asset/a2503e21-aa02-4383-adff-7ff406d081eb/tjen_a_1714599_f0016_c.jpg)
Both Langmuir and Freundlich isotherm models results reflect the presence of more than one kind of adsorbent–adsorbate surface interaction [Citation36]. Based on the result obtained in and , Freundlich model showed a higher correlation coefficient of R2 than Langmuir model. The correlation coefficients, R2 of both isotherm models were compared to determine which one is the most applicable model to represent the adsorption data. Correlation coefficient of Freundlich model is 0.99 which explain the applicability of Freundlich model to the adsorption of phenol onto the nanofibres. Thus, Freundlich model is reasonable fittings for the adsorption data. The maximum adsorption capacity, qs of the electrospun nanofibre for phenol using Freundlich model is found to be 59.047 mg/g. Thus, it was concluded that the biosorption process of phenol by electrospun nanofibres is heterogenous layer formation biosorption.
Figure 17. Freundlich isotherm model.
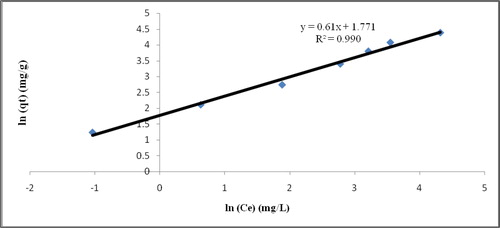
Table 4. Langmuir and Freundlich isotherm results.
The value Kf of Freudlich isotherm indicates the ease of separation phenol ions from aqueous solution as mentioned by [Citation37] where in this study is quite high. This shows that the removal of phenol is easy and efficient. 1/n gives a sign of the feasibility of biosorption and the values of nf > 1 speak to positive biosorption condition. In this investigation, n values were observed to be 1.639 and which shows that the adsorption power is positive over the whole scope of fixation considered. In general, the consequence of adsorption isotherm examination demonstrates that the adsorption of phenol onto the nanofibres display both Langmuir and Freundlich isotherm show trademark which mirroring the imminence of in excess of one sort of adsorbent–adsorbate surface collaboration.
One of the vital properties of the electrospun nanofibre is the adsorption limit, which is straightforwardly influenced by the surface area. The two states of the adsorption isotherm of Langmuir and Freundlich delineated that subjective data on the adsorption capacity and also the degree of surface area accessible to the adsorbate. The availability of bigger surface area improves adsorption capacity of phenol uptake onto the nanofibre surfaces [Citation38].
4. Conclusion
The P(3HB-co-3HHx) and P(3HB) electrospun nanofibres are able to adsorb organic molecules of phenol. The optimised electrospinning parameters are 25 kV of applied voltage, with extrusion rate of 40 µL/min and 10 w/v% of P(3HB-co-3HHx) electrospun precursor solutions that were prepared using a mixed solvent system of chloroform and dimethylformamide at a ratio of 8:2. The optimised nanofibre (average fibre diameter = 252 nm) is able to achieve 99.9% phenol removal and maximum adsorption capacity of 59.047 mg/g. The maximum adsorption capacity reached at pH 4, at the temperature of 60 °C, 100 rpm and reached equilibrium time of 10 min and showed a good agreement with Freundlich isotherm model (R2 = 0.99). The nanofibre also illustrated pseudo-second order as the isotherm kinetics of phenol adsorption. In summary, P(3HB-co-3HHx) and P(3HB) based nanofibres exhibit good adsorption potential for phenol. These environmental friendly polymers are also produced from renewable sources which can bring down the production cost. More research on the improvement of the nanostructure of the polymers for phenol adsorption is needed to achieve greater maximum adsorption capacity.
Notes on contributors
Conceptualization: N.S. and A.H.; Methodology: N.S. and K.S.; Writing (Original Draft Preparation): A.H. and A.M.; Writing (Review & Editing): N.S., K.S. and S.S.; Funding Acquisition: N.S. and K.S.
Acknowledgements
A. H. acknowledges members of Ecobiomaterial Lab 409 from Universiti Sains Malaysia (USM) Penang Campus and Ms. Kasturi from Nottingham University, Semenyih for the guidance, facilities and support.
Disclosure statement
No potential conflict of interest was reported by the authors.
Correction Statement
This article has been republished with minor changes. These changes do not impact the academic content of the article.
Additional information
Funding
References
- Speight JG. 2017. Chapter 3 – industrial organic chemistry, environmental organic chemistry for engineers. OXford: Butterworth-Heinemann. p. 87–151.
- U.S. Environmental Protection Agency. 2018. 2018 edition of the Drinking Water Standards and Health Advisories EPA 822-F-18-001. Washington (DC): Office of Water, U.S. Environmental Protection Agency.
- Wako T. 2012. Industrial wastewater management in Japan. Tokyo: Water Environment Division Environment Management Bureau, Ministry of the Environment.
- Tjoon TT, Ling WL. Removal of dyes and pigments from industrial effluent. In: Sharma S, Sanghi R, editors. Advances in water treatment and pollution prevention. Vol. 4. Dordrecht: Springer; 2012. p. 69.
- Khanna S, Srivastava AK. Recent advances in microbial polyhydroxyalkanoates. Proc Biochem. 2005;40(2):607–619.
- Furrer PC. Medium-chain-length poly(R-3-hydroxyalkanoates): from biosynthesis towards medical applications. Eidgenössische Technische Hochschule ETH Zürich, Nr. 17654 [dissertation]. 2008. Available from:
- Sridewi N, Lee Y-F, Sudesh K. Simultaneous adsorption and photocatalytic degradation of malachite green using electrospun P(3HB)-TiO2 nanocomposite fibers and films. Int J Photoenergy. 2011;2011:59785.
- Sridewi N, Tan L-T, Sudesh K. Solar photocatalytic decolorization and detoxification of industrial batik dye wastewater using P(3HB)-TiO2 nanocomposite films. CLEAN Soil Air Water. 2011;9(3):265–273.
- Alam MZ, Muyibi SA, Mansor MF, Wahid R. Activated carbons derived from oil palm empty-fruit bunches: application to environmental problems. J Environ Sci. 2007;19:103–108.
- Gawande SB, Gawande KB, Sanjay R, et al. Photocatalytic degradation of phenol over novel rod shaped Graphene@BiPO4 nanocomposite. J Phys Chem Solids. 2015;85:132–137.
- Sharabi D, Paz Y. Preferential photodegradation of contaminants by molecular imprinting on titanium dioxide. Appl Catal B. 2010;95(1–2):169–178.
- Sudesh K. 2013. Polyhydroxyalkanoates from palm oil: biodegradable plastics. Berlin: Springer.
- Budde CF, Riedel SL, Willis LB, et al. Production of poly(3-hydroxybutyrate-co-3-hydroxyhexanoate) from plant oil by engineered Ralstonia eutropha strains. Appl Environ Microbiol. 2011;77(9):2847–2854.
- Wong Y-M, Brigham CJ, Rha C, et al. Biosynthesis and characterization of polyhydroxyalkanoate containing high 3-hydroxyhexanoate monomer fraction from crude palm kernel oil by recombinant Cupriavidus necator. Bioresource Technology. 2012;121:320–327.
- Kunasundari B, Arza C R, Maurer FH, et al. Biological recovery and properties of poly(3-hydroxybutyrate) from Cupriavidus necator H16. Separation and Purification Technology. 2017;172:1–6.
- Kuntzler SG, Almeida ACA, de Costa JAV, et al. Polyhydroxybutyrate and phenolic compounds microalgae electrospun nanofibers: a novel nanomaterial with antibacterial activity. Int J Biol Macromol. 2018;113:1008–1014.
- Morais MG, de Stillings C, Dersch R, et al. Extraction of poly(3-hydroxybutyrate) from Spirulina LEB 18 for developing nanofibers. Polímeros. 2015;25(2):161–167.
- Zong XH, Kim K, Fang DF, et al. Structure and process relationship of electrospun bioabsorbable nanofiber membranes. Polymer. 2002;43(16):4403–4412.
- Reneker DH, Yarin AL. Electrospinning jet and polymer nanofibers. Polymer. 2008;49(10):2387–2425.
- Beachley V, Wen X. Fabrication of nanofiber reinforced protein structures for tissue engineering. Mater Sci Eng C. 2009;29(8):2448–2453.
- Eda G, Shivkumar S. Bead-to-fiber transition in electrospunpolysterene. J Appl Polym Sci. 2007;106:45–487.
- Deitzel JM, Kleinmeyer J, Harris D, et al. The effect of processing variables on the morphology of electrospun nanofibers and textiles. Polymer. 2001;42(1):261–272.
- Huang Z-M, Zhang Y-Z, Kotaki M, et al. A review on polymer nanofibers by electrospinning and their applications in nanocomposites. Compos Sci Technol. 2003;63(15):2223–2253.
- Shenoy SL, Bates WD, Frisch HL, et al. Role of chain entanglements on fiber formation during electrospinning of polymer solutions: good solvent, non-specificpolymer-polymer interaction limit. Polymer. 2005;46(10):3372–3384.
- Cheng M-L, Lin C-C, Su H-L, et al. Processing and characterization of electrospun poly(3-hydroxybutyrate-co-3-hydroxyhexanoate) nanofibrous membranes. Polymer. 2008;49(2):546–553.
- Lee KH, Kim HY, Bang HJ, et al. The change of bead morphology formed on electrospunpolysterenefibers. Polymer. 2003;44(14):4029–4034.
- Baidurah S, Murugan P, Joyyi L, et al. Validation of thermally assisted hydrolysis and methylation-gas chromatography for rapid and direct compositional analysis of poly(3-hydroxybutyrate-co-3-hydroxyhexanoate) in whole bacterial cells. J Chromatogr A. 2016;1471:186–191.
- Mifune J, Nakamura S, Fukui T. Targeted engineering of Cupriavidus necator chromosome for biosynthesis of poly(3-hydroxybutyrate-co-3hydroxyhexanoate) from vegetable oil. Can J Chem. 2008;86(6):621–627.
- Chee JY, Sudesh K, Tan Y, et al. Isolation and characterization of a Burkholderia sp. USM (JCM15050) capable of producing polyhydroxyalkanoate (PHA) from triglycerides, fatty acids and glycerols. J Polym Environ. 2010;18(4):584–592.
- Mergaert J, Webb A, Anderson C, et al. Microbial degradation of poly(3-hydroxybutyrate) and poly(3-hydroxybuty rate-co-3-hydroxyvalerate) in soils. Appl Environ Microbiol. 1993;59(10):3233–32388.
- Wang YW, Mo W, Yao H, et al. Biodegradation studies of poly(3-hydroxybutyrate-co-3-hydroxyhexanoate). Polym Degrad Stab. 2004;85(2):815–821.
- Zhao K, Deng Y, Chen JC, et al. Polyhydroxyalkanoate (PHA) scaffolds with good mechanical properties and biocompatibility. Biomaterials. 2003;24(6):1041–1045.
- Werner C, Freier T. Biopolyesters in tissue engineering applications. In: Werner C, editor. Polymers for regenerative medicine. Vol. 203. Berlin/Heidelberg: Springer; 2006. p. 1–61.
- Sudesh K, Bhubalan K, Chuah J-A, et al. Synthesis of polyhydroxyalkanoate from palm oil and some new applications. Appl Microbiol Biotechnol. 2011;89(5):1373–1386.
- Ahalya N, Kanamadi RD, Ramachandra TV. Biosorption of chromium (VI) from aqueous solutions by the husk of Bengal gram (Cicer arientinum). Electron J Biotechnol. 2005;8(3):258–264.
- Chandra T C, Mirna MM, Sudaryanto Y, et al. Adsorption of basic dye onto activated carbon prepared from durian shell: Studies of adsorption equilibrium and kinetics. Chemical Engineering Journal. 2007;127(1-3):121–129.
- Hameed BH. Equilibrium and kinetic studies of methyl violet sorption by agricultural waste. J Hazard Mater. 2008;154(1–3):204–212.
- Gusmao KAG, Gurgel LVA, Melo TMS, et al. Application of succinylated sugarcane bagasse as adsorbent to remove methylene blue and gentian violet from aqueous solutions – kinetic and equilibrium studies. Dyes Pigments. 2012;92:967–974.