
Abstract
In this article, we report a simple, effective, sensitive, non-toxic and environmentally friendly method for the detection of dopamine (DA). This method utilises the property of the self-polymerization of dopamine under alkaline conditions, and gets the concentration of dopamine by measuring the fluorescence intensity of polydopamine (PDA) nanoparticles. And this method only uses NaHCO3 to start the polymerization process, so that the detection experiment becomes simple and inexpensive. The fluorescence intensities of the mixed solution produced at different reaction times and different concentrations were studied. Finally, a good linear relationship was obtained in the range of 1.0-400 μM with a correlation coefficient of 0.9946 and a detection limit of 0.3 μM. The method has high selectivity and important application value for detecting dopamine-related diseases.
1. Introduction
Fluorescence analysis is a very important way of detection method due to its characteristics, including high sensitivity, good selectivity, relatively simple instrument structure, and low price [Citation1]. When the fluorescent probe with substrate being analyzed, its fluorescence intensity will occur changes. It can quantify the concentration of the substrate by the changes of fluorescence spectra. Therefore, the fluorescence analysis method has been widely used in the field of analysis, including the determination of inorganic, organic and biological macromolecules [Citation2–4]. The existing fluorescence detection methods usually involve a interaction process of fluorescent substance and analyte substance. This interaction process can enhance or quench the fluorescence intensity of the fluorescent substance, and the concentration of the analyte substance can be determined by studying the change of the fluorescence intensity. For the detection of analyte substance, fluorescent substance is unavoidably introduced, which complicates the detection process. Therefore, if the analyte substance can have fluorescent property, the fluorescence detection method will be simple and accurate.
Dopamine (DA), an organic chemical of the catecholamine and phenethylamine family, is an important neurotransmitter in the brain of animals [Citation5]. And it can regulate many biological processes in the biological central nervous system, such as perception, emotion, and neuroendocrine secretion, while also delivering messages of excitement and happiness [Citation6–9]. In recent years, some studies have been found that the concentration of dopamine (such as plasma, urine, etc.) is related to the health of individuals in biological fluids. And the concentration of dopamine can be used as an indicator of multifarious diseases in organisms, such as schizophrenia, Parkinson’s and Huntington’s diseases [Citation10–12]. Therefore, the accurate detection of dopamine concentrations is particularly important for the disease discrimination in biological fluids. Nowadays, there are many complicated methods for the detection of dopamine, including electrochemical analysis, capillary electrophoresis, high performance liquid chromatography and fluorescent probes (e.g. organic dyes and quantum dots) [Citation13–17]. However, these methods often involve a number of complex processes, high cost and tedious sample pre-treatment, or are susceptible to interference [Citation18–19]. Therefore, it is particularly important to find a novel method with low cost, good selectivity and simple steps for the detection of dopamine.
As we know, DA doesn’t have fluorescence, but it has been found that dopamine can be oxidatively polymerised to PDA [Citation20–22]. Surprisingly, the purified PDA nanoparticles could produce green fluorescence under ultraviolet light [Citation23]. Inspired by this work, it is necessary to find a novel detection method by making dopamine produce fluorescence without fluorescent substance for the detection of DA. In this work, we report a rather facile and effective strategy for the detection of DA by using the self-polymerization of DA on the basis of the fluorescence detection with some modifications. The detection experiments have been carried out and proved that there was a mathematical relationship between DA concentration and the fluorescence intensity of PDA nanoparticles. So we can use the fluorescence intensity of PDA nanoparticles to detect the concentration of DA.
2. Experiment
2.1. Reagents and chemicals
All chemicals were of analytical grade reagents. Dopamine (DA, 98%) and NaHCO3 were purchased from Aladdin reagent Co. Ltd. (Shanghai, China). All other solvents and chemicals were obtained from Sinopharm Chemical Reagent Co., Ltd. Double distilled water (DDW) was used throughout the experimental procedures.
2.2. Preparation of test solution
DA was diluted by NaHCO3 solution in a 10 mL colorimetric tube, and the NaHCO3 solution concentration was adjusted to ensure that the final pH of the mixed solution was 8.5 at the same time. After the tube had stood for a certain time, a portion of the solution was transferred into a cuvette for the fluorescence detection.
2.3. Measurement conditions
The fluorescence spectra were measured on a fluorescence spectrophotometer (F97 Pro) with a slit width of 1.0 nm. The fluorescence detection experiments were operated under the same conditions: the slit widths of the emission and excitation were both 10 nm, the excitation wavelength was set at 370 nm with a recording emission range of 450–600 nm, and the photomultiplier tube voltage was set at 900 V.
2.4. Laboratory apparatus
The fluorescence measurements were carried out by using F97 pro fluorescence spectrophotometer (Shanghai) equipped with a xenon flash lamp. The UV-Vis measurement was performed using UV-2550 (Shimadzu, Japan). Transmission electron microscope measurement was performed using JEM-2100 (JEOL, Japan).
3. Results and discussion
3.1. The procedure and principle of dopamine test
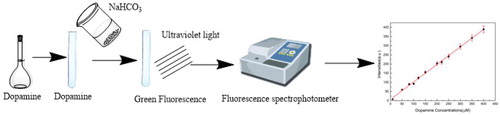
As shown in , a certain volume of dopamine solution and a certain amount of NaHCO3 solution were added to a 10 mL colorimetric tube to ensure that the final pH of the mixture solution was 8.5. The colour of the mixture solution turned pale yellow at room temperature after a certain time, which was light green under ultraviolet lamp. Then, the fluorescence intensity of the mixture solution was measured by the fluorescence spectrophotometer, and the dopamine concentration was measured by further calculation. The novel dopamine detection method does not need any fluorescent substances in the test solution, and it further reduces the experimental error and simplifies the experimental operation procedure.
Figure 1. The procedure of dopamine detection.
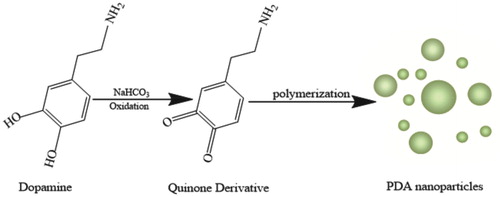
The pH of the solution is an important factor for the experiment. After adding dopamine solution and NaHCO3 solution, the pH value of the mixture solution must be regulated to 8.5 by adjusting the amount of NaHCO3 solution. As shown in , the dopamine oxidised to a quinone derivative under alkaline condition. At the same time, the quinone derivative was unstable under alkaline condition and rapidly polymerised to form PDA nanoparticles. And then DA concentration could be detected by the fluorescence intensity of the PDA nanoparticles.
Figure 2. The schematic diagram of dopamine detection.
3.2. The characterisation of PDA
The transmission electron micrograph (TEM) image of PDA is shown in figure S1. The fluorescence excitation spectra of PDA is shown in figure S2. The UV-vis spectra of PDA is shown in figure S3.
3.3. Effect of reaction time
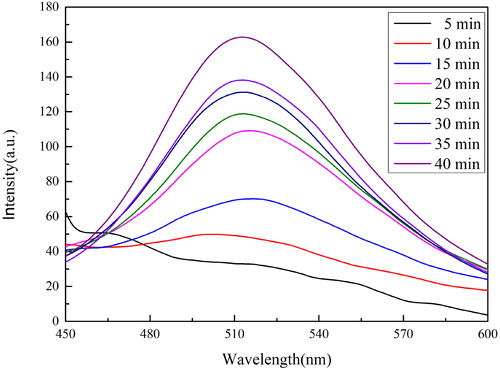
shows the fluorescence spectra of DA test solution (130 μM) at different reaction times and the same excitation wavelength (λex = 370 nm). Obviously, one emission peak gradually formed at around 515 nm after NaHCO3 solution was added, and had great changes on fluorescence intensity at different reaction times. As shown in , the fluorescence intensity increased slowly in 15 min. This may be due to the fact that the weak basicity of NaHCO3 solution results in the incomplete conversion of dopamine to PDA nanoparticles in a short period of time, and there are also quinone derivative in solution. The fluorescence intensity rose rapidly after 15 min and the fluorescence intensity increased slowly after 30 min. This phenomenon proves that dopamine had almost completely converted into PDA nanoparticles after 30 min. Therefore, we selected 30 min as the incubation time for experiments.
Figure 3. Fluorescence spectra of test solution at different times (CDA: 130 μM).
3.4. Relationship between DA concentrations and fluorescence intensities
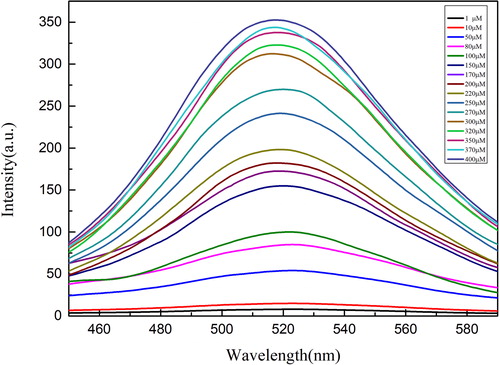
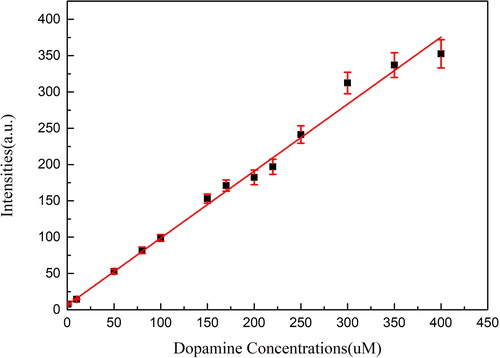
As shown in , the fluorescence intensities of the test solutions with different concentrations of DA were measured at an excitation wavelength of 370 nm and a reaction time of 30 min. After a series of experiments, it could be found that DA concentration had a significant impact on the fluorescence intensity of the test solution, and the fluorescence intensity could be increased with the increase of DA concentration. Obviously, a sharp peak was formed at the wavelength of 515 nm when the concentration of DA was more than 100 μM. When the concentration was 200 μM, the peak shape became stable and the fluorescence spectrum of the solution was easy to observe. In addition, an interesting phenomenon was found that the emission peak was always fixed around 515 nm, and the increase of fluorescence intensity was somewhat uniform. Therefore, there may be some mathematical relationship between dopamine concentrations and fluorescence intensities.
Figure 4. Fluorescence spectra of the test solutions with different DA concentrations at the same test condition.
After a series of experiments, it could be found that there was a linear relationship between DA concentrations and fluorescence intensities. As shown in , the linear dependence (F = 6.35946 + 0.92278·c) at the range from 1.0-400 μM was obtained with a correlation coefficient of 0.9946. The detection limit (3σ/k) was 0.3 μM, in which k was the slope of the calibration line and σ was the standard deviation of blank measurements (n = 11). This finding provides a rapid, simple and feasible way for the detection of DA.
Figure 5. Linear relationship between dopamine concentrations and fluorescence intensities.
As shown in , it can be compared with other reported methods and even better than other methods. Obviously, the method reported in this paper has lower detection limit and a larger linear range.
Table 1. Comparison between present method and literature.
3.5. Interference study
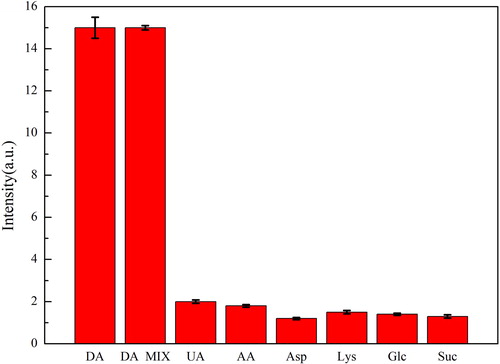
In order to evaluate the feasibility and selectivity of the method, chemical interference substances were introduced in the detection experiment, the concentration of DA was 10 μM and the concentrations of interfering substances were both 100 μM. As shown in , the interfering substances didn’t produce fluorescent signal even at such high concentrations. Thus, the novel detection method has good selective.
Figure 6. The fluorescence intensities of DA test solution and other test solutions with different chemicals. (DA concentration was 10 μM and the concentrations of other substances were both100 μM. DA MIX, mixture of all interfering chemicals; UA, uric acid; AA, ascorbic acid; Asp, aspartic acid; Lys, lysine; Glc, glucose; Suc, sucrose).
3.6. Applications in real samples
In order to evaluate whether this method can be used for detecting DA concentration, the samples of the normal human serum were collected and diluted. Different volumes of DA standard solutions (concentration range 10 µM - 30 µM) were added to the serum samples, respectively. And then NaHCO3 solution was added to bring the serum sample pH to 8.5. After detection and calculation, good recoveries from 98.3% to 105.2% were obtained and the experimental data were shown in . The results show that the method has high selectivity and high sensitivity, which is suitable for actual sample analysis and can quickly detect DA.
Table 2. Recovery of DA in serum samples with different additions of DA (n = 5).
4. Conclusions
In summary, a novel and simple DA detection method was established based on the fluorescence intensity of PDA nanoparticles. For the optimal experimental conditions, the experiments were carried out on different concentrations of DA and recorded fluorescence intensity values. Finally, a mathematical relationship between dopamine concentrations and fluorescence intensities was found, and a good linear relationship was obtained with a detection limit of 0.3 μM. Compared with the traditional DA detection methods, the novel detection method has lots of advantages, such as low cost, simple operation, and high selectivity. It can be predicted that the novel detection method will play a crucial role in the detection of future diseases which need to be determined by DA concentration.
Supplemental Material
Download MS Word (1.3 MB)Disclosure statement
No potential conflict of interest was reported by the author(s).
Additional information
Funding
Notes on contributors
Xinghui Gong
Xinghui Gong is a lecturer at School of Water and Environment, Chang'an University, China. His research interests focus mainly on the field of water and environment.
Tong Wang
Tong Wang is a master degree candidate at School of Water and Environment, Chang'an University, China. His research interests focus mainly on the field of environmental science and optical sensors.
Zhendong Zhang
Zhendong Zhang is a master degree candidate at School of Water and Environment, Chang'an University, China. His research interests focus mainly on the field of environmental science and optical sensors.
Xiao Wei
Xiao Wei is a associate professor at School of Water and Environment, Chang'an University, China. His research interests focus mainly on the field of environmental science and optical sensors.
References
- Wang HB, Zhang HD, Chen Y, et al. A label-free and ultrasensitive fluorescent sensor for dopamine detection based on double-stranded DNA templated copper nanoparticles. Sens Actuators B Chem. 2015; 220:146–153.
- Ali EM, Zheng YG, Yu HH, et al. Ultrasensitive Pb2+ detection by glutathione-capped quantum dots. Anal Chem. 2007;79(24):9452–9458.
- Gao DM, Fang QK, Zhang ZP, et al. Amine-capped ZnS-Mn2+ nanocrystals for fluorescence detection of trace TNT explosive. Anal Chem. 2008;80(9):3458–3465.
- Xu X, Liu X, Nie Z, et al. Label-free fluorescent detection of protein kinase activity based on the aggregation behavior of unmodified quantum dots. Anal Chem. 2011;83(1):52–59.
- Missale C, Nash SR, Robinson SW, et al. Dopamine receptors: from structure to function. Physiol Rev. 1998;78(1):189–225.
- Ji X, Palui G, Avellini T, et al. On the pH-dependent quenching of quantum dot photoluminescence by redox active dopamine. J Am Chem Soc. 2012;134(13):6006–6017.
- Lin Y, Chen C, Wang C, et al. Silver nanoprobe for sensitive and selective colorimetric detection of dopamine via robust Ag-catechol interaction. Chem Commun. 2011;47(4):1181–1183.
- Robinson DL, Hermans A, Seipel AT, et al. Monitoring rapid chemical communication in the brain. Chem Rev. 2008;108(7):2554–2584.
- Hyman SE, Malenka RC. Addiction and the brain: the neurobiology of compulsion and its persistence. Nat Rev Neurosci. 2001;2(10):695–703.
- Sun YG, Cui H, Li YH, et al. Determination of some catechol derivatives by a flow injection electrochemiluminescent inhibition method. Talanta. 2000;53(3):661–666.
- Liu J, Mori A. Monoamine metabolism provides an antioxidant defense in the brain against oxidant- and free radical-induced damage. Arch Biochem Biophys. 1993;302(1):118–127.
- Miura T, Muraoka S, Ogiso T. Antioxidant activity of adrenergic agents derived from catechol. Biochem Pharmacol. 1998;55(12):2001–2006.
- Baron R, Zayats M, Willner I, et al. DOPA-, adrenaline-, and noradrenaline-induced growth of Au nanoparticles: assays for the detection of neurotransmitters and of tyrosinase activity. Anal Chem. 2005;77(6):1566–1571.
- Malem F, Mandler D. Self-assembled monolayers in electro-analytical chemistry: application of w-mercapto carboxylic acid monolayers for the electrochemical detection of dopamine in the presence of a high concentration of ascorbic acid. Anal Chem. 1993;65(1):37–41.
- Wu WC, Chang HW, Tsai YC. Electrocatalytic detection of dopamine in the presence of ascorbic acid and uric acid at silicon carbide coated electrodes. Chem Commun. 2011;47(22):6458–6460.
- Tao Y, Lin Y, Ren J, et al. A dual fluorometric and colorimetric sensor for dopamine based on BSA-stabilized Aunanoclusters. Biosens Bioelectron. 2013; 42:41–46.
- Nikolajsen RPH, Hansen AM. Analytical methods for determining urinary catecholamines in healthy subjects. Anal Chim Acta. 2001;449(1-2):1–15.
- Wang HB, Li Y, Bai HY, et al. Fluorescent determination of dopamine using polythymine-templated copper nanoclusters. Anal Lett. 2018;51(18):2868–2877.
- Wang HB, Li Y, Dong GL, et al. A convenient and label-free colorimetric assay for dopamine detection based on the inhibition of the Cu (II) -catalyzed oxidation of a 3,3 0, 5,5 0 - tetramethylbenzidine–H2O2 system. New J Chem. 2017;41(23):14364–14369.
- Olsen S, Riesz J, Mahadevan I, et al. Convergent proton-transfer photocycles violate mirror-image symmetry in a key melanin monomer. J Am Chem Soc. 2007;129(21):6672–6673.
- Nighswander-Rempel S, Riesz J, Gilmore J, et al. A quantum yield map for synthetic eumelanin. J Chem Phys. 2005;123(19):194901–194906.
- Meredith P, Powell BJ, Riesz J, et al. Towards structure-property-function relationships for Eumelanin. Soft Matter. 2006;2(1):37.
- Vecchia NFD, Avolio R, Alfe M, et al. Building‐block diversity in polydopamine underpins a multifunctional eumelanin‐type platform tunable through a quinone control point. Adv Funct Mater. 2013;23(10):1331–1340.
- Florescu M, David M. Tyrosinase-based biosensors for selective dopamine detection. Sensors. 2017; 17:1314.
- Farahmand Nejad MA, Hormozi-Nezhad MR. Design of a ratiometric fluorescent probe for naked eye detection of dopamine. Anal Methods. 2017;9(23):3505–3512.
- Nezhad MRH, Tashkhourian J, Khodaveisi J. Sensitive spectrophotometric detection of dopamine, levodopa and adrenaline using surface plasmon resonance band of silver nanoparticles. JICS. 2010;7(S2):S83–S91.
- Zheng Y-Y, Li C-X, Ding X-T, et al. Detection of dopamine at graphene-ZIF-8 nanocomposite modified electrode. Chin Chem Lett. 2017;28(7):1473–1478.