
 ?Mathematical formulae have been encoded as MathML and are displayed in this HTML version using MathJax in order to improve their display. Uncheck the box to turn MathJax off. This feature requires Javascript. Click on a formula to zoom.
Abstract
This study investigated the removal of phosphorus (PO4−3-P) from water samples by SnO2 and WO3 nanoparticles (NPs). The effects of adsorbent dosage, pH, contact time and temperature with an initial concentration of 50 mg L−1 of P were investigated. SEM-EDX, FTIR, XRD, and BET analyses were performed to characterize these nanoparticles. The results indicated that the maximum adsorption capacity of SnO2 and WO3 NPs was 21.5 and 19.0 mg g−1, respectively and occurred at pH = 3. Within 40 min of operation, about 47.2% and 45.2% of P ion were removed from the solutions by SnO2 and WO3 NPs, respectively. The kinetics of P adsorption from solutions was analyzed by fitting the experimental data to the pseudo-first and second-order kinetic models. The result showed that the pseudo-second-order kinetics model provided much better R2 values. In the multi-component solutions, in the presence of Cl−, NO3− and Cr2O72− ions, the adsorption rates decreased to (26.2% and 28.5%), (27.2% and 30.0%), and (48.0% and 33.0%) by SnO2 and WO3 NPs, respectively. Thermodynamic data (ΔG°< 0) fitting showed that the reactions of adsorption of P were spontaneous. In general, the nanoparticles of SnO2 had better efficiency in the removal of phosphorous from water.
1. Introduction
Phosphorus (P) is an essential nutrient in natural aquatic environments. This element is usually found at low concentrations in the form of phosphate ions (PO43-). High phosphate levels can be attributed to man-made sources such as detergent, fertilizer, pesticide, additives, domestic and industrial sewage and improperly treated wastewater [Citation1]. This excess rate of (PO4−3) can damage the natural food chain by stimulating the growth of algae through the process of eutrophication and lowering the amount of dissolved oxygen (DO). This, in turn, can be lethal to aquatic organisms and may also negatively affect the quality of water reservoirs [Citation2–4]. Since 1970, the disposal of sewage into waters increased. Thus, because of P significant role in the phenomenon of eutrophication and distraction of the receiving waters, it was announced as an important pollutant. According to EPA, the total amount of P in a stream should not exceed 0.05 mg L−1 [Citation5,Citation6]. However, as PO4−3 ions are difficult to remove through the conventional wastewater treatment techniques, it is necessary to develop more efficient technologies for the treatment of wastewater that have PO4−3 ions [Citation7].
Such treatment technologies for the removal of phosphate from the sewage are broadly categorized as chemical, biological, electrochemical and physical methods. Physical treatments have also been developed to remove phosphate from aqueous solutions via methods such as electrodialysis, reverse osmosis, ion exchange and adsorption. Except for adsorption, most of these physical methods have proven to be either too expensive or inefficient [Citation8–11]. The advantages of using adsorption are its reversible nature, the possibility of regenerating the adsorbents used for multiple uses (by desorption), flexible in design and operation and economical recovery of phosphate [Citation12,Citation13]. To date, various adsorbents have been used to increase water and wastewater quality standards via removing mineral and organic pollutants [Citation14–19]. So, selecting a specific adsorbent, which plays a dominant role in the adsorption process, is the key to develop proper adsorption technology. Therefore, adsorption has been widely used in phosphorous removal during water and wastewater treatment [Citation11, Citation20,Citation21]. Metal oxides, like Fe3O4, ZrO2, and CuO have been extensively explored for phosphate removal because they exhibit strong ligand sorption of HPO42− and H2PO4− through the formation of inner-sphere complexes via Lewis acid-base interactions [Citation11]. Nanomaterials because of smaller size, larger surface area and fascinating quantum dependent properties are entirely different from bulk materials [Citation22]. Nowadays, however, with the proliferation of nanotechnology, nano-adsorbents are being increasingly used for the removal of pollutants. These nanomaterials provide a quick and highly efficient removal technique by enhancing the dynamic capacity of the adsorbent and thus leading to a considerable operation surface [Citation22,Citation23].
Nanomaterials have been suggested as the best alternatives for purifying water because of their unusual reactivity, surface volume ratio, and size-dependent optical, chemical and physical characteristics [Citation24,Citation25]. For this purpose, many such nanosystems are being widely used; i.e. nanoscale graphene, carbon nanotubes (CNTs), CeO2, CuO, ZrO2, ZnO, Fe2O3, CO3O4, WO3, TiO2, SnO2 and MgO NPs [Citation8, Citation24–34]. Among such metal oxides, tungsten oxide (WO3) nanoparticles have been thoroughly studied for their visible light activities in removing pollutants from water systems. However, their adsorption potentials for the removal of organic compounds have not been much explored yet [Citation35,Citation36], Meanwhile, these nanoparticles show certain properties that make them an efficient material for the treatment of industrial wastewater [Citation37]. Among these features, one can name having structural stability in harsh conditions, having a high surface area and showing great ability in mass transportation. In the last decade, due to its unique physical and chemical features, Tin oxide (SnO2) has also attracted much interest from scholars. For example, it has luminescence and photocatalytic activity [Citation38,Citation39] shows sensitivity to light and thermal energy, and has numerous intrinsic defects in its structure. These defects are due to low formation energy and strong attraction between tin sites and oxygen vacancies [Citation40]. Also, SnO2 enjoys a high exciton binding energy of 130 mV [Citation41] and reflects high chemical stability and superb variation in its resistivity in gaseous atmospheres. Accordingly, owing to such peculiar features, SnO2 has been both studied vigorously and used in waste treatment technologies. To the best of our knowledge, there is not any available data on the adsorption of P by SnO2 and WO3 NPs from aqueous solution by mentioned NPs. Hence, this study was conducted to examine the adsorption behavior of phosphate ions on WO3 and SnO2 nanoparticles under different operating conditions to determine the optimum conditions for P removal. For this purpose, the adsorption studies were performed to determine the optimum condition for removing phosphorus from solution by measuring parameters such as the adsorbent loading, pH, time, the initial concentration of phosphorus ions and the kinetics of adsorption equilibrium isotherms.
2. Materials and methods
2.1. Materials
WO3 and SnO2 NPs were purchased from Nabond Company (China). The other chemicals, which all were of analytical grade, were obtained from Merck, Germany.
2.2. Characterization of nanoparticles
The crystalline structure of NPs was characterized by the NPs, X-ray diffraction (XRD, XMD300, Unisantis). A scanning electron microscopy coupled with energy disperse X-ray (SEM-EDX, Tescan-LMU-XMU, and Mira3 Tescan-XMU) was utilized to determine their crystallinity, morphology, size, and surface elemental composition [Citation42].
To obtain the Fourier transform infrared (FT-IR) spectra, an RXI spectrophotometer was used. Also, to determine the surface areas and the average pore diameters of NPs nitrogen, Brunauer-Emmett-Teller (BET) analysis was performed using a Micromeritics Chemisorption Belsorpmini device.
2.3. Point of zero charge (pHpzc)
The pH drift method was applied to measure the pH of the point of zero charge (pHpzc), which refers to the level of pH above which the whole surface of a nanoparticle is negatively charged. To this end, 10 mL of the 0.01-mol L−1 NaCl solutions with the initial pH values between 2 and 12 were prepared to add HCl or NaOH and 0.025 g of the two adsorbents, namely SnO2 and WO3 NPs, to the solution. The obtained samples were then sonicated for 6 h and maintained for 42 h. After 48 h (25 ± 1 °C), the final pH of each solution was measured and plotted against the initial pH. Subsequently, the point where the curve crossed the line – i.e. where pH (final) was equal to pH (initial) – was considered as the pHpzc of the solution [Citation43].
2.4. Sorption procedure
A stock solution of P (1000 mgL−1) was prepared from KH2PO4 using distilled water. The needed working concentrations were prepared through dilution. Then, using 0.1 M NaOH and HCl solution, the solution pH was adjusted to the desired level. For the batch sorption experiments, the contact time and the temperature were set at 10–1440 min and 15–40 °C while the pH of the solution was increased from 3 to 7. The experiments were carried out using a nanoparticle dose of 0.5-4 g. L−1 of the solution with an initial P ions concentration of 0–60 mg L−1. To do the adsorption experiments, polyethylene tubes containing 25 mL of P ions solutions were used for both SnO2 and WO3. Then, having mixed the adsorbent with P ions solutions adjusted the pH; the tubes were transferred to temperature-controlled incubator shaker at a speed of 120 rpm. Afterward, the adsorbent was separated through filtration and the concentration of the residual P ions was measured spectrophotometrically using Specord 205 according to ascorbic acid at the absorbance of 880 nm [Citation44]. The adsorption capacity (mg g−1) was calculated using the following formula:
(1)
(1)
where C0 is the initial concentration of P ions (mg L−1), Ce refers to the concentration of P ions (mg L−1) in equilibrium, V stands for the volume of the solution (L), and W is the NPs mass (g).
Moreover, Equation (2) was used to calculate the percentage of phosphate removal:
(2)
(2)
where C and C0 are the amounts of the adsorbed (the difference between the concentration of phosphate prior and after the sorption) and the initial phosphate concentration, respectively.
2.5. Adsorption isotherms
Solutions containing different amounts of KH2PO4 were added to 1 g of NPs on the basis of batch analysis in single and competitive modes with chloride (Cl−), dichromate (Cr2O7−2-Cr), and nitrate (NO3−1-N). The pH of the solution was adjusted and kept at 3 using 0.1 M HCl or 0.1 M NaOH. Having capped the tubes, they were shaken with a speed of 120 rpm in a temperature-controlled orbital shaker at 15 °C to increase the reaction equilibrium. At the end of the 40 min equilibrium period, the obtained suspensions were filtered through a 0.22 filter and then analyzed to determine the amount of P that was adsorbed. The control samples that contained the other reagents except the adsorbent were also analyzed. Afterward, the data obtained about the P adsorption were fitted to the Langmuir and Freundlich equations.
2.6. Desorption procedure
Desorption experiments were carried out following the sorption experiments. After the removal of supernatant by ethanol, 0.01 M CaCl2 solution, with the pH similar to that of the sorption experiments, was added to the centrifuge tubes. These samples were shaken for 120 min and rested for 22 h until reaching an equilibrium state. Afterward, the suspensions were centrifuged at 5000 rpm for 5 min. Finally, the concentrations of P in the supernatant were measured [Citation45].
The percentage of desorption was estimated through Equation (3):
(3)
(3)
where qd (%) denotes the percentage of the P ions desorbed. D and R stand for the amount of P ions adsorbed and desorbed, respectively.
2.7. Theoretical basis
2.7.1. Isotherm models
The data obtained on the equilibrium sorption were analyzed by the use of Langmuir and Freundlich equations, which are described below.
2.7.1.1. Langmuir adsorption isotherm equation
The experimental data were found to fit the Langmuir isotherm model, at which equilibrium is attained once the monolayer is completely saturated. This equation is represented in a linear equation as follows:
(4)
(4)
where
shows the maximum amount of phosphate ions per unit weight of SnO2 and WO3 nanoparticles needed to form a complete monolayer on the surface mg g−1; KL is a constant related to the affinity of the binding sites with the phosphate ions (L mg−1); and
represents a practical limiting adsorption capacity corresponding to the surface of the sorbent when it is fully occupied by the sorbate ions. This is of particular significance when assessing the adsorption performance as it provides for the indirect comparison between various sorbents especially in cases where the sorbent does not reach its full saturation [Citation46,Citation47]
2.7.1.2. Freundlich adsorption isotherm equation
The Freundlich isotherm is an empirical model that shows heterogeneous adsorption energies on the adsorbent surface [Citation48]. The linear form of the Freundlich equation can be represented as follows:
(5)
(5)
where
and n are Freundlich constants indicating the adsorption capacity (mg g−1) and the adsorption intensity, respectively [Citation48].
2.7.2. Kinetic models
Studying the adsorption kinetics is of great use in understanding the mechanisms involved and in designing the future facilities for large-scale adsorption. To examine such adsorption mechanisms as mass transfer and chemical reaction, an appropriate kinetic model is required to analyze and interpret the data. The most widely used models in this regard are the pseudo-first-order and pseudo-second-order models [Citation49].
2.7.2.1. Pseudo-first-order equation
This equation is generally expressed in a linear form as follows:
(6)
(6)
where
and
represent the rates of the phosphates sorbed at equilibrium and at time t (mg g−1), respectively, and
is the rate constant of the pseudo-order sorption (min−1) [Citation50].
2.7.2.2. Pseudo-second-order equation
Once the amount of sorption follows a second-order mechanism, the pseudo-second-order chemisorption kinetic rate equation is employed. After integration, this equation can be expressed as follows:
(7)
(7)
where
is the rate constant of the pseudo-second-order sorption (g mg−1 min−1) and
represents the rate of phosphates sorbed at equilibrium (mg g−1) [Citation51].
2.7.2.3. Adsorption thermodynamics
To evaluate the thermodynamic behavior of phosphate adsorption of SnO2 and WO3 nanoparticles, thermodynamic parameters such as Gibbs free energy change (ΔG0), enthalpy change (ΔH0), and entropy change (ΔS0) are used. These parameters can be calculated through the following equations [Citation52]:
(9)
(9)
(9)
(9)
(10)
(10)
where kd represents the equilibrium constant at temperature T (K), kd is the ratio of the phosphate adsorbed at equilibrium
to the corresponding equilibrium phosphate concentration
and R is the ideal gas constant (8.314 J mol−1 K−1).
2.8. Statistical analysis
The adsorption experiments were performed in triplicate and the data obtained were reported as mean. The required calculations including determination coefficients (R2) for isotherms and kinetic models were performed using Microsoft Excel statistical functions.
3. Results and discussion
3.1. Adsorbent characterization
XRD, SEM, and FTIR were used to characterize the nanoparticles. illustrates the XRD pattern of SnO2 and WO3. This analysis was done to examine the nature and crystallinity of particles and to verify the nanoparticle size. Different patterns of the samples were observed at 2θ = 26.23°, 33.57°, 37.58°, and 51.58, which matched with JCPDS standard card no. 41-1445 for SnO2 and 2θ = 22.85°, 23.39°, 23.37°, 33.85°, and 49.57°, which matched with JCPDS standard card no. 75- 2072 for WO3. The same diffraction pattern was observed by other researchers [Citation53,Citation54].
Figure 1. Powder X-ray diffraction of SnO2 (a) and WO3 (b) nano adsorbent.
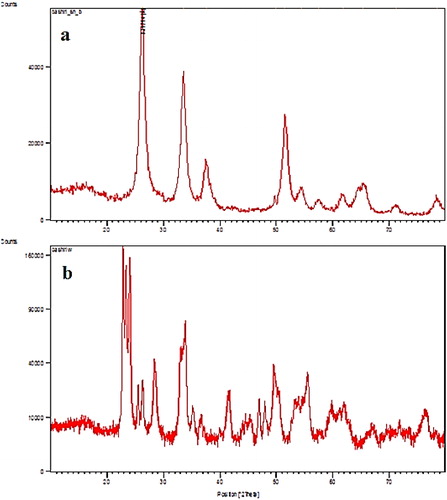
The average size of particles was calculated through the Debye–Scherrer equation [Citation55,Citation56]. The calculation revealed a crystallite size of 18.4 for SnO2 and 56.9 nm for WO3 NPS. Moreover, according to the BET measurements, the specific surface area for SnO2 was 56.7 while that of WO3 NPS was 0.55 m2 g−1.
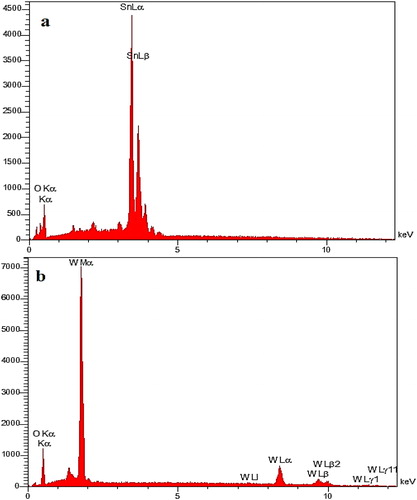
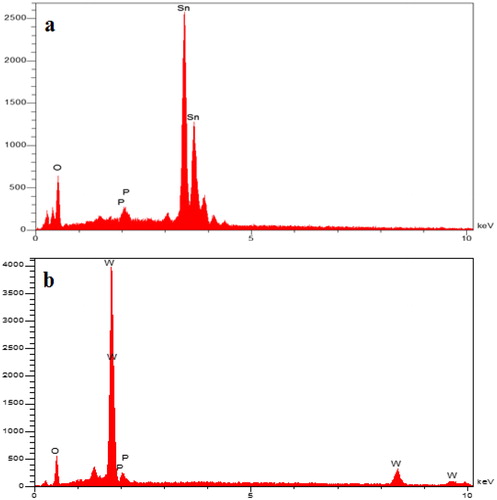
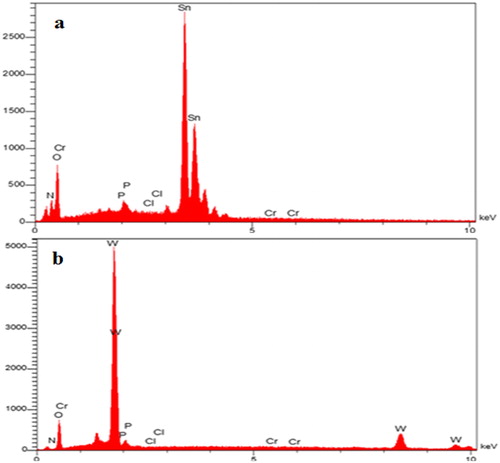
depicts the EDX spectrum for SnO2 and WO3 NPs. As the EDX measurements indicate, the SnO2 consists of 73.7% Sn and 26.3% O while WO3 consists of 85% w and 15% O. The absence of other elements in the EDX spectrum indicated that no impurity existed in the nanoparticles.
Figure 2. Energy Dispersive X-Ray (EDX) spectrum of SnO2 (a) and WO3 (b) nano adsorbent.
The FTIR spectra for SnO2 and WO3 NPS are shown in . illustrates the FTIR spectrum for SnO2 and shows that of WO3. As indicated, the adsorption of SnO2 appears in the range of 400–650 cm−1 [Citation57], while it appeared at 630 cm−1 in this study. Besides, the presence of adsorption bands at 3420 cm−1 and 1651 cm−1 can be attributed to the presence of O–H groups and water molecules [Citation58]. Furthermore, the peak appeared at 2358 cm−1 can be due to the presence of C–O and C = O groups, which are related to the atmospheric impurities [Citation59,Citation60].
Figure 3. FTIR spectrum of SnO2 (a) and WO3 (b) nano adsorbent.
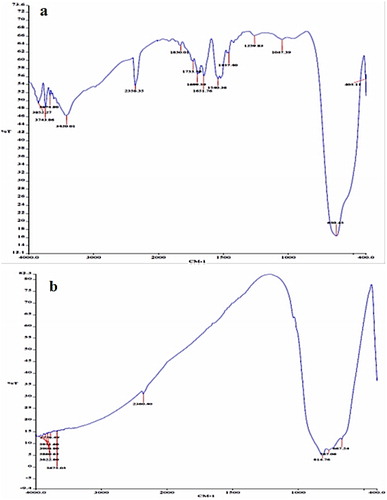
As Usharani and Rajendran (2017) state, the adsorption of W–O appears in the range of 500–900 [Citation61]. In the present study, the W-O adsorption peak was observed in 814
(). Here, the adsorption at 3675
can be attributed to O-H group in the WO3 nanoparticles.
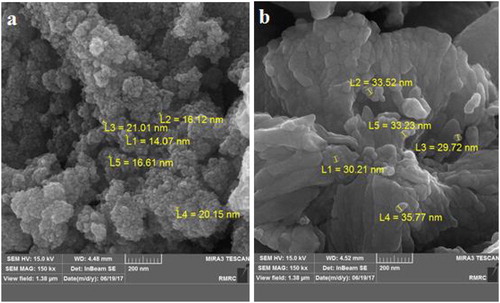
SEM analysis was applied to determine the surface morphologies of SnO2 and WO3 NPS. The SEM photographs for SnO2 and WO3 nanoparticles are presents in . As the SEM images indicated, the SnO2 particles are almost spherical and homogeneous and have an average size of 17.6 nm. In comparison, the surface of the WO3 particle is heterogeneous and has an average size of 32.5 nm. The average size of both particles appeared to be less than 100 nm.
Figure 4. SEM image of SnO2 (a) and WO3 (b) nano adsorbent.
3.2. Optimization of process variables
3.2.1. Effect of PH
presents the rate of removal of phosphate from aqueous solutions onto SnO2 and WO3 nanoparticles based on pH variations (3–7). As can be inferred from the obtained results, increasing the pH value up to 7 results in a decrease in the ability to remove phosphate ions. The maximum removal rate for SnO2 and WO3 NPs was observed at a pH level of 3 with 41% and 43.2%, respectively. The maximum sorption rate for SnO2 was 20.5 and WO3 NPS was 21.6 (mg g−1). As the maximum rate of adsorption occurred at pH = 3, this value was selected for all other adsorption experiments in this study. The increased removal rate of phosphorus at lower pH levels might be attributed to the production of more positive active sites on the surface of the nano-adsorbent, which favors the sorption for creating electrostatic interaction among P ions and the sorbent surface [Citation62]. The removal of P ions may be explained by the electrostatic force and the interaction of ion exchange [Citation63].
Figure 5. Effect of initial pH on phosphate removal (initial concentration of phosphate, 50 mg L−1;absorbent dosage, 0.025 g L−1; contact time, 24 h; Temperature, 25 °C).
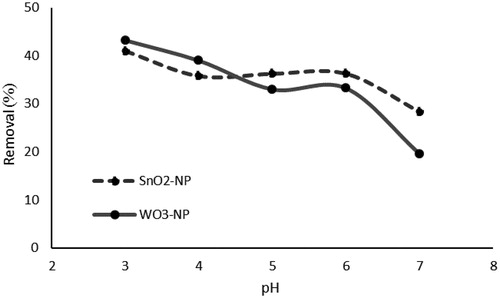
At a low pH level, the phosphate anions can appear in the solution as or
as follows:
Otherwise, as the pH of solution increases the surface charge will be more negatively. This can be explained by the pHpzc of the nanoparticles. The pHpzc of SnO2 and WO3 was about 3.8 and 4.1, respectively. With an increase in the pH because of the deprotonation of surface hydroxyls, the surface charge of SnO2 and WO3 changed from positive to negative based on the pHpzc. Other studies have reported reductions in adsorption capacities proportionate to the increase in the pH of a solution of for for other adsorbents such as aluminum hydroxide and Iron (III) oxide in the phosphate adsorption process [Citation64].
3.2.2. Adsorption dosage
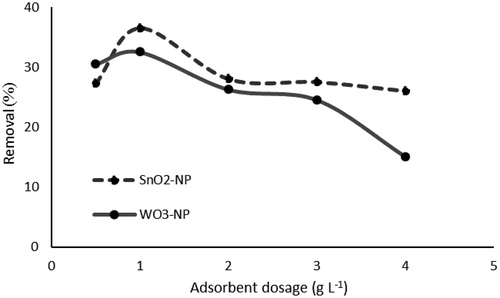
To investigate the effect of the dosage of SnO2 and WO3 nanoparticles on the adsorption of P, different doses of the adsorbent (0.5–4 g. L−1) were used. shows the results of these experiments. As can be seen, the greatest adsorption of P for SnO2 was 36.5% and for WO3 NPS was 32.5%, when using a nano-adsorbent dosage of 1 g L−1 of 50 mg L−1 P solution. One possible explanation for the reduction in the adsorption capacity of SnO2 and WO3 could be the splitting effect of the concentration gradient between the adsorbate and adsorbent at the same time. As a result, the concentration of nanoparticles increased and caused a decrease in the rate of P adsorbed on SnO2 and WO3 NPS [Citation65]. Another explanation is the decrease in the effective surface area resulting in the conglomeration of exchanger particles. Therefore, 1 g L−1 was considered as an optimum dose. Accordingly, the specific surface area of the particles reduced and caused a decrease in ion adsorption efficiency [Citation66].
Figure 6. Effect of adsorbent dosage on phosphate removal (initial concentration of phosphate, 50 mg L−1; contact time, 24 h; Temperature, 25 °C).
3.2.3. Effect of contact time
illustrates how contact time might affect the phosphate adsorption using both adsorbents. As reflected in the figure, adsorption is a time-dependent process. Over time, the adsorption rate of phosphate ions by the two sorbents and the uptake appeared to be fast in the first 40 min of the contact time. At 40 min, the maximum adsorption rate observed for SnO2 and WO3 NPS was 47.2% and 45.2%, respectively.
Figure 7. Effect of contact time on phosphate removal (initial concentration of phosphate, 50 mg L−1; absorbent dosage, 1g L−1; Temperature, 25 °C).
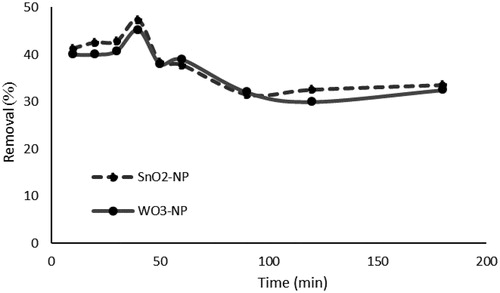
It seems that the available adsorption sites influence the rate of P adsorption. In the process of solute transfer to the solid, the solute is first diffused through the fluid around the adsorbent and then is diffused to the internal adsorption sites through the pores. Since the concentration gradient between the solution and the available pore sites is large at the initial stages of P adsorption, the adsorption rate is rapid. In comparison, in the later stages, perhaps because of the slow pore diffusion of the solute ion the bulk of the adsorbent, this rate decline [Citation67,Citation68] and remains constant almost after 90 min.
3.2.4. Sorption kinetic
The pseudo-first-order and pseudo-second-order kinetic models were used to study the removal rate of P ions using SnO2 and WO3. presents the values of kinetic parameters. As shown is in the table, the pseudo-second-order kinetic model appeared to be well fitted to the adsorption date for P ions. Compared with the pseudo-first-order model, the R2 values for both nanoparticles were higher in the pseudo-second-order kinetic model, where they were found to be higher than 0.95 for both cases. The fit of P sorption kinetics to the pseudo-second-order model suggests that the rate-limiting step in sorption of P ions onto SnO2 and WO3 NPS is probably chemical sorption (chemisorption) involving valence forces through the sharing or exchange of electrons between the NPS surface and P ions [Citation69,Citation70]. This model assumes that two reactions are occurring; the first one is fast and reaches equilibrium quickly and the second is a slower reaction that can continue for long periods. The reactions can take place either in series or in parallel [Citation71]. The pseudo-second-order kinetic model also indicates that chemical adsorption is the rate-determining stage [Citation72]. This means that the rate-limiting step in the process is the chemical adsorption between the adsorbate and the active sites of the adsorbent. According to the experiment results, the adsorption mainly occurred during the first hour of the process.
Table 1. Kinetic parameters for the adsorption of phosphate onto nano adsorbent.
3.2.5. Adsorption isotherm
To perform the batch adsorption experiments, different initial concentrations of P (0, 10, 20, 30, 40, 50, and 60 mg L−1) were used while the other experimental parameters were kept constant at optimum conditions. The results indicated that the initial concentration of P would highly affect the removal of P by SnO2 and WO3 NPS. In other words, the higher the initial P concentration was, the more the P uptake would be; suggesting the high affinity of the binding sites for P ions.
This may be due to the fact that at a fixed adsorbent dose, the number of active adsorption sites to accommodate the adsorbate ion remains unchanged while with higher adsorbate concentrations, the adsorbate ions to be accommodated increase. Therefore, when the initial concentrations increase, the corresponding cumulative removal (mg g−1) will increase as well. This behavior can be attributed to the increased contact between P ions and the adsorbent, which normally occurs at higher adsorbate concentrations [Citation73,Citation74]. At a low rate of added P (10 mg L−1), the amount of P adsorbed on SnO2 and WO3 NPs was 6.45 and 6.1 mg g−1, respectively, while at a high P concentration (60 mg L−1), the adsorption onto SnO2 and WO3 NPs were 21.5 and 19.0 mg g−1, respectively. Accordingly, it can be argued that a greater proportion of adsorbents are sorbed at high concentrations of P. As can be seen, WO3 and SnO2 NPs in the present work are superior to many other adsorbents reported in the literature ().
Table 2. Maximum adsorption capacities of phosphorus onto various adsorbents.
To study the nature of the interaction that takes place between an adsorbate and an adsorbent, isotherms can be used. A noteworthy point here is that describing the equilibrium data using isotherms results in a minimum deviation between the model and experimental data. Thus, in the present study, Langmuir and the Freundlich isotherm models were used. It appeared that the Freundlich isotherm provided a better fit to the data (). summarizes the Freundlich isotherm parameters. The Freundlich distribution coefficient (Kf) and constant (n) represent the amount of adsorption and the energy of adsorption, respectively. The 1/n values less than 1 may imply that in case the equilibrium data well fit the Freundlich model, the active sites should be energetically heterogeneous.
Figure 8. Freundlich isotherm model of phosphate adsorption (pH, 3; adsorbent dosage, 1 g L−1; contact time, 40 min; Temperature, 15 °C).
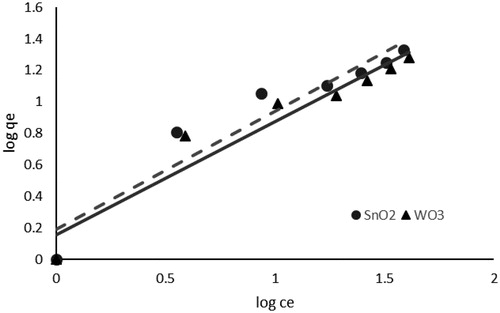
Table 3. Freundlich isotherm constants for the adsorption of phosphate onto nano adsorbent.
The SEM images and EDX spectrum ( and ) also support the observation that phosphate precipitations are formed onto nano-adsorbent in the solution (60 mg L−1 concentration of phosphate). However, SnO2 and WO3 NPs average sizes increased from 17.6 to 22.4 and 32.5 to 81.4 nm, respectively, indicating the adsorption of P on the surface of the particle. This adsorption of P on SnO2 and WO3 NPs surface was further confirmed by EDX measurements; because after adsorption, SnO2 and WO3 NPs contained 1.6 and 0.5% P, respectively.
Figure 9. SEM image after adsorption isotherm of SnO2 (a) and WO3 (b) nano adsorbent (initial concentration of phosphate, 60 mg L−1).
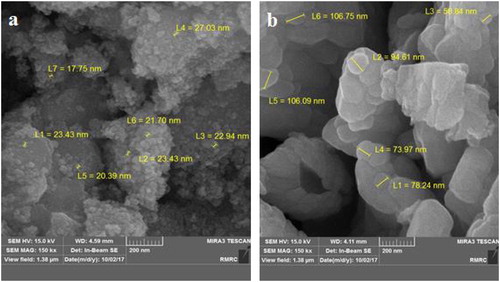
Figure 10. Energy Dispersive X-Ray (EDX) spectrum after adsorption isotherm of SnO2 (a) and WO3 (b) nano adsorbent (initial concentration of phosphate, 60 mg L−1).
From economic and environmental perspectives, the adsorption will be successful if the adsorbent can be repeatedly used to desorb the target contaminant. In other words, for the adsorption process to be efficient and economical, it is necessary that the nanoparticles used in sorption be reused repeatedly.
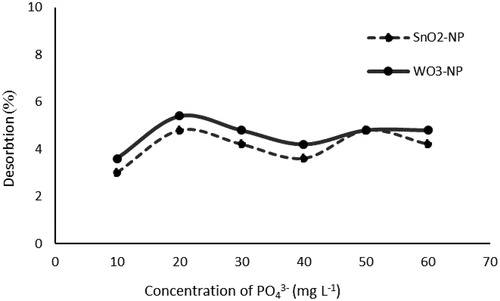
illustrates the desorption of phosphorus from nanoparticles using l0 mM CaCl2. As the results indicate, the rate of desorption for the nano-adsorbent was less than 5%, which could imply that there was a very strong bonding between the nano adsorbent active sites and the adsorbed P. Therefore, it seems that stronger extracants at high pH levels are needed to reuse such nanoparticles [Citation89].
Figure 11. Desorption of phosphate from nano adsorbent using CaCl2 0.01 M.
3.2.6. Effect of coexisting anions
In highly contaminated water, there are varieties of anions that normally compete with P for the adsorption sites. To better understand their mechanism of action in adsorbing phosphate, three such coexisting anions namely, Cl−, Cr2O72−, and NO3- were chosen. and show the results of these analyses for the possible interferences of such coexisting anions in single and multiple modes. As shown in these figures, the initial concentration of P and those of the coexisting anions were between 0 and 60 mg L−1. Then, the adsorption of P by SnO2 and WO3 was examined at the presence of the three coexisting anions under optimum conditions. Results revealed that the removal of phosphate in all three cases decreased significantly.
Figure 12. Effect of coexisting anions on phosphate adsorption by SnO2 nano adsorbent.
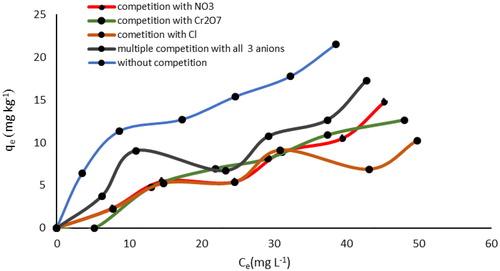
Figure 13. Effect of coexisting anions on phosphate adsorption by WO3 nano adsorbent.
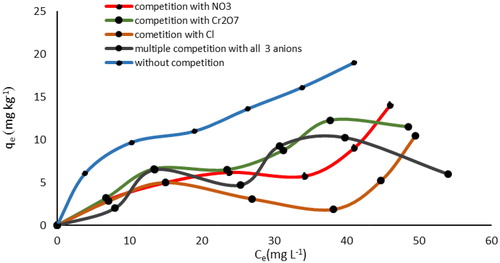
As indicated, without these competitive anions in the solution, the removal rate of P for SnO2 and WO3 was 64.5 and 57.5%, respectively. In comparison, in the presence of Cl−, NO3−, and Cr2O72−, the rates decreased to (26.2 and 28.5%), (27.2 and 30%), and (48 and 33%), respectively. Additionally, when the three competitive anions were simultaneously added to the solution, phosphorus uptake decreased to 45.2% for SnO2 and 32.5% for WO3. This could indicate that these anions were competing for the sorption sites. The SEM images and EDX spectrum () also support the phosphorus concentration of nano-adsorbent in phosphorus concentration of 60 mg L−1 when competitive anions were present in single (Cl-) and multiple modes.
Figure 14. SEM image of SnO2 (a) and WO3 (b) nano adsorbent with coexisting of Cl− anion.
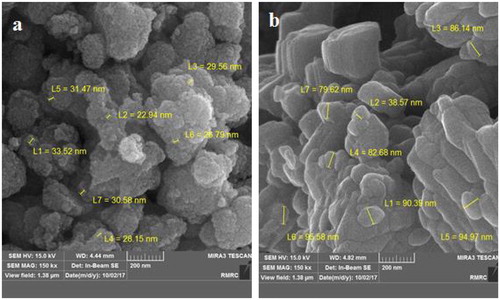
Figure 15. SEM image of SnO2 (a) and WO3 (b) nano adsorbent with coexisting Cl−, Cr2O7– and NO3− anions.
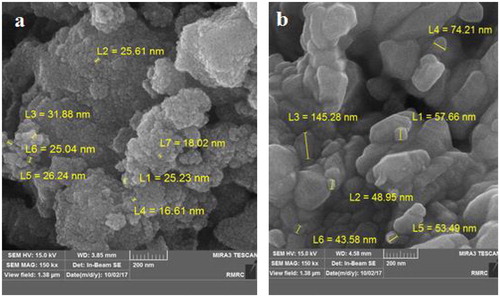
Figure 16. EDX spectrum of SnO2 (a) and WO3 (b) nano adsorbent with coexisting of Cl− anion.
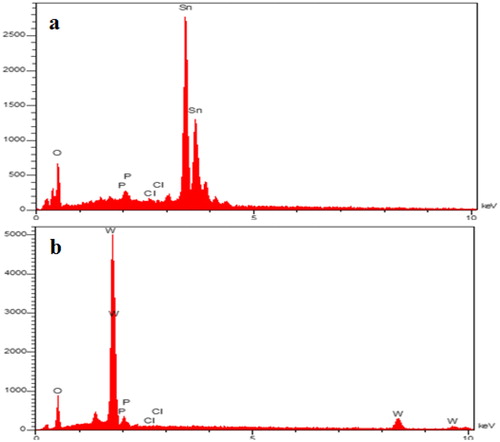
Figure 17. EDX spectrum of SnO2 (a) and WO3 (b) nano adsorbent with coexisting Cl−, Cr2O7− and NO3- anions.
The XRD analyses reflected little morphological changes in SnO2 and WO3 NPs in the single-mode. Although the particle size of tin oxide slightly increased from 22.4 nm in the phosphorus isotherm to 29.0 nm, this size for WO3 remained unchanged (). The larger particles can be as a result of adsorption of phosphorus along with chloride on particle surfaces.
The results of XRD images in multiple modes indicated that the morphology of the particles might not be affected by the competitive anions. The average size of the tin oxide particle slightly increased from 22.4 nm in the phosphorus isotherm to 24.1 nm. In comparison, the size of the WO3 particle in the phosphorus isotherm decreased from 81.4 nm to 70.5 nm ().
Besides, as represented by EDX images in and , SnO2 and WO3 NPs were not so effective in adsorbing chloride. The results of EDX measurements showed that after adsorption, SnO2 and WO3 NPs contained 1.6 and 1.1% P and 0.4 and 0.1% Cl, respectively.
3.2.7. Effect of temperature and thermodynamics analysis
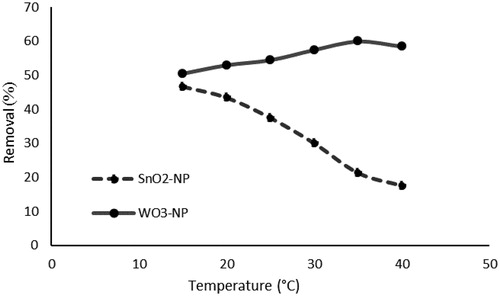
shows the effects of temperature on the removal of phosphorus by SnO2 and WO3 NPS. As can be seen, when the temperature exceeds 15 °C, the adsorption capacity of SnO2 NPs decreases. It also indicates that the adsorption of phosphorus on to SnO2 NPs is an exothermic process [Citation90].
Figure 18. Effect of temperature on phosphorus removal (initial concentration of phosphate, 50 mg L−11; absorbent dosage, 1g L−1; pH, 3; time, 40 min).
In evaluating the thermodynamic feasibility and the nature of the adsorption process, such thermodynamic parameters as ΔG0, ΔH0, and ΔS0 are all important. lists all such parameters.
Table 4. Thermodynamic parameters for adsorption of phosphate onto nano adsorbent.
Based on the results of thermodynamic equations, it was concluded that the adsorption of phosphorus onto SnO2 NPs was spontaneous (ΔG < 0). However, as temperature increased the ΔG decreased, indicating an increased adsorption capacity at lower temperatures. The negative values of ΔG0 confirm the feasibility of the adsorption process and the spontaneous nature of the adsorption. The decrease in the negative value of ΔG0 with an increase in temperature suggests that the adsorption process is more favorable at higher temperatures [Citation91]. A negative value of ΔH0 indicates that the adsorption process is exothermic. Finally, the positive value of ΔS0 reflects the affinity of the adsorbent for the solute molecules and also suggests some structural changes in adsorbate and adsorbent [Citation92].
The change in free energy for physical adsorption is generally in the range of −20 to 0 KJ mol−1 and is lower than the chemisorption process, which normally ranges from −80 to −400 KJ mol−1. In the adsorption of phosphorous, the changes in free energy of adsorption for the NPs were calculated out to be less than 0 K J mol−1, which specifies the occurrence of the physico-sorption process. The values of the free energy in the lower range also suggest the feasibility of the adsorption process.
Meanwhile, the negative value of ΔH and the positive value of ΔS indicate that the reaction was endothermic and the entropy increased due to the absence of the adsorbate on an active surface of the adsorbent site [Citation90, Citation93].
The results of the analyses on the effect of temperature on the adsorption of phosphorus on to WO3 NPS indicated that the maximum removal would occur at 35 °C. This increased adsorption power with temperature rise showed that the reaction was endothermic.
The negative values of ΔG and the positive values of ΔH indicate that the adsorption of phosphorus onto WO3 NPS is spontaneous and endothermic. An increase in the temperature resulted in a corresponding increase in ΔG. At the same time, temperature rise enhanced endothermic adsorption of phosphorus onto the WO3 NPS.
The negative values of ΔS demonstrate that during the adsorption of phosphate, the randomness at the solid-solution interface decreased [Citation94]. This increased adsorption capacity of WO3 NPS at higher temperatures may be attributed to the activation of the adsorbent surface [Citation78].
4. Conclusion
The present study was conducted to examine whether SnO2 and WO3 NPS can be used as efficient adsorbents for removing phosphorus ions from synthetic wastewater. SEM analyses indicated that after chemical treatments, phosphorus ions were adsorbed onto these nano adsorbents. Moreover, pseudo-first-order and pseudo-second-order equations were used to examine the adsorption kinetics of P on to SnO2 and WO3 NPS. The results indicated that the pseudo-second-order equations could better fit the sorption of P indicating that the sorption was controlled by a chemisorption process. Besides, in the concentration ranges studied, the sorption equilibrium data obeyed the Freundlich models.
The sorption of P ions on WO3 NPS was temperature-dependent, endothermic, and spontaneous, while the P sorption on SnO2 NPS appeared to the exothermic and spontaneous.
Acknowledgment
This article is a part of a M.Sc. thesis prepared in Malayer University. We would like to thank the Vice-Chancellor for Education and Graduate Studies of Malayer University for approving this study.
References
- Chen N, Feng C, Yang J, et al. Preparation and characterization of ferric-impregnated granular ceramics (FGCs) for phosphorus removal from aqueous solution. Clean Tech Environ Policy. 2013;15(2):375–382.
- Babarinde A, Onyiaocha GO. Equilibrium sorption of divalent metal ions onto groundnut (Arachis hypogaea) shell: kinetics, isotherm and thermodynamics. Chem Int. 2016;2(3):37–46.
- De-Bashan LE, Bashan Y. Recent advances in removing phosphorus from wastewater and its future use as fertilizer (1997-2003).Water Res. 2004;38(19):4222–4246.
- Babarinde A, Ogundipe K, Sangosanya KT, et al. Comparative study on the biosorption of Pb (II), Cd (II) and Zn (II) using Lemon grass (Cymbopogon citratus): kinetics, isotherms and thermodynamics. Chem Int. 2016;2(2):89–102.
- Lakshmanan R, Okoli C, Boutonnet M, et al. Microemulsion prepared magnetic nanoparticles for phosphate removal: time efficient studies. J Environ Chem Eng. 2014;2(1):185–189.
- Khodadadi M, Hosseinnejad A, Rafati L, et al. Removal of phosphate from aqueous solutions by iron nano-magnetic particle coated with powder activated carbon. J Health Sci Technol. 2017;1(1):17–22.
- Golder A, Samanta A, Ray S. Removal of phosphate from aqueous solutions using calcined metal hydroxides sludge waste generated from electrocoagulation. Sep Purif Technol. 2006;52(1):102–109.
- Mahdavi S, Akhzari D. The removal of phosphate from aqueous solutions using two nano-structures: copper oxide and carbon tubes. Clean Techn Environ Policy. 2016;18(3):817–827.
- Sedlak RI. Phosphorus and nitrogen removal from municipal wastewater: principles and practice. Boca Raton,FL: CRC press; 1991.
- Vasudevan S, Oturan MA. Electrochemistry: as cause and cure in water pollution—an overview. Environ Chem Lett. 2014;12(1):97–108.
- Chen L, Zhao X, Pan B, et al. Preferable removal of phosphate from water using hydrous zirconium oxide-based nanocomposite of high stability. J Hazard Mater. 2015;284:35–42.
- Rivera Corredor C, Garcia G, Dobrosz-Gómez I. Adsorptive removal of Cr (VI) from aqueous solution on hydrous cerium-zirconium oxide. Part I: process optimization by response surface methodology. Adsorpt Sci Technol. 2014;32(2-3):209–226.
- Gupta V, Carrott P, Singh R, et al. Cellulose: a review as natural, modified and activated carbon adsorbent. Bioresource Technol. 2016;216:1066–1076.
- Saravanan R, Gupta V, Mosquera E, et al. Preparation and characterization of V2O5/ZnO nanocomposite system for photocatalytic application. J Mol Liq. 2014;198:409–412.
- Gupta VK, Jain C, Ali I, et al. Removal of lindane and malathion from wastewater using bagasse fly ash—a sugar industry waste. Water Res. 2002;36(10):2483–2490.
- Asfaram A, Ghaedi M, Agarwal S, et al. Removal of basic dye Auramine-O by ZnS: Cu nanoparticles loaded on activated carbon: optimization of parameters using response surface methodology with central composite design. RSC Adv. 2015;5(24):18438–18450.
- Gupta VK, Saleh TA. Sorption of pollutants by porous carbon, carbon nanotubes and fullerene- an overview. Environ Sci Pollut Res Int. 2013;20(5):2828–2843.
- Saleh TA, Gupta VK. Functionalization of tungsten oxide into MWCNT and its application for sunlight-induced degradation of rhodamine B. J Colloid Interface Sci. 2011;362(2):337–344.
- Ahmaruzzaman M, Gupta VK. Rice husk and its ash as low-cost adsorbents in water and wastewater treatment. Ind Eng Chem Res. 2011;50(24):13589–13613.
- Chiban M, Benhima H, Saadi B, Nounah A, Sinan F, editors. Isotherms and kinetic study of dihydrogen and hydrogen phosphate ions (H $_ {2} $PO $_ {4}^-$and HPO $_ {4}^{2-} $) adsorption onto crushed plant matter of the semi-arid zones of Morocco: Asphodelus microcarpus, Asparagus albus and Senecio anthophorbium. J Phys IV France). 2005;123:393–399.
- Biswas BK, Inoue K, Ghimire KN, et al. Removal and recovery of phosphorus from water by means of adsorption onto orange waste gel loaded with zirconium. Bioresour Technol. 2008;99(18):8685–8690.
- Saravanan R, Sacari E, Gracia F, et al. Conducting PANI stimulated ZnO system for visible light photocatalytic degradation of coloured dyes. J Mol Liq. 2016;221:1029–1033.
- Adeli M, Yamini Y, Faraji M. Removal of copper, nickel and zinc by sodium dodecyl sulphate coated magnetite nanoparticles from water and wastewater samples. Arab J Chem. 2017;10:S514–S21.
- Huang Y, Yang J-K, Keller AA. Removal of arsenic and phosphate from aqueous solution by metal (hydr-) oxide coated sand. ACS Sustainable Chem Eng. 2014;2(5):1128–1138.
- Recillas S, García A, González E, et al. Preliminary study of phosphate adsorption onto cerium oxide nanoparticles for use in water purification; nanoparticles synthesis and characterization. Water Sci Technol. 2012;66(3):503–509.
- Auffan M, Rose J, Bottero J-Y, Lowry GV, et al. Towards a definition of inorganic nanoparticles from an environmental, health and safety perspective. Nat Nanotechnol. 2009;4(10):634–641.
- Haes AJ, Van Duyne RP. A nanoscale optical biosensor: sensitivity and selectivity of an approach based on the localized surface plasmon resonance spectroscopy of triangular silver nanoparticles. J Am Chem Soc. 2002;124(35):10596–10604.
- Lee LZ, Zaini MAA, Tang SH. Porous nanomaterials for heavy metal removal. In Handbook of ecomaterials. Cham: Springer; 2019. p. 469–494.
- Mahdavi S, Amini N, Merrikhpour H, et al. Characterization of bare and modified nano-zirconium oxide (ZrO 2) and their applications as adsorbents for the removal of bivalent heavy metals. Korean J Chem Eng. 2017;34(1):234–244.
- Mahdavi S, Molodi P, Zarabi M. Utilization of bare MgO, CeO2, and ZnO nanoparticles for nitrate removal from aqueous solution. Environ Prog Sustainable Energy. 2018;37(6):1908–1917.
- Pradeep T. Noble metal nanoparticles for water purification: a critical review. Thin Solid Films. 2009;517(24):6441–6478.
- Shukla R, Madras G. Facile synthesis of aluminium cobalt oxide for dye adsorption. J Environ Chem Eng. 2014;2(4):2259–2268.
- Yuan H, Ma W, Chen C, et al. Shape and SPR evolution of thorny gold nanoparticles promoted by silver ions. Chem Mater. 2007;19(7):1592–1600.
- Zhang L, Yi M. Electrochemical nitrite biosensor based on the immobilization of hemoglobin on an electrode modified by multiwall carbon nanotubes and positively charged gold nanoparticle. Bioprocess Biosyst Eng. 2009;32(4):485–492.
- Singh SA, Madras G. Photocatalytic degradation with combustion synthesized WO3 and WO3TiO2 mixed oxides under UV and visible light. Sep Purif Technol. 2013;105:79–89.
- Wang F, Li C, Jimmy CY. Hexagonal tungsten trioxide nanorods as a rapid adsorbent for methylene blue. Sep Purif Technol. 2012;91:103–107.
- Morales W, Cason M, Aina O, et al. Combustion synthesis and characterization of nanocrystalline WO3. J Am Chem Soc. 2008;130(20):6318–6319.
- Tong H, Ouyang S, Bi Y, et al. Nano-photocatalytic materials: possibilities and challenges. Adv Mater Weinheim. 2012;24(2):229–251.
- Zhang L, Li J, Chen Z, et al. Preparation of Fenton reagent with H2O2 generated by solar light-illuminated nano-Cu2O/MWNTs composites. Appl Catal, A. 2006;299:292–297.
- Xu H, Qu Z, Zhao S, et al. Enhancement of heterogeneous oxidation and adsorption of Hg0 in a wide temperature window using SnO2 supported LaMnO3 perovskite oxide. Chem Eng J. 2016;292:123–129.
- Liu H, Hu C, Wang ZL. Composite-hydroxide-mediated approach for the synthesis of nanostructures of complex functional-oxides. Nano Lett. 2006;6(7):1535–1540.
- Saravanan R, Gupta V, Prakash T, et al. Synthesis, characterization and photocatalytic activity of novel Hg doped ZnO nanorods prepared by thermal decomposition method. J Mol Liq. 2013;178:88–93.
- Gupta VK, Ali I, Saleh TA, et al. Chromium removal from water by activated carbon developed from waste rubber tires. Environ Sci Pollut Res Int. 2013;20(3):1261–1268.
- Sparks DL, Page A, Helmke P, et al. Methods of soil analysis, part 3: Chemical methods. United States: John Wiley & Sons; 2020.
- Merrikhpour H, Jalali M. Comparative and competitive adsorption of cadmium, copper, nickel, and lead ions by Iranian natural zeolite. Clean Tech Environ Policy. 2013;15(2):303–316.
- Gupta VK, Jain R, Nayak A, et al. Removal of the hazardous dye—tartrazine by photodegradation on titanium dioxide surface. Mater Sci Eng C. 2011;31(5):1062–1067.
- Bayramoglu G, Gursel I, Tunali Y, et al. Biosorption of phenol and 2-chlorophenol by Funalia trogii pellets. Bioresour Technol. 2009;100(10):2685–2691.
- Mittal A, Mittal J, Malviya A, et al. Removal and recovery of Chrysoidine Y from aqueous solutions by waste materials. J Colloid Interface Sci. 2010;344(2):497–507.
- Örnek A, Özacar M, Şengil İA. Adsorption of lead onto formaldehyde or sulphuric acid treated acorn waste: equilibrium and kinetic studies. Biochem Eng J. 2007;37(2):192–200.
- Simonin J-P. On the comparison of pseudo-first order and pseudo-second order rate laws in the modeling of adsorption kinetics. Chem Eng J. 2016;300:254–263.
- YH, Mckay G, Ys H, Mckay G. Pseudo-second order model for sorption processes. Process Biochem. 1999;34(5):451–465.
- Mohammadi N, Khani H, Gupta VK, et al. Adsorption process of methyl orange dye onto mesoporous carbon material-kinetic and thermodynamic studies. J Colloid Interface Sci. 2011;362(2):457–462.
- Chen W, Ghosh D, Chen S. Large-scale electrochemical synthesis of SnO 2 nanoparticles. J Mater Sci. 2008;43(15):5291–5299.
- Gupta R, Sheikh HN, Kalsotra BL, et al. Synthesis and characterization of isothiocyanato complexes of dioxotungsten (VI) with mannich base ligands: Precursors for the preparation of pure phase nanosized tungsten (VI) trioxide: dioxotungsten (VI) isothiocyanato complexes with mannich bases: precursors for WO3. J Saudi Chem Soc. 2016;20(3):291–302.
- Pullar R, Taylor M, Bhattacharya A. The manufacture of yttrium aluminium garnet. J Eur Ceram Soc. 1998;18(12):1759–1764.
- Moore P. Elements of X-Ray crystallography. JG. 1968;76(5):611–612.
- Zhang J, Gao L. Synthesis and characterization of nanocrystalline tin oxide by sol–gel method. J Solid State Chem. 2004;177(4-5):1425–1430.
- Saravanan R, Karthikeyan S, Gupta V, et al. Enhanced photocatalytic activity of ZnO/CuO nanocomposite for the degradation of textile dye on visible light illumination. Mater Sci Eng C Mater Biol Appl. 2013;33(1):91–98.
- Kennedy JF, Phillips GO, Williams PA. Recent advances in environmentally compatible polymers: Cellucon’99 Proceedings: Elsevier; 2001.
- Kannan S. FT-IR and EDS analysis of the seaweeds Sargassum wightii (brown algae) and Gracilaria corticata (red algae). Int J Curr Microbiol Appl Sci. 2014;3(4):341–351.
- Usharani S, Rajendran V. Morphologically controlled synthesis, structural and optical properties of CeO2/SnO2 nanocomposites. J Sci Adv Mater Devices. 2017;2(3):333–339.
- Awual MR, Jyo A, El-Safty SA, et al. A weak-base fibrous anion exchanger effective for rapid phosphate removal from water. J Hazard Mater. 2011;188(1-3):164–171.
- Long F, Gong J-L, Zeng G-M, et al. Removal of phosphate from aqueous solution by magnetic Fe–Zr binary oxide. Chem Eng J. 2011;171(2):448–455.
- Tanada S, Kabayama M, Kawasaki N, et al. Removal of phosphate by aluminum oxide hydroxide. J Colloid Interface Sci. 2003;257(1):135–140.
- Leduc J-F, Leduc R, Cabana H. Phosphate adsorption onto chitosan-based hydrogel microspheres. Adsorpt Sci Technol. 2014;32(7):557–569.
- Rahmani A, Mousavi HZ, Fazli M. Effect of nanostructure alumina on adsorption of heavy metals. Desalination. 2010;253(1-3):94–100.
- Chen J, Kong H, Wu D, et al. Phosphate immobilization from aqueous solution by fly ashes in relation to their composition. J Hazard Mater. 2007;139(2):293–300.
- Johansson L, Gustafsson JP. Phosphate removal using blast furnace slags and opoka-mechanisms. Water Res. 2000;34(1):259–265.
- Febrianto J, Kosasih AN, Sunarso J, et al. Equilibrium and kinetic studies in adsorption of heavy metals using biosorbent: a summary of recent studies. J Hazard Mater. 2009;162(2-3):616–645.
- Netzahuatl-Muñoz AR, del Carmen Cristiani-Urbina M, Cristiani-Urbina E. Chromium biosorption from Cr (VI) aqueous solutions by Cupressus lusitanica bark: kinetics, equilibrium and thermodynamic studies. PLoS One. 2015;10(9):e0137086.
- Khambhaty Y, Mody K, Basha S, et al. Kinetics, equilibrium and thermodynamic studies on biosorption of hexavalent chromium by dead fungal biomass of marine Aspergillus niger. Chem Eng J. 2009;145(3):489–495.
- Azimvand J, Didehban K, Mirshokraie S. Safranin-O removal from aqueous solutions using lignin nanoparticle-g-polyacrylic acid adsorbent: Synthesis, properties, and application. Adsorpt Sci Technol. 2018;36(7-8):1422–1440.
- Riahi K, Thayer BB, Mammou AB, et al. Biosorption characteristics of phosphates from aqueous solution onto Phoenix dactylifera L. date palm fibers. J Hazard Mater. 2009;170(2-3):511–519.
- Wahab MA, Hassine RB, Jellali S. Posidonia oceanica (L.) fibers as a potential low-cost adsorbent for the removal and recovery of orthophosphate. J Hazard Mater. 2011;191(1-3):333–341.
- Moharami S, Jalali M. Effect of TiO2, Al2O3, and Fe3O4 nanoparticles on phosphorus removal from aqueous solution. Environ Prog Sustainable Energy. 2014;33(4):n/a– 19.
- Samadani Langeroodi N, Tahery F, Mehrani S. Thermodynamic and kinetic investigation of citric acid adsorption by rice bran. NBR. 2015;2(3):166–175.
- Zaki A, El-Sheikh M, Evans J, et al. Kinetics and mechanism of the sorption of some aromatic amines onto amberlite IRA-904 anion-exchange resin. J Colloid Interface Sci. 2000;221(1):58–63.
- Gupta VK, Srivastava SK, Mohan D. Equilibrium uptake, sorption dynamics, process optimization, and column operations for the removal and recovery of malachite green from wastewater using activated carbon and activated slag. Ind Eng Chem Res. 1997;36(6):2207–2218.
- Vega ED, Narda GE, Ferretti FH. Adsorption of citric acid from dilute aqueous solutions by hydroxyapatite. J Colloid Interface Sci. 2003;268(1):37–42.
- Shakirullah M, Ahmad I, Shah S. Sorption studies of nickel ions onto sawdust of Dalbergia sissoo. J Chinese Chem Soc. 2006;53(5):1045–1052.
- Yan L-g, Xu Y-y, Yu H-q, et al. Adsorption of phosphate from aqueous solution by hydroxy-aluminum, hydroxy-iron and hydroxy-iron-aluminum pillared bentonites. J Hazard Mater. 2010;179(1-3):244–250.
- Nguyen TMP, Van HT, Nguyen TV, et al. phosphate adsorption by silver nanoparticles-loaded activated carbon derived from tea residue. Sci Rep. 2020;10(1):1–13.
- Inal IIG, Holmes SM, Banford A, et al. The performance of supercapacitor electrodes developed from chemically activated carbon produced from waste tea. Appl Surf Sci. 2015;357:696–703.
- Deliyanni E, Peleka E, Lazaridis N. Comparative study of phosphates removal from aqueous solutions by nanocrystalline akaganéite and hybrid surfactant-akaganéite. Sep Purif Technol. 2007;52(3):478–486.
- Yao S, Li J, Shi Z. Phosphate ion removal from aqueous solution using an iron oxide-coated fly ash adsorbent. Adsorpt Sci Technol. 2009;27(6):603–614.
- Lalley J, Han C, Mohan GR, et al. Phosphate removal using modified Bayoxide® E33 adsorption media. Environ Sci Water Res Technol. 2015;1(1):96–107.
- Zhou Q, Wang X, Liu J, et al. Phosphorus removal from wastewater using nano-particulates of hydrated ferric oxide doped activated carbon fiber prepared by Sol–Gel method. Chem Eng J. 2012;200-202:619–626.
- Shahid MK, Kim Y, Choi Y-G. Adsorption of phosphate on magnetite-enriched particles (MEP) separated from the mill scale. Front Environ Sci Eng. 2019;13(5):71.
- Daou T, Begin-Colin S, Greneche J-M, et al. Phosphate adsorption properties of magnetite-based nanoparticles. Chem Mater. 2007;19(18):4494–4505.
- Xu G, Zhang Z, Deng L. Adsorption behaviors and removal efficiencies of inorganic, polymeric and organic phosphates from aqueous solution on biochar derived from sewage sludge of chemically enhanced primary treatment process. Water. 2018;10(7):869.
- Liu Y, Hu X. Kinetics and thermodynamics of efficient phosphorus removal by a composite fiber. Appl Sci. 2019;9(11):2220.
- Li Y, Xie Q, Hu Q, et al. Surface modification of hollow magnetic Fe3O4@NH2-MIL-101(Fe) derived from metal-organic frameworks for enhanced selective removal of phosphates from aqueous solution. Sci Rep. 2016;6:30651
- Cheng Q, Li H, Xu Y, et al. Study on the adsorption of nitrogen and phosphorus from biogas slurry by NaCl-modified zeolite. PloS One. 2017;12(5):e0176109.
- Zhu N, Yan T, Qiao J, et al. Adsorption of arsenic, phosphorus and chromium by bismuth impregnated biochar: Adsorption mechanism and depleted adsorbent utilization. Chemosphere. 2016;164:32–40.