
 ?Mathematical formulae have been encoded as MathML and are displayed in this HTML version using MathJax in order to improve their display. Uncheck the box to turn MathJax off. This feature requires Javascript. Click on a formula to zoom.
Abstract
The RET protein is a transmembrane receptor tyrosine kinase (RTK) whose oncogenic mutations or fusions are closely related to human cancers such as thyroid and non-small cell lung cancer. Vandetanib as a clinical-approved protein-tyrosine kinase inhibitor (TKI) exhibits anti-cancer efficacy by blocking the RET ATP-binding site, but drug resistance was observed for the RETG810A mutant. Recent studies have identified another TKI nintedanib as an effective molecule to inhibit vandetanib-resistant RETG810A. However, there is no clear evidence of why nintedanib and vandetanib displayed different inhibitory activities towards RETG810A. Here, we exploited molecular dynamic (MD) simulations to compare the interactions of the RETG810A mutant with nintedanib and vandetanib. A higher structural flexibility of the activation loop was observed in the nintedanib-bound RETG810A, which may result in discrepant autophosphorylation activity in the nintedanib- and vandetanib-bound RET kinase, causing differentiated pharmacological effects of the two compounds. Molecular mechanics/Poisson-Bolzmann surface area method suggested that nintedanib had a higher affinity towards RETG810A over vandetanib, accounting for its better inhibitory effect as an ATP-competitive compound. These results depicted the underlying mechanism for the different inhibitory efficacy of nintedanib and vandetanib on RETG810A from both conformational and energetic aspects. Furthermore, we also found that both compounds maintained the ‘DFG-in, αC-helix-in, and activation loop-open’ conformation of RETG810A, which is the characteristic of the active state. Together, our results provide comprehensive mechanistic insights into nintedanib’s capability in inhibiting vandetanib-resistant RET mutant and enlighten future structural-based optimisation of RET TKIs to overcome drug resistance.
1. Introduction
The RET protein, encoded by the gene RET (abbreviation for the ‘REarranged during Transfection’), is a transmembrane receptor belonging to the receptor tyrosine kinases (RTKs) family [Citation1, Citation2]. As an important promoter for the development of human kidneys and enteric nervous system [Citation3–5], RET receives the extracellular signals such as the glial cell line-derived neurotropic factor (GDNF) with co-receptors [Citation6], activates its kinase activity through homodimerization and autophosphorylation [Citation7], and ultimately facilitates the down-stream signalling cascades including MAPK, PI3K, and PKA pathways to activate cell proliferation [Citation8–11]. Aberrant activation of RET resulting from either oncogenic mutations of RET gene or chromosomal rearrangements can lead to the occurrence of solid tumours such as medullar thyroid cancer (MTC) and non-small cell lung cancer (NSCLC) [Citation12–14].
RET structure consists of an extracellular domain (residues 1-635) containing four cadherin-like domains and a cysteine-rich domain, a transmembrane domain, a juxtamembrane region, and the kinase domain (residues 724-1016) [Citation15]. The intracellular kinase domain, which shows high structural similarity with other RTKs, sets up a suitable target for the inhibition of RET activities using small-molecule inhibitors in the treatment of RET-associated diseases [Citation16, Citation17]. Several multi-kinase TKIs that possess broad-spectrum RTK inhibitory effects have shown activities against RET, including cabozantinib, lenvatinib, sorafenib, vandetanib, ponatinib, sunitinib, and alectinib [Citation15, Citation18, Citation19]. Among them, vandetanib has received the approval from US Food and Drug Administration for the treatment of MTC in patients with oncogenic RET mutations.
However, the emergence of drug-resistant mutations represents an upcoming challenge, as a vast amount of cases in clinic and in laboratory have been reported [Citation20]. For example, the RETG810A mutant that has an alteration of glycine residue to alanine at the ATP-binding pocket has recently identified as a vandetanib-resistant target [Citation21]. Since mutations on RET kinase domain may result in the drug resistance to one or several specific RET TKIs, current solutions to overcome the challenge are by screening other potentially active compound among the clinically relevant RET TKIs. As such, another TKI nintedanib, which was previously designed for targeting angiokinases (e.g. VEGFR), was found to be effective in inhibiting RETG810A [Citation21, Citation22].
Until now, the molecular basis of how a single mutation in the RET kinase domain can result in drug resistance and why various TKIs have different inhibitory effects on the same drug-resistant mutant remains poorly understood [Citation23]. Recent studies have resolved the co-crystal structures of wild-type RET kinase domain in complex with vandetanib [Citation17] or nintedanib [Citation20]. Nonetheless, there are no direct structural evidence of how nintedanib and vandetanib differently interact with the RETG810A mutant. In addition, whether the two compounds may cause distinct allosteric effects on the RET conformational dynamics is also unknown.
Here, using computational methods we established the RETG810A−nintedanib and RETG810A−vandetanib models and exploited molecular dynamic (MD) simulations to investigate discrepancies in the interaction modes between the two compounds towards the RETG810A mutant. We compared the binding affinities of the two compounds towards the ATP-binding pocket and the global conformational changes of RETG810A kinase domain, thus revealing the underlying mechanisms for the differentiated inhibitory effects of nintedanib and vandetanib. This study may promote future optimisation of RET TKIs.
2. Methods
2.1. System preparation
Based on the crystal structures, two systems were built for MD simulations, namely RETG810A−nintedanib and RETG810A−vandetanib, The crystal structures of wild-type RET kinase bound to nintedanib (PDB ID: 6NEC) [Citation20] and vandetanib (PDB ID: 2IVU) [Citation17] were used to define the initial coordinates of RETG810A mutant in complex with nintedanib or vandetanib. The RET G810 residue in both complexes were mutated to alanine using Discovery Studio 2019. The non-terminal missing residues were repaired using Modeller [Citation24] implanted in the UCSF Chimera software.
2.2. All-atom MD simulations
Initial parameter files for minimisation and simulation were prepared first using Amber ff14SB force field [Citation25] and general Amber force field (GAFF) [Citation26]. Hydrogens of the RET proteins were added using the LEaP program in Amber18 package. The pharmaceutical compounds nintedanib and vandetanib were first protonated to electroneutral, and then their force field parameters were built by antechamber [Citation26, Citation27]. Both systems were solvated to truncated octahedron transferable intermolecular potential three point (TIP3P) water box [Citation28]. Na+ and Cl- counterions were added to neutralise system charges and then to the concentration of 0.154 mol·L−1 to simulate the physiological environment. Second, for each system, two rounds of energy minimizations were carried out for structural optimizations [Citation29–34]. All atoms of RET protein and the inhibitor were restrained in the first round of minimisation while were without any constraints in the second round. Then, both systems were heated from 0 K to 300 K within 300 ps in a canonical ensemble (NVT), followed by 700 ps equilibration simulations. Finally, 300 ns production runs were performed under isothermal isobaric condition using the CUDA version of PMEMD. For each system, the production run was repeated in three replicates by setting random initial velocities, adding up a total of ∼1.8 μs simulation time for the two systems. During both simulations, the particle mesh Ewald method [Citation35] was employed for long-range electrostatic interactions, and the cut-off distance for short-range electrostatic interactions as well as van der Waals interactions was set to 10 Å. Covalent bonds involving hydrogens were restricted using SHAKE methods.
2.3. Dynamic cross-correlation matrix (DCCM) analysis
The dynamic cross-correlation matrix (DCCM) of all protein Cα atoms were calculated to reflect the inter-residue correlations [Citation36–40]. The cross-correlation coefficient Cij was calculated by:
(1)
(1)
where ri and rj represents the positions of the ith and jth Cα atoms.
2.4. Hydrogen-bond analysis
Inter- and intra-molecule hydrogen-bonds were determined using simple geometric criteria. A hydrogen bond is determined as a hydrogen atom being in the between of two heavy atoms among N, O, and F, with the distance of heavy atoms less than 3.5 Å and the bond angle greater than 135°. A comprehensive scan of hydrogen-bonds throughout MD trajectories was realised by using the cpptraj software [Citation41].
2.5. Determination of representative structures
The representative structures from certain groups of snapshots in the MD trajectories were extracted using the cluster analyses method [Citation42–44]. Here, the hierarchical agglomerative (bottom-up) algorithm was adopted, with a distance cut-off value of 2.0 Å. Before cluster analysis, the snapshots were superimposed using all Cα atoms to eliminate overall rotations and transitions.
2.6. Molecular mechanics Poisson-Boltzmann surface area (MM/PBSA) calculations
To evaluate the binding affinities between nintedanib/vandetanib and RETG810A, we used MM/PBSA plugin from MMPBSA.py in Amber18 package to calculated the binding free energies [Citation45–48]. The Gibbs free energy change of the binding process is defined by EquationEq. (2)
(2)
(2) :
(2)
(2)
where the Gibbs free energy of each system is the algebraic sum of three compartments, including the molecular mechanical energy (
), solvation energy (
) and the entropic components (
):
(3)
(3)
By defining molecular mechanical energy change solvation energy change
and entropy change
EquationEq. (3)
(3)
(3) can be simplified to:
(4)
(4)
Then, is ulteriorly decomposed into the van der Waals component
the electrostatic component
and the internal component
Because ligands and RET proteins adopted same configurations in both unbound and bound states within a single snapshot,
is always equal to zero in our calculations.
(5)
(5)
For the calculation of in EquationEq. (4)
(4)
(4) , we divided it into the polar part
and the nonpolar part
and applied Poisson-Boltzmann continuum solvent model:
(6)
(6)
The nonpolar component was calculated based on the solvent-accessible surface-area (SASA) with the following format, where the surface tension parameter γ was set to 0.00542 kcal·mol−1·Å−2, and the solvation parameter b was set to 0.92 kcal/mol.
(7)
(7)
The conformation entropy component () was omitted here for the simplification of our calculations since no significant conformational shifts on the pharmaceutical compounds or RET backbones were observed during our MD simulations.
For each system, trajectory snapshots from the last 180 ns of the three independent replicates were selected and averaged for energy calculations. The dielectric constant was set to 1.0 and 80.0 for the solute and solvent, respectively. Furthermore, a per-residue scheme was applied to determine the energetical contributions of each residue of the binding process.
3. Results
3.1. An overview on the overall conformational dynamics of RETG810A−nintedanib and RETG810A−vandetanib
To investigate the underlying mechanism how nintedanib can inhibit the vandetanib-resistant RETG810A mutant, the structural basis between RETG810A−nintedanib and RETG810A−vandetanib was compared. To the best of our knowledge, there is no direct structural evidence of how nintedanib or vandetanib interact with the RETG810A mutant, and the crystal structures of RET kinase domain shared great similarities between RETWT−nintedanib and RETWT−vandetanib (). Thus, we constructed the nintedanib- and vandetanib-bound RETG810A complexes using computational model based on X-ray crystal structures [Citation17, Citation20] and conducted MD simulations to compare the difference of the ligand-protein interactions.
Figure 1. Conformational dynamics of RETG810A in complex with nintedanib and vandetanib. (A) The alignment of the initial structures of RETG810A−nintedanib and RETG810A−vandetanib based on PDB ID 6NEC (chain A) and 2IVU. (B) RMSDs of all Cα atoms of RETG810A bound to nintedanib (orange) and vandetanib (green) along simulation time. (C) RMSFs of RETG810A bound to nintedanib (orange) and vandetanib (green) during equilibrium simulations. Transparencies represent the standard deviations. Dynamic cross-correlation matrix of (D) RETG810A−nintedanib and (E) RETG810A−vandetanib. Red colour denotes correlation and blue colour denotes anti-correlation. The density of colours implies the correlation extent.
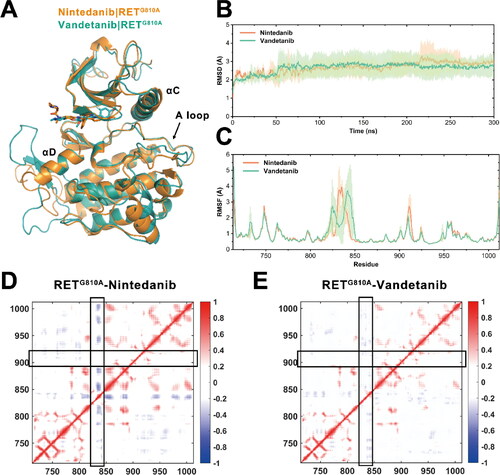
The root-mean-square deviations (RMSDs) of RETG810A Cα atoms relative to the corresponding initial crystal structures were calculated to reflect the overall conformational changes of RET during 300 ns simulations. After ∼100 ns simulations the RMSD values of the RETG810A−nintedanib system and RETG810A−vandetanib system were stabilised at 2.83 ± 0.46 Å and 2.78 ± 0.54 Å, respectively (). This suggested that both systems reached equilibrium where no major conformational shifts occurred on the backbone of RETG810A. The reference structures of the two systems showed a low relative RMSD value of 0.36 Å, indicating that no substantial overall conformational distinctions were observed among the two systems during simulations.
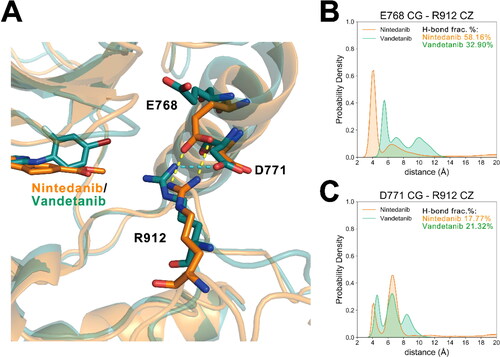
Next, by calculating the root-mean-square fluctuations (RMSFs) of each RET residue using the coordinates of the Cα atoms, the mobilities of corresponding residues during the equilibrium-state simulations were compared. As shown in , in most regions of RETG810A of the two systems, the backbone atoms showed low flexibilities with the RMSF values under 1.0 Å. The most significant distinctions between the two systems lie in the loop region that links the αD and αE helices (residues 821-846) and the activation loop (A loop) (residues 892-921) of RETG810A. Since the former loop region was missing in the initial crystal structures due to its hyperdynamic nature and may have little impact on the kinase activities [Citation20, Citation46–48], we focussed on the analyses on the distinctions of the A loop region between the two systems. The positively charged sidechain of Arg912 in the A loop is involved in polar interactions with the αC-helix acidic residues of Glu768 and Asp771 (). In the nintedanib complex, Arg912 formed hydrogen bonds with either Glu768 or Asp771 for 75.15% of the simulation trajectories, while in the vandetanib complex the hydrogen bonds only took up 52.34% snapshots (). Also, during the simulations of the RETG810A−nintedanib complex, the distance between Arg912 and Glu768/Asp771 distributed a broader range than that of RETG810A−vandetanib (), which accounted for the observation that the A loop in the nintedanib system exhibited a higher flexibility from the RMSF analysis. Considering that a previous model suggested the auto-inhibited state of RET by the tether of the glycine-rich loop (GRL) and the αC-helix to A loop, the interactions between A loop and αC-helix observed here may be associated with the higher inhibitory efficacy of nintedanib over vandetanib. Moreover, the disparities of the A loop RMSF may vary the activities of RET’s auto-phosphorylation process, in which tyrosine residues in the A loop serve as the substrate for another RET molecule [Citation16], further regulating its catalytic activity and substrate presenting ability.
Figure 2. Interactions between RET A loop and αC-helix. (A) The alignment of the representative structures of RETG810A−nintedanib (orange) and RETG810A−vandetanib (green). Hydrogen-bonds in two systems are shown by cyan and yellow dashed lines, respectively. (B) Distance distributions between Glu768 CG atom and Arg912 CZ atom in two systems. (C) Distance distribution between Asp771 CG atom and Arg912 CZ atom in two systems. H-bond frac.% represents the fractions of frames in which the corresponding hydrogen-bond is detected.
Furthermore, the dynamic cross-correlation matrix (DCCM) was analyzed to reveal the correlations between residues during simulation. As shown in , regions in red denote correlation between the corresponding residues and regions in blue denotes anti-correlation. The regions with low density of colours indicate a low extent of correlation [Citation49–51]. Herein, we focussed on the two loop regions with high flexibilities recognised by RMSF analysis. In the nintedanib complex, the loop between αD and αE helices was found to be anti-correlated with several other regions of RET, while the same region in the RETG810A−vandetanib was poorly correlated. This explained the RMSF observation that the flexibility of corresponding residues was much lower in the nintedanib complex.
3.2. Nintedanib exhibits higher affinity towards RETG810A than vandetanib
Since nintedanib and vandetanib are both ATP-competitive inhibitors of RET, their binding affinities towards RETG810A are a key determinant for their pharmacological efficacies. Here, we exploited MM/PBSA calculations to compare the of two compounds towards RETG810A. For each system, a total of 180 frames from three independent replicates after the RMSD values reaching equilibrium were employed to calculate the average Gibb’s free energies. As shown in , the binding free energies between nintedanib or vandetanib and the RETG810A are −46.92 ± 3.74 kcal/mol and −34.38 ± 3.65 kcal/mol, respectively, exhibiting significant differences. The ∼12 kcal/mol gap in the binding free energy indicated a much higher affinity of nintedanib towards RETG810A, which suggested a greater ability for it to outcompete ATP and to inhibit a larger proportion cellular RET proteins than vandetanib.
Table 1. Binding free energy analysis between nintedanib/vandetanib and RETG810A (all units in kcal/mol)*.
The binding free energy was calculated by the algebraic summation of system energy changes on the inter-molecular mechanic interactions in the gas phase and the solute-solvent interactions upon the binding process. Each item was further divided into the polar (i.e. electrostatic) and nonpolar components, namely and
for the molecular mechanic interactions, and
and
for the solvation energies, respectively. A detailed insight into the energetic components suggested that the predominant discrepancy between the two systems is the electrostatic attraction among the ligand and the RETG810A polar residues. This may mainly attribute to the more polarised methylcarboxy group and the indolin-2-one ring at the one end of the nintedanib molecule, which stretches deep into the ATP-binding pocket of RETG810A.
3.3. Combined structural and energetical analyses on nintedanib/vandetanib − RETG810A interactions
To better understand the mechanisms for the higher affinity of nintedanib, we then gave a more detailed insights into the interaction modes between the inhibitors and RETG810A from both structural and energetical aspects. First, the representative structures of two systems during simulations were extracted using cluster analysis and the LigPlot program [Citation52] was used to more explicitly display the interactions between the ligand’s functional groups and the residues in RETG810A. As shown in , there were three hydrogen-bonds recognised in the representative structure of RETG810A−nintedanib complex, while there was only one observed in the vandetanib complex. In addition, through hydrogen-bond analysis we revealed that the polar interactions between the ligand and RETG810A had a longer lifetime and shorter average hydrogen-bond length during simulations in the nintedanib-bound system than in the vandetanib-bound system (). This suggested more stable and strengthened polar interactions between the inhibitor and RET in the RETG810A−nintedanib complex, in consistence with the results from the above MM/PBSA analysis. Moreover, as more RET residues are recognised to participate in the hydrophobic contacts with the ligand, more binding interactions between nintedanib and RETG810A were observed ().
Figure 3. Structural and energetic comparisons on the interactions of nintedanib/vandetanib with RETG810A. LigPlot diagram of the (A) RETG810A−nintedanib complex and (B) RETG810A−vandetanib complex. Hydrogen bonds between ligands and protein residues are represented by green dashed lines and bond length are labelled in green (Å). Hydrophobic contacts are represented by an arc with spokes radiating towards the ligand atoms they contact. The contacted atoms in the ligands are shown with spokes radiating back. (C) Per-residue decomposition of binding free energy for the RETG810A−nintedanib (orange) and RETG810A−vandetanib (green) systems. (D) Front and (E) back view of residues with large binding free energy contributions (>0.5 kcal/mol) in the representative structures. Residues that favour the binding of nintedanib are labelled in red while residues favour the binding of vandetanib are labelled in blue.
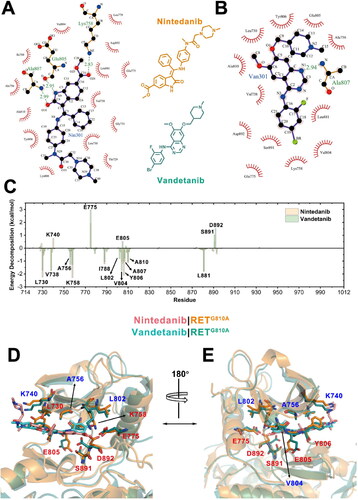
Table 2. Hydrogen-bonds between RETG810A and the inhibitors*.
Then, using the MM/PBSA decomposition method, we analyzed the residue-wise contributions on the binding affinity between the ligands and RETG810A (). Residues that had significant different contributions (> 0.5 kcal/mol) between the two systems were shown as sticks in . As expected, the main contributors of the inhibitor-RET binding energy derived from the hinge strand (residues 806-811), which is also important for the binding of ATP [Citation53, Citation54]. This is because two residues from the hinge strand, Glu805 and Ala807, bolster the binding of nintedanib through hydrogen bonds with the N9 and O10 atoms of nintedanib, respectively. In contrast, the interaction was weaker between the hinge region and the vandetanib, since only one hydrogen-bond (between the N1 atom of vandetanib and RET Ala807) was detected (). Moreover, Tyr806 of the hinge strand also had a significant higher binding contribution in the nintedanib system, which may be the result of a favoured hydrophobic interactions with the central phenyl ring of the nitedanib backbone.
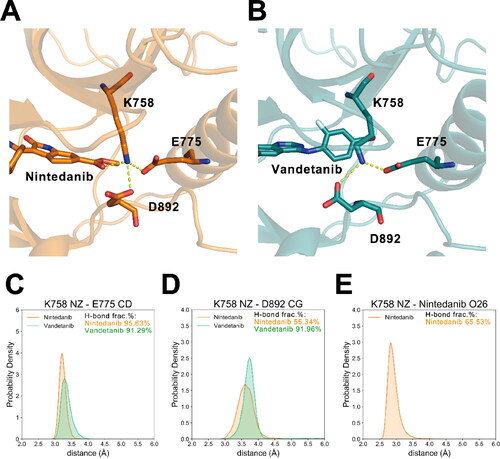
In addition to the hinge region at the solvent front of the ATP-binding pocket, there was also a solvent-inaccessible residue Lys758 inside the deep ATP pocket that formed hydrogen bonds with nintedanib. Interestingly, the sidechain orientation of Lys758 is stabilised by the formation of hydrogen-bonds with Glu775 in the αC-helix and Asp892 in the DFG motif (). Lys758, Gly775, and Asp892 all favoured the binding of nintedanib over vandetanib, further confirming that the tether of these residues and the methylcarboxy group of nintedanib largely strengthened the docking of the inhibitor to the ATP-binding pocket. In contrast, no polar interactions comprising RET Lys758 were observed in the vandetanib complex throughout the simulation trajectories.
Figure 4. The representative structures of the hydrogen-bond networks involving Lys758 in (A) RETG810A−nintedanib and (B) RETG810A−vandetanib complex. Distance distributions between (C) Lys758 NZ atom and Glu775 CD atom, (D) Lys758 NZ atom and Asp892 CG atom in two systems. (E) Distance distribution between Lys758 NZ atom and nintedanib O26 atom in the RETG810A−nintedanib complex. H-bond frac.% represents the fractions of frames in which the corresponding hydrogen-bond is detected.
Additionally, we also found that at the mutation site the Ala810 blocked the polar interactions of the vandetanib towards the enzyme of the solvent by hydrophobic burying of the vandetanib O and O1 atoms (Figure S1), while this effect was reduced to a lesser extent in the case of nintedanib. This finding can explain the drug resistance arose in the RETG810A mutant towards vandetanib. Together, these results strengthened the interpretation that nintedanib had a higher affinity towards RETG810A over vandetanib, which probably was the main reason that nintedanib persisted its efficacy to the vandetanib-resistant G810A mutant.
3.4. Both nintedanib- and vandetanib-bound RETG810A maintained the active ‘DFG-in, αC-helix-in, a loop-open’ conformation
Apart from direct binding to the ATP pocket to inhibit ATP loading, orthosteric TKIs may also induce allosteric effects on specific regions of protein kinases, which further perturb the active-state conformations and diminish the binding of down-stream substrates or allosteric regulators [Citation55–60]. To explore whether the different inhibitory effects on RETG810A of nintedanib and vandetanib are also a result of the allosteric regulation, a more detailed insight into the conformational dynamics of several specific regions of RET that is associated with RET activities was analyzed. The configurations of the DFG motif (residues 892-894), the αC-helix (residues 766-781), and A loop have been reported to be highly correlated to the activation process of protein kinases. In the initial crystal structures of RET − nintedanib and RET − vandetanib, the wild-type RET protein adopted a ‘DFG-in, αC-helix-in, and A loop open’ conformation (Figure S2A-C), which suggested an active state of RET suitable for substrate binding and phosphorylation catalysis. We compared the conformational changes in these three regions in the nintedanib- and vandetanib-bound RETG810A mutant during the simulations.
According to the above RMSF analysis, the DFG motif and αC-helix were rigid in both systems during simulations. We observed that the DFG motif maintained in an ‘in’ conformation in both nintedanib- or vandetanib-bound RETG810A, with the Asp892 inserting into the ATP-binding pocket and the benzene ring of Phe893 pointing away from the pocket to form hydrophobic contacts with αC-helix (). This was confirmed by the stabilisation of the heavy-atom RMSD of the DFG motif at low levels during simulations, using the initial crystal structures as references (). Thus, no ‘DFG-in’ to ‘DFG-out’ conformational transitions was detected.
Figure 5. Detailed conformational insights into several RET functional regions. (A) The alignment of the representative structures of RETG810A−nintedanib (orange) and RETG810A−vandetanib (green) displaying the DFG motif. The conformation of the DFG motif in the initial crystal structure of RETWT−nintedanib is shown in white sticks. (B) Heavy-atom RMSD of the DFG motif relative to the initial crystal structures. Transparencies represent the standard deviations. (C) An alignment of the representative structures of RETG810A−nintedanib and RETG810A−vandetanib displaying R spine residues (Leu790, Leu779, Phe893, and His872). The R spine residues in the active assembly in the RETWT−nintedanib crystal structure is also shown in white sticks. (D) Heavy-atom RMSD of the R spine residues relative to the initial crystal structures. Transparencies represent the standard deviations. (E) An alignment of the representative structures of RETG810A−nintedanib and RETG810A−vandetanib highlighting the GRL region. The GRL in RETG810A−nintedanib and RETG810A−vandetanib were both in the ‘open’ conformation, in comparison to the ‘closed’ conformation in the RETWT−nintedanib crystal structure.
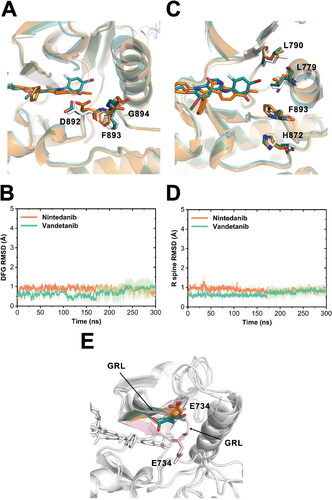
The ‘αC-helix-in’ conformation is characterised by the formation of a polar interaction between RET Glu775 of αC-helix and the Lys758 at its N-terminus β-sheet. As shown in , the distance between CD atom of Glu775 and NZ atom of Lys758 was compactly distributed at a low range in both systems. Also, through hydrogen-bond analysis we observed polar interactions between Glu775 and Lys758 in 95.63% and 91.29% of the trajectory frames in the nintedanib- and vandetanib-bound systems, respectively. These results demonstrated that neither nintedanib nor vandetanib was able to disrupt the ‘αC-helix-in’ conformation of RETG810A. In addition to enhance the binding of nintedanib towards RETG810A, the above-mentioned hydrogen-bond network featuring Lys758, Glu775, Asp892, and the methylcarboxy group of nintedanib also stabilised the ‘DFG-in, αC-helix-in’ conformation in RETG810A−nintedanib ().
A key determinant for the substrate binding ability of RET depends on whether the A loop is in the ‘open’ or ‘closed’ conformation. The ‘open’ conformation features an extended A loop, which is compatible with substrate docking, while in the ‘closed’ conformation A loop is compressed. For example, in the catalytically inactive state of the RET-analogous kinase EGFR, the A loop adopted a ‘closed’ conformation with the formation of two short α-helices in A loop. Here, using the dictionary of secondary structure of proteins (DSSP) algorithm [Citation61], we validated that no α-helices was formed in the A loop in both systems during all simulations (Table S1 & S2). This confirmed that despite the disparities in the A loop flexibility, it persisted the ‘open’ state conformation in both systems.
Additionally, the arrangement of the regulatory spine (R spine), consisting of four residues (Leu779, Leu790, His872 and Phe893), represents the activation status of the RET [Citation62]. The RMSDs of the R spine also remained at a low value during simulations in both systems, implying the stabilisation of the active-state conformation (). Moreover, in contrast to the previous crystal structure observations that the GRL adopted different conformations in the nintedanib- and vandetanib-bound RET [Citation20], the GRL regions of RETG810A was both in the open conformation in our simulations (), suggesting the active conformation.
4. Conclusions
Using MD simulations, we revealed the underlying mechanisms of the discrepant inhibitory effects of nintedanib and vandetanib on the kinase activities of RETG810A mutant. As ATP-competitive inhibitors, nintedanib exhibited a much higher affinity towards RETG810A ATP-binding pocket than vandetanib, which is due to the stronger hydrogen-bond polar interactions between nintedanib and RET. Through H-bond analysis and energetic decomposition calculations, we found that nintedanib formed three stable hydrogen-bonds with RETG810A, involving RET Glu805 and Ala807 from the hinge region and Lys758 from the N-lobe. In comparison, there was only one hydrogen-bond observed between RETG810A and vandetanib, and was less durable in MD simulations. In the RETG810A−nintedanib complex, the Lys758 was stabilised by the ‘DFG-in, αC helix-in, A loop-open’ conformation, where two residues from the αC helix and DFG motif (Glu775 and Asp892, respectively) tethered the sidechain of Lys758 and made it better accommodated to the binding of nintedanib. Moreover, the A loop in the RETG810A−nintedanib complex displayed higher flexibility, which may also be associated with RET’s auto-regulation and substrate presenting abilities. Collectively, these results untangled the molecular basis for the experimental findings that nintedanib was efficient to inhibit the vandetanib-resistant RETG810A mutant, inspiring future structure-based optimizations of TKIs targeting RET to overcome drug resistance.
Supplemental Material
Download MS Word (1 MB)Acknowledgements
The authors thank the Supercomputer Center at Shanghai Supercenter for providing computational resources.
Disclosure statement
The authors have no conflicts of interest.
References
- Takahashi M, Ritz J, Cooper GM. Activation of a novel human transforming gene, ret, by DNA rearrangement. Cell. 1985;42(2):581–588.
- Borrello MG, Ardini E, Locati LD, et al. RET inhibition: implications in cancer therapy. Expert Opin Ther Targets. 2013;17(4):403–419.
- Tsuzuki T, Takahashi M, Asai N, et al. Spatial and temporal expression of the ret proto-oncogene product in embryonic, infant and adult rat tissues. Oncogene. 1995;10(1):191–198.
- Zhang J, Yu Z, You G. Insulin-like growth factor 1 modulates the phosphorylation, expression, and activity of organic anion transporter 3 through protein kinase a signaling pathway. Acta Pharm Sin B. 2020;10(1):186–194.
- Chi X, Michos O, Shakya R, et al. Ret-dependent cell rearrangements in the Wolffian duct epithelium initiate ureteric bud morphogenesis. Dev Cell. 2009;17(2):199–209.
- Wang X. Structural studies of GDNF family ligands with their receptors-insights into ligand recognition and activation of receptor tyrosine kinase RET. Biochim Biophys Acta. 2013;1834(10):2205–2212.
- Drilon A, Hu ZI, Lai GGY, et al. Targeting RET-driven cancers: lessons from evolving preclinical and clinical landscapes. Nat Rev Clin Oncol. 2018;15(3):150–167.
- Xiang H, Zhang J, Lin C, et al. Targeting autophagy-related protein kinases for potential therapeutic purpose. Acta Pharm Sin B. 2020;10(4):569–581.
- Worby CA, Vega QC, Zhao Y, et al. Glial cell line-derived neurotrophic factor signals through the RET receptor and activates mitogen-activated protein kinase. J Biol Chem. 1996;271(39):23619–23622.
- Fukuda T, Kiuchi K, Takahashi M. Novel mechanism of regulation of Rac activity and lamellipodia formation by RET tyrosine kinase. J Biol Chem. 2002;277(21):19114–19121.
- Zhao K, Guo T, Wang C, et al. Glycoside scutellarin enhanced CD-MOF anchoring for laryngeal delivery. Acta Pharm Sin B. 2020;10(9):1709–1718.
- Gainor JF, Shaw AT. Novel targets in non-small cell lung cancer: ROS1 and RET fusions. Oncologist. 2013;18(7):865–875.
- Kato S, Subbiah V, Marchlik E, et al. RET aberrations in diverse cancers: next-generation sequencing of 4,871 patients. Clin Cancer Res. 2017;23(8):1988–1997.
- Li T, Yan G, Bai Y, et al. Papain bioinspired gold nanoparticles augmented the anticancer potency of 5-FU against lung cancer. J Exp Nanosci. 2020;15(1):109–128.
- Suresh S, Muthukrishnan L, Vennila S, et al. Mechanistic anticarcinogenic efficacy of phytofabricated gold nanoparticles on human lung adenocarcinoma cells. J Exp Nanosci. 2020;15(1):160–173.
- Plaza-Menacho I. Structure and function of RET in multiple endocrine neoplasia type 2. Endocr Relat Cancer. 2018;25(2):T79–90.
- Knowles PP, Murray-Rust J, Kjaer S, et al. Structure and chemical inhibition of the RET tyrosine kinase domain. J Biol Chem. 2006;281(44):33577–33587.
- Wells SAJ. Advances in the management of MEN2: from improved surgical and medical treatment to novel kinase inhibitors. Endocr Relat Cancer. 2018;25(2):T1–13.
- Mologni L. Development of RET kinase inhibitors for targeted cancer therapy. Curr Med Chem. 2011;18(2):162–175.
- Terzyan SS, Shen T, Liu X, et al. Structural basis of resistance of mutant RET protein-tyrosine kinase to its inhibitors nintedanib and vandetanib. J Biol Chem. 2019;294(27):10428–10437.
- Liu X, Shen T, Mooers BHM, et al. Drug resistance profiles of mutations in the RET kinase domain. Br J Pharmacol. 2018;175(17):3504–3515.
- Gautschi O, Milia J, Filleron T, et al. Targeting RET in patients with RET-rearranged lung cancers: results from the global, multicenter RET registry. J Clin Oncol. 2017;35(13):1403–1410.
- Subbiah V, Shen T, Terzyan SS, et al. Structural basis of acquired resistance to selpercatinib and pralsetinib mediated by non-gatekeeper RET mutations. Ann Oncol. 2021;32(2):261–268.
- Sali A, Blundell TL. Comparative protein modelling by satisfaction of spatial restraints. J Mol Biol. 1993;234(3):779–7815.
- Maier JA, Martinez C, Kasavajhala K, et al. ff14SB: improving the accuracy of protein side chain and backbone parameters from ff99SB. J Chem Theory Comput. 2015;11(8):3696–3713.
- Wang J, Wolf RM, Caldwell JW, et al. Development and testing of a general amber force field. J Comput Chem. 2004;25(9):1157–1174.
- Feng L, Lu S, Zheng Z, et al. Identification of an allosteric hotspot for additive activation of PPARγ in antidiabetic effects. Sci Bull. 2021;66(15):1559–1570.
- Jorgensen WL, Chandrasekhar J, Madura JD, et al. Comparison of simple potential functions for simulating liquid water. J Chem Phys. 1983;79(2):926–935.
- Panchal NK, Bhale A, Verma VK, et al. Computational and molecular dynamics simulation approach to analyze the impact of XPD gene mutation on protein stability and function. Mol Sim. 2020;46(15):1200–1219.
- Vatansever S, Erman B, Gümüş ZH. Comparative effects of oncogenic mutations G12C, G12V, G13D, and Q61H on local conformations and dynamics of K-Ras. Comput Struct Biotechnol J. 2020;18:1000–1011.
- Wang DD, Yang-Ou L, Xie H, et al. Predicting the impacts of mutations on protein-ligand binding affinity based on molecular dynamics simulations and machine learning methods. Comput Struct Biotechnol J. 2020;18:439–454.
- Nagarajan H, Vetrivel U. Microsecond scale sampling of Egr-1 conformational landscape to decipher the impact of its disorder regions on structure-function relationship. Mol Sim. 2020;46(16):1255–1264.
- Nie G, Mao Y, Lv Z, et al. Mixed-ligand Cu(II)-containing coordination polymer based on V-shape carboxylate and pyridinyl co-linkers: structural insights, molecular docking and anti-breast cancer activity evolution. J Exp Nanosci. 2019;14(1):160–170.
- Dias FS, Machado WS. Investigation of the thermal conductivity of tetrabenzo[8]circulene (TB8C) by molecular dynamics simulation. Mol Sim. 2021;47(12):1002–1009.
- York DM, Wlodawer A, Pedersen LG, et al. Atomic-level accuracy in simulations of large protein crystals. Proc Natl Acad Sci U S A. 1994;91(18):8715–8718.
- Lu S, Chen Y, Wei J, et al. Mechanism of allosteric activation of SIRT6 revealed by the action of rationally designed activators. Acta Pharm Sin B. 2021;11(5):1355–1361.
- Ni D, Wei J, He X, et al. Discovery of cryptic allosteric sites using reversed allosteric communication by a combined computational and experimental strategy. Chem Sci. 2020;12(1):464–476.
- Lu S, He X, Yang Z, et al. Activation pathway of a G protein-coupled receptor uncovers conformational intermediates as targets for allosteric drug design. Nat Commun. 2021;12(1):4721.
- Wang Y, Ji D, Lei C, et al. Mechanistic insights into the effect of phosphorylation on Ras conformational dynamics and its interactions with cell signaling proteins. Comput Struct Biotechnol J. 2021;19:1184–1199.
- Almourfi FM, Singh I, Shoket H, et al. Study of the dynamics of Ceritinib in complex with common variants of anaplastic lymphoma kinase. Mol Sim. 2020;46(18):1467–1473.
- Roe DR, Cheatham TE. 3rd. PTRAJ and CPPTRAJ: software for processing and analysis of molecular dynamics trajectory data. J Chem Theory Comput. 2013;9(7):3084–3095.
- Han M, Chen LY. Molecular dynamics simulation of human urea transporter B. Mol Sim. 2021;47(12):1022–1028.
- Liang Z, Zhu Y, Long J, et al. Both intra and inter-domain interactions define the intrinsic dynamics and allosteric mechanism in DNMT1s. Comput Struct Biotechnol J. 2020;18:749–764.
- Jenkins K, Mateeva T, Szabó I, et al. Combining data integration and molecular dynamics for target identification in α-Synuclein-aggregating neurodegenerative diseases: structural insights on synaptojanin-1 (Synj1) . Comput Struct Biotechnol J. 2020;18:1032–1042.
- Miller BR, 3rd, McGee TDJ, Swails JM, et al. MMPBSA.py: an efficient program for end-state free energy calculations. J Chem Theory Comput. 2012;8(9):3314–3321.
- Plaza-Menacho I, Barnouin K, Goodman K, et al. Oncogenic RET kinase domain mutations perturb the autophosphorylation trajectory by enhancing substrate presentation in trans. Mol Cell. 2014;53(5):738–751.
- Wang Y, Gao J, Zhao S, et al. Discovery of 4-arylthiophene-3-carboxylic acid as inhibitor of ANO1 and its effect as analgesic agent. Acta Pharm Sin B. 2021;11(7):1947–1964.
- Jang H, Zhang M, Nussinov R. The quaternary assembly of KRas4B with Raf-1 at the membrane. Comput Struct Biotechnol J. 2020;18:737–748.
- Rehman AU, Zhen G, Zhong B, et al. Mechanism of zinc ejection by disulfiram in nonstructural protein 5A. Phys Chem Chem Phys. 2021;23(21):12204–12215.
- Lu S, Ni D, Wang C, et al. Deactivation pathway of Ras GTPase underlies conformational substates as targets for drug design. ACS Catal. 2019;9(8):7188–7196.
- Li X, Dai J, Ni D, et al. Insight into the mechanism of allosteric activation of PI3Kα by oncoprotein K-Ras4B. Int J Biol Macromol. 2020;144:643–655.
- Wallace AC, Laskowski RA, Thornton JM. LIGPLOT: a program to generate schematic diagrams of protein-ligand interactions. Protein Eng. 1995;8(2):127–134.
- Li M, Rehman AU, Liu Y, et al. Dual roles of ATP-binding site in protein kinases: orthosteric inhibition and allosteric regulation. Adv Protein Chem Struct Biol. 2021;124:87–119.
- Qiu Y, Yin X, Li X, et al. Untangling Dual-Targeting therapeutic mechanism of epidermal growth factor receptor (EGFR) based on reversed allosteric communication. Pharmaceutics. 2021;13(5):747.
- Lu S, Shen Q, Zhang J. Allosteric methods and their applications: facilitating the discovery of allosteric drugs and the investigation of allosteric mechanisms. Acc Chem Res. 2019;52(2):492–500.
- Zhang Q, Chen Y, Ni D, et al. Targeting a cryptic allosteric site of SIRT6 with small-molecule inhibitors that inhibit the migration of pancreatic cancer cells. Acta Pharm Sin B. 2021. doi:https://doi.org/10.1016/j.apsb.2021.06.015.
- Lu S, He X, Ni D, et al. Allosteric modulator discovery: from serendipity to structure-based design. J Med Chem. 2019;62(14):6405–6421.
- Lu S, Qiu Y, Ni D, et al. Emergence of allosteric drug-resistance mutations: new challenges for allosteric drug discovery. Drug Discov Today. 2020;25(1):177–184.
- Lu S, Zhang J. Small molecule allosteric modulators of G-protein-coupled receptors: drug-target interactions. J Med Chem. 2019;62(1):24–45.
- Ni D, Li Y, Pu J, et al. Combining allosteric and orthosteric drugs to overcome drug resistance. Trends Pharmacol Sci. 2020;41(5):336–348.
- Kabsch W, Sander C. Dictionary of protein secondary structure: pattern recognition of hydrogen-bonded and geometrical features. Biopolymers. 1983;22(12):2577–2637.
- Kornev AP, Haste NM, Taylor SS, et al. Surface comparison of active and inactive protein kinases identifies a conserved activation mechanism. Proc Natl Acad Sci U S A. 2006;103(47):17783–17788.