
Abstract
Hydrogen sulphide (H2S) is an endogenous gaseous signalling molecule observing cardioprotective qualities in various experimental models. However, its therapeutic application is limited due to rapid release in vivo and potential toxicity. Controlled-release nanoparticles (NPs), such as polylactic-co-glycolic acid (PLGA) NPs entrapping H2S compounds may address these issues. PLGA NPs’ encapsulating sodium thiosulphate (STS), a H2S donor, were prepared by emulsification and sonication-solvent evaporation in polyvinyl alcohol (PVA). Sonication time was varied between 15 and 45 s and PVA concentration varied between 0.3 and 0.7% w/v. NPs were characterised, cellular uptake, H2S generation and encapsulated STS angiogenic potential was explored. An increase in sonication time as well as PVA concentration decreased NPs size resulting in an increase in STS release kinetics and cellular uptake over 24 h. Encapsulated STS gave a controlled release of H2S over 24 h whereas non-encapsulated STS peaked at 2 h. Finally, we observed entrapped STS maintained pro-angiogenic potential. PLGA NPs are a promising controlled-release delivery system with potential to offer sustained H2S levels. Results of this study demonstrate formulation of STS-loaded PLGA NPs provides a controlled-release of STS and therefore H2S. NPs are internalised into cells and critically, PLGA NPs are able to maintain the pro-angiogenic potential of H2S.
1. Introduction
Hydrogen sulphide (H2S), is the third endogenous gaseous signalling molecule after nitric oxide and carbon monoxide in the cardiovascular system [Citation1]. Its antioxidative, antiapoptotic, pro-angiogenic and vasodilating properties have been found to play a crucial role in maintaining cardiac haemostasis [Citation2], protecting the myocardium from ischaemia–reperfusion injury [Citation3] and regulating the immune and inflammatory process [Citation4] during the course of cardiovascular diseases. Therefore, H2S donors offer a potential therapeutic option where a lack of its endogenous availability has resulted in poor cardiac outcomes [Citation5–7].
H2S is synthesised endogenously by enzymatic and non-enzymatic pathways [Citation8]. One of the intermediate endogenous metabolites of H2S in the non-enzymatic pathway is thiosulfate. Furthermore, under hypoxic conditions, thiosulfate generates H2S [Citation9]. Thiosulfate has been exogenously administered as sodium thiosulfate (STS). The administration of two doses (15 g each), 6 h apart of STS was found to have a potential therapeutic benefit in patients with acute coronary syndrome undergoing coronary angiography [Citation10]. These findings are in line with experimental models showing exogenous or endogenous enhancement of H2S levels protects the myocardium against ischemic injury [Citation11]. Suggested cardioprotective mechanisms of H2S include attenuation of apoptotic signals, neutralising reactive oxygen species and decreasing leukocyte–endothelial interaction [Citation12]. Additionally, it was also found that both exogenous and endogenous H2S exhibit cardioprotective effects in heart failure by modulating inflammatory cytokines, such as tissue necrotising factor-α and interleukin-6 concentrations and upregulating nitric oxide synthase [Citation13,Citation14].
Regardless of the highlighted clinical importance of H2S, the conventional application of therapeutic H2S donors is limited in effectiveness due to the poor biodistribution, rapid H2S release, clearance and lack of selectivity [Citation15]. These limitations may be overcome by developing controlled drug delivery systems able to protect the drug from rapid degradation and clearance. Such delivery systems include the use of micro/nanoparticles (NPs) and these may even be developed for targeted drug delivery [Citation16]. Several decades of biomaterials research have increased interest in the use of biodegradable polymeric NPs for drug delivery applications [Citation17–19]. NPs biodistribution is largely determined by their physical and biochemical properties, such as particle size, nature of the polymer and drug and surface charge [Citation20]. Polylactic-co-glycolic acid (PLGA) is a copolymer synthesised from glycolic acid and lactic acid and is one of the safest and successfully used biodegradable polymers used as a drug delivery vehicle [Citation21]. Its amphiphilic nature and ease of particle formulation show promising application in drug-delivery systems thus PLGA NPs are widely used for encapsulation and controlled delivery of therapeutic drugs, proteins and antigens as well as having the possibility to target NPs to specific organs or cells [Citation22]. Furthermore, drug release profiles can be modulated by controlling the particle size and porosity by altering polymer molecular weight, the copolymer ratio, the drug loading and formulation conditions such as sonication time or emulsifier concentration [Citation23,Citation24]. Previously, H2S donors including sodium H2S, thiobenzamide compounds and diallyl trisulfide have been encapsulated in PLGA NPs which were able to deliver and control the release of H2S In the treatment of ocular conditions, cardiovascular conditions and ischaemic injury, respectively [Citation25–27].
The need for a controlled release system for the exogenous delivery of H2S provides a distinctive challenge for scientists to develop safe H2S donor formulation systems, permitting a safe and sustained release of H2S. The objective of this study was to investigate the feasibility of PLGA NPs entrapping STS and explore the effect of formulation parameters on NPs characteristics and STS release. Furthermore, we assessed the H2S release and tested the ability of encapsulated STS to maintain pro-angiogenic properties of H2S.
2. Materials and methods
PLGA (lactide:glycolide (50:50), mol wt 30,000–60,000), poly vinyl alcohol (PVA) (87–90% hydrolysed, average mol wt 30,000–70,000), dichloromethane (DCM) and STS were obtained from Sigma-Aldrich (Dorset, England). 1,1′-Di-n-octadecyl-3,3,3′,3′-tetramethylindocarbocyanine perchlorate, 97% (DilC) was obtained from Alfa Aesar (Lancashire). Tetrabutylammonium hydrogen sulfate, methanol, potassium dihydrogen phosphate and acetic acid were all obtained from Sigma-Aldrich (Dorset, England).
2.1. STS loaded PLGA NPs
Based on prior protocols [Citation28,Citation29], a double emulsion solvent evaporation technique was used for formulation of PLGA NPs. DCM was used to dissolve the PLGA polymer (50 mg/mL) over the course of 4 h. An aliquot of 80 µL (0.3 g/mL) STS, dissolved in water was added drop wise to the DCM containing polymer whilst vortexing. This emulsion was broken down into nanodroplets by applying external energy by way of ultrasonication for 30, 60 or 90 s, with a 5 s interval every 10 s using a MSE Soniprep 150 Plus Ultrasonic Disintegrator fitted with an exponential probe tip at an amplitude of 16 to form the first emulsion (water in oil). This was then added to 1 mL of PVA (5% w/v, aqueous) followed by ultrasonication for 15, 30 or 45 s to form the double emulsion (water in oil in water). The final emulsion was added to 10 mL of either 0.3% of 0.7% of aqueous PVA and stirred overnight to allow evaporation of the DCM. NPs were washed with cold water three times via centrifugation (10 min, 9500 RPM) (Labnet International, Prism™ R) to remove excess STS or PVA. The final NPs pellet was resuspended in 5% (w/v, aqueous) trehalose, flash frozen by immersing the vials in liquid nitrogen for 1–2 min and lyophilised overnight using a freeze dryer (Edwards Vacuum, Modulyo Freeze Dryer) and stored at −20 °C.
2.2. PLGA NP characterisation: particle size, polydispersity and zeta potential
We studied the effect of the time-period of the sonication steps followed by the concentration of the PVA the final NPs were suspended in on mean particle size, polydispersity, zeta potential and STS entrapment efficiency of the PLGA NPs. The mean particle size and the polydispersity index (measurement of the level of homogeneity of particle sizes) of PLGA NPs were measured by dynamic light scattering (DLS) using a Zetaplus (Brookhaven Instruments, Holtsville, NY) and the particle charge was quantified as zeta potential (ζ) using a Zetaplus (Brookhaven Instruments) using established protocols in our laboratory as described before [Citation30]. The encapsulation efficiency was calculated as the ratio between the entrapped STS and the total STS concentration by way of HPLC-UV detection. Briefly, 2 mg of NPs were dispersed in 0.1 mL of acetonitrile, left overnight and diluted following addition of 0.1 mL of PBS. Following centrifugation of the samples at 9500 RPM for 10 min, concentration was determined using HPLC-UV detection (as detailed in section 2.4). Each measurement was performed in triplicates.
2.3. Scanning transmission electron microscopy (STEM) imaging
A drop of the PLGA NPs at a concentration of 40 µg/mL was placed on a 200-mesh copper grid with holey carbon film. The images were taken using the ESEM mode of the ThermoFisher Scientific Quattro S microscope equipped with a field emission filament. The STEM3+ detector was used in the Bright Field detection mode with the acceleration voltage between 20 and 30 kV and a spot size between 2 and 4. The variable pressure between 200 and 750 Pa was used to cast the NP on to the grid and to minimise the beam damage to the sample.
2.4. HPLC methodology
Detection of STS was assessed using a reverse phase HPLC method adapted from previous studies [Citation31]. Briefly, a Shimadzu LC-2030C Plus RoHS – Prominence-I separation module HPLC with UV detection was utilised at an operating wavelength of 210 nm. A Phenomenex HyperClone™ column (5 µm C18 4.6 × 150 mm column) was used with a 10 μL sample injected at 27 °C. The mobile phase consisted of 0.005 M (1.698 g/L) tetrabutylammonium hydrogen sulphate dissolved in a solution of methanol-phosphate buffer (15:85). The phosphate buffer was 10 mM (136.086 g/mol therefore, 1.36 g/1L) potassium dihydrogen phosphate with a pH of 7.4. The flow rate was set at 1.0 mL/min with a 10 µL injection volume.
Stock solutions and standard solutions of STS were prepared with PBS ranging from 0.001 to 15 mg/mL. A final calibration curve with an R2 of 0.9868 and a linear equation of y =(4 × 10⁶) was obtained.
2.5. PLGA NP release study
The in vitro release of STS from PLGA NPs was evaluated in PBS at pH 7.4 and 4.5 (buffered with acetic acid). An amount of 10 mg of freeze-dried STS-loaded PLGA NPs were re-dispersed in 4 mL of buffer solutions at 37 °C. The release media was sampled with volume replacement (0.5 mL) predetermined time intervals (0, 1, 4, 12, 24, 48, 72, 168, 240 and 336 h) and, centrifuged to remove any NPs and quantified using HPLC-UV analysis as detailed in Section 2.4. Several kinetic drug release mathematical models were used to assess drug release from the formulations as described previously [Citation30]. Zero order, first order and Korsmeyer–Peppas release profiles were applied using Microsoft Excel® to confirm the appropriate release kinetics from each formulation following which regression analysis techniques were employed. The kinetic model exhibiting the highest R2 metric (≥0.95) was determined to be the mechanism by which release occurred.
2.6. Cellular toxicity of STS and STS-loaded PLGA NPs towards HEK293 cells
To assess the cytotoxicity of PLGA NPs alone, a 2,3-bis-(2-methoxy-4-nitro-5-sulfophenyl)-2H-tetrazolium-5-carboxanilide (XTT) assay was performed to measure cellular metabolic activity as an indicator of cell viability, proliferation and cytotoxicity after exposure of cells to PLGA NPs (both 15 s suspended in 0.3% PVA and 45 s suspended in 0.7% PVA) for 24 h. Human embryonic kidney cells (HEK293) were routinely cultured in DMEM supplemented with 10% FBS and 100 U/mL penicillin/streptomycin maintained at 37 °C and 5% CO2. Cells were plated in 96-well plates at density of 7.5 × 10³ cells/well and incubated overnight (37 °C, 5% CO2) to attach. Thereafter, media was removed and fresh media with 0.1–4 mg/mL PLGA NPs added and incubated for 24 h (37 °C, 5% CO2). XTT assay was performed as per manufacturer instructions. Briefly, 25 µL of 12.5:1 mixture of XTT to menadione was added to each well. Plates were subsequently incubated for 3 h at 37 °C and the absorbance read at 475 nm, the background absorbance read at 660 nm on a microplate reader. Each concentration of PLGA NPs was assayed in six wells and run in three independent experiments and results expressed as percentage cytotoxicity relative to a control.
Free H2S is a strong reducing agent able to react with the XTT, therefore, to determine the cytotoxicity profile of STS and STS loaded PLGA NPs, a LDH assay (LDH Cytotoxicity Kit II, Promocell, Germany) was performed to measure cell viability after exposure to increasing concentrations of STS and STS loaded PLGA NPs for 24 h. Cells were seeded at a density of 5 × 10⁴ cells/well into a 96-well plate and incubated overnight (37 °C, 5% CO2) to attach. Thereafter, media was removed and fresh media containing non-formulated STS or STS-loaded PLGA NPs added and incubated for 24 h (37 °C, 5% CO2). Following this, cell culture supernatant was collected and LDH assays were performed following manufacturer’s instructions. Briefly, 10 μL of collected cell supernatant were combined with 100 μL of LDH reaction mixture (WST-1 reagent and water) and incubated at room temperature for 30 min and the absorbance read at 450 nm, the background absorbance read at 650 nm on a Tecan plate reader. Experiments were performed three independent times and expressed as percentage of viability (Percentage of viability = cytotoxicity of control (100%) – cytotoxicity of sample).
2.7. Cellular STS internalisation determination following application of PLGA NP
Cellular uptake of formulations sonicated for either 15 and 45 s and suspended in a 0.3 or 0.7% v/v PVA solution, respectively, were evaluated against non-formulated STS in HEK293 cells after 2, 4 and 24 h. Cells were seeded into 48 well plates at 1 × 10⁵ cells/well. NPs were suspended in fresh media at 2 mg/mL and 400 µL added to each well. Media was replaced after 2 h for all cells. Following this, at the aforementioned time points, media was removed and cells lysed following the addition of 0.6 mM of octaethylene glycol monododecyl ether. The resultant cell lysate was centrifuged for 10 min at 16,000 RPM to pellet both cell lysate and PLGA NPs and analysed for STS content released from the NP into the cells using HPLC-UV detection as described in section ‘HPLC methodology’.
Furthermore, to visualise PLGA NPs cellular uptake, we formulated NP with the addition of 25 µL of the fluorescent probe DilC (1 mg/mL) to the PLGA soaked in DCM. Unentrapped DilC was removed during the NPs washing stage. HEK293 cell were plated in coverslips at a density of 5 × 10⁵ cells per coverslip. After 24 h, freeze dried DilC loaded PLGA NPs were suspended in media (1 mg/mL) and added to the coverslips and incubated for 24 h at 37 °C and 5% CO2 atmosphere. Thereafter, coverslips were washed with PBS and fixed with 4% w/v paraformaldehyde for 5 min at room temperature. Subsequently, coverslips were mounted onto glass slides with the addition of a DAPI-containing mounting media (SlowFade™ Diamond Antifade Mountant with DAPI; ThermoFisher Scientific, Waltham, MA). Coverslips were subsequently analysed, and images recorded at 60X using a Nikon Eclipse Ti-E inverted microscope.
2.8. H2S release from PLGA formulated and non-formulated STS
Free H2S is a strong reducing agent that reacts with the tetrazolium dye 3-(4,5-dimethyl-2-thiazolyl)-2,5-diphenyl-2H-tetrazolium bromide (MTT, Sigma, St. Louis, MO) and forms purple colour formazan [Citation32]. Therefore, to evaluate the release of H2S, HEK293 cells were exposed to formulated STS-loaded NPs or vehicle (containing 1 mg/mL STS). Following set exposure times, 100 μL of cell culture media was removed from cells and combined with 100 μL MTT (5 mg/mL) for 3 h. The reaction was carried out in a humidified incubator at 37 °C with 5% CO2 atmosphere to mirror the cell culture conditions and minimise evaporation. Changes in absorbance were recorded up to 24 h on a plate reader at 570 nm. A H2S calibration curve was created by preparing serial dilutions of freshly dissolved sodium sulphide (Na2S). The H2S generation is shown as hourly change in absorbance with respective H2S values.
2.9. Angiogenesis assay
To assess the pro-angiogenic potential of formulated and non-formulated STS, human umbilical vein endothelial cells (HUVECs) sourced by Promocell (Heidelberg, Germany), were suspended in standard endothelial cell growth media (EGM-2) and plated in growth factor reduced Matrigel (Corning, Flintshire, UK) -coated 96 well plates at a density of 1 × 10⁴ cells/well and let attach for 1 h. Following this, media was replaced with STS-loaded and empty PLGA NPs dissolved in fresh DMEM containing 0.5% FBS for 6 h. The formation of capillary-like structures was quantified by measuring the total tube length, total branching length and total segment length per well using a Nikon phase-contrast inverted microscope. Mean measurements were calculated using ImageJ angiogenesis tool from three independent experiments performed in duplicate.
2.10. Statistical analysis
Unless otherwise stated, all results are presented as mean ± standard deviation (SD). Replicates of at least three were used for all studies. T-test, one-way ANOVA or two-way ANOVA was used as appropriate to determine any statistically significant difference between means tested (p≤.05). A post-hoc Tukey’s multiple comparisons test was then applied to assess differences between groups. All the calculations were carried out using Graphpad 8 (GraphPad Inc., La Jolla, CA).
3. Results
3.1. Development and evaluation of STS loaded PLGA NPs formulations
This study proposed the development of a novel controlled-release PLGA NPs system to encapsulate STS with the aim of providing a slow and sustained release of H2S whilst exploring its potential to maintain the pro-angiogenic properties of H2S.
The formulation of water-soluble compounds such as STS into PLGA NPs requires two sonication steps, the first to create a water-in-oil emulsion (w/o), the second to create a water-in-oil-in-water emulsion (w/o/w) [Citation33]. Therefore, we varied the time-period of each sonication step to assess the impact on NPs characteristics. Increasing time on the first sonication step did not appear to affect particle size, polydispersity, zeta potential or entrapment efficiency (). Therefore, the duration for the first sonication step was fixed at 30 s for all further experimental work. The formation of NP’s and size was confirmed using STEM (). A spherical structure showing uniformity in size and shape was observed. As the length of the second sonication step increased from 15 to 45 s, a significant decrease in particle size was observed. For particles suspended in 0.3% w/v PVA, a significant decrease from 278.00 ± 9.60 to 226.45 ± 5.93 (p≤.0001) was observed. Similarly, for particles suspended in 0.7% w/v PVA, a significant decrease from 269.51 ± 9.96 to 217.66 ± 6.96 (p≤.0001) was observed. A statistically significant decrease in size of particles suspended in 0.7% w/v PVA compared with 0.3% w/v PVA was also observed when the second sonication step was 15 or 30 s in duration (p≤.05) ().
Figure 1. Increase in secondary sonication time as well as PVA concentration in the PLGA NPs formulation method improves NP characteristics. STS PLGA NPs were imaged (A) using Scanning transmission electron microscopy (STEM) in ESEM mode of the ThermoFisher Scientific Quattro S microscope equipped with a field emission filament. Scale bar = 1 μm. PLGA size distribution (B) and polydispersity (C) was determined by DLS and zeta potential (D) was determined by photon correlation spectroscopy using a Zetaplus, comparing PLGA NPs produced by varying formulation parameters. STS entrapment within the PLGA NPs was measured by HPLC-UV detection and expressed as a percentage (E). PLGA NPs were prepared by emulsification by sonication-solvent evaporation. STS was dispersed within the buffer (25 mg/80 µL). Data represents mean ± SD. n = 3 independent batches. **** indicates statistical comparison between the formulations with a p≤.0001. *** indicates statistical comparison between the formulations with a p≤.001. * indicates statistical comparison between the formulations with a p≤.05.
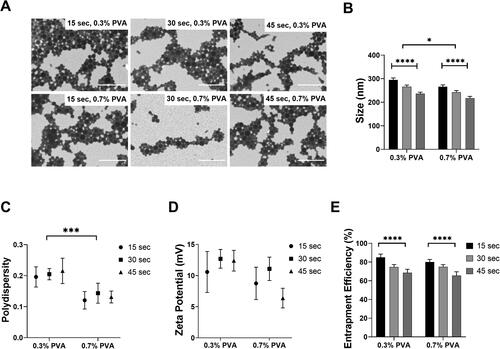
The duration of the second sonication step did not significantly affect the polydispersity of the formulations. Conversely, the concentration of PVA the final w/o/w particles were suspended in, did significantly affect the polydispersity. Compared to those suspended in 0.3% w/v PVA, w/o/w emulsion suspended in 0.7% w/v PVA showed a smaller polydispersity (p≤.001) (). Neither the length of the second sonication step nor the concentration of PVA, significantly affected the zeta potential of the NP. All NP formulated were slightly positive between 5 and 15 mV ().
Moreover, the increase from 15 to 45 s in the second sonication step led to a significant decrease in STS entrapment efficiency for the NP generated in either 0.3% w/v PVA (84.95 ± 3.50 vs. 68.55 ± 3.71, p≤.0001) or 0.7% w/v PVA (80.01 ± 2.97 vs. 65.58 ± 4.03, p≤.0001). Nonetheless, the concentration of PVA did not appear to affect the entrapment efficiency of STS ().
3.2. In vitro release of STS from formulations and drug release kinetics
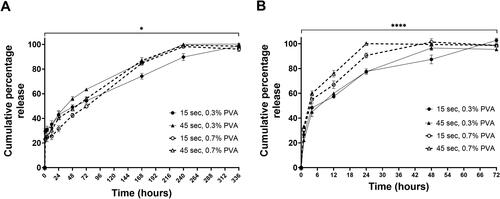
To investigate whether STS release was affected by the different characteristics of the NPs as shown in , namely particle size (affected by both sonication time and PVA concentration), and entrapment efficiency (affected by sonication time), we chose four formulations which ranged from either the largest NPs with highest STS entrapment efficiency of 84.95 ± 3.50% or the smallest NPs with lowest STS entrapment of 65.58 ± 4.03%, based on sonication time and PVA concentration, i.e. 15 s/0.3% w/v PVA, 45 s/0.3% w/v PVA, 15 s/0.7% w/v PVA and 45 s/0.7% w/v PVA. Furthermore, NP internalised via endocytosis are transported to endosomes and lysosomes [Citation34], the acidic compartments within the cell (i.e. endosomes with pH 5 and lysosomes with pH 4.0–5.0), from which drug release occurs [Citation35]. Therefore, in this study, the release of STS from the PLGA NPs was determined at both pH 7.4 and 4.5 simulating extracellular and lysosomal pH values. Our results show biphasic release profiles with the initial considerable ‘burst release’ effects () followed by sustained drug release. At pH 7.4, 100% STS release was achieved at day 14 in the 15 s/0.3% w/v PVA formulation, whereas in the 45 s/0.3% w/v PVA, 15 s/0.7% w/v PVA and 45 s/0.7% w/v PVA formulation, 100% release was observed between days 7 and 10 (). At pH 4.5, 100% release of STS was achieved faster across all formulations (48–72 h for 15 s/0.3% w/v PVA vs. 12 and 24 h for the 45 s/0.3% w/v PVA, 15 s/0.7% w/v PVA and 45 s/0.7% w/v PVA formulation) ().
Figure 2. Increase in sonication time as well as PVA concentration in the PLGA NPs formulation method increases the release rate of STS from PLGA NPs. STS release profiles from PLGA NPs in PBS (A) pH 7.4 over 336 h and (B) pH 4.5 over 72 h. PLGA NPs were prepared by the double emulsion method with STS dispersed within the buffer (25 mg/80 µL). Unencapsulated STS and surfactant was removed via centrifugation at 9500 for 10 min. Data represent mean ± SD. n = 3 independent batches. **** and * indicate statistical comparison of the kkp between the PLGA formulations with a p≤.0001 and p≤.05, respectively.
Kinetic drug release mathematical models were used in the evaluation of drug release from these formulations. The Korsmeyer–Peppas model best described release kinetics from all NPs formulations (highest R2 and lowest AIC). At pH 7.4, the rate constant as determined by the Korsmeyer–Peppas model showed a significant difference between the four NPs formulations (p≤.05) (). At pH 4.5, a greater statistical difference was observed between the formulations 45 s/0.7% w/v PVA formulation gave the fastest rate constant at 41.91 ± 1.51 compared with the 15 s/0.3% w/v PVA formulation at 28.22 ± 1.61 (p≤.0001) (). The value of diffusional exponent (n) is a parameter which specifies the drug release mechanism from polymeric dosage forms when more than one type of release phenomenon was involved. The diffusion release exponent values were all below 0.45 at either pH 7.4 or pH 4.5 ( and ) suggesting that the release of STS from these formulations followed Fickian diffusion mechanism (flux due to molecular diffusion and the concentration gradient) [Citation36].
Table 1. Increase in sonication time as well as PVA concentration in the PLGA NPs formulation method increases the kinetics of STS release into PBS at pH 7.4 from PLGA NPs.
Table 2. Increase in sonication time as well as PVA concentration in the PLGA NPs formulation method increases the kinetics of STS release into PBS at pH 4.5 from PLGA NPs.
3.3. Effects of PLGA NPs size on cell viability
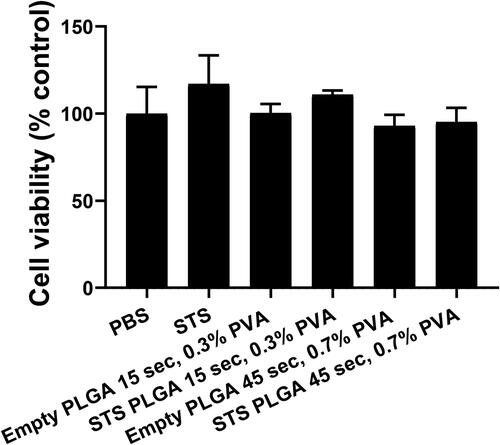
To assess the toxicity of the polymer alone and the effects of NPs size on cells viability, empty PLGA NPs with either 15 s sonication/0.3% w/v PVA () or 45 s sonication/0.7% w/v PVA () (selected based on the former producing the largest particle size and the latter giving the smallest) were formulated and applied to HEK293 cells for 24 h. Cellular metabolic activity was measured as an indicator of cell viability via an XTT assay (). No statistically significant difference was observed in cell viability (p≥.05) across the concentration range of 0.1–4 mg/mL PLGA NPs on HEK 293 cells, suggesting that at these concentrations these PLGA NPs are not toxic. Nonetheless, the XTT assay could not be used to assess the toxicity of STS loaded PLGA NPs on HEK293 cells as free H2S acts as a reducing agent for the XTT leading to high background absorbance readings. Therefore, to assess the effect of STS loaded PLGA NPs on cells viability, an LDH assay was performed. Both empty and STS loaded PLGA NPs formulated with either 15 s sonication/0.3% w/v PVA or 45 s sonication/0.7% w/v PVA were applied to HEK293 cells at a concentration of 2 mg/mL. No statistically significant difference was observed in cell viability across these formulations () (p≥.05) (). These results demonstrate that at these concentrations, neither empty nor STS-loaded PLGA NPs induced cytotoxic effects on HEK293 cells.
Figure 3. Effects of polymer and NP size on cell viability on HEK293 cells. (A) Cell viability of empty PLGA formulations sonicated for either (A) 15 s suspended in 0.3% PVA or (B) 45 s suspended in 0.7% PVA showed no effect on cell viability across a concentration range of 0.1–4 mg/mL of PLGA NP over 24 h. n = 3 independent batches.
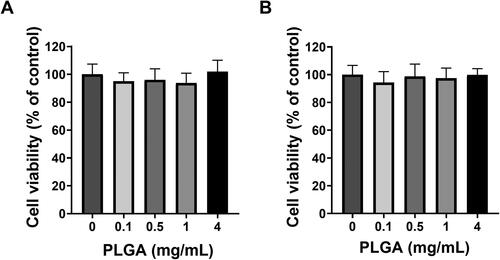
Figure 4. Cell viability on HEK293 cells following application of empty and STS PLGA NP assessed by LDH release. The percentage release of LDH (cytotoxicity) of each sample was subtracted from 100% viability of control (PBS) using the LDH cytotoxicity II kit (Promocell) using supernatant after 24 h of exposure. n = 3 independent batches.
3.4. Cellular uptake from formulated PLGA NPs
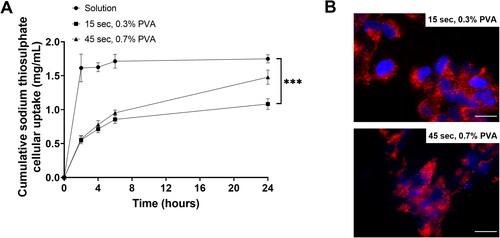
To investigate whether PLGA NPs is capable of controlling and slowing the release of STS within the cells, HEK293 cells were treated with non-encapsulated STS as well as PLGA encapsulated STS sonicated for either 15 or 45 s in 0.3 or 0.7% w/v PVA respectively (PLGA = 2 mg/mL), and STS was measured over the course of 24 h by HPLC-UV analysis (). At each time point, cells were lysed with octaethylene glycol monododecyl and centrifuged to pellet cell lysate and intact NPs. Thus, only STS release from NPs within the cells was detected. Our results showed that non-formulated STS diffused into equilibrium within 2 h of incubation in HEK293 cells and this effect was sustained over the course of 24 h (2 h= 1.61 ± 0.2 mg/mL and 24 h = 1.75 ± 0.6 mg/mL. However, cells treated with 15 s sonication/0.3% w/v PVA or 45 s sonication/0.7% w/v PVA PLGA NPs formulations, showed a gradual increase in the cellular levels of NPs released STS over time (). Interestingly, at 24 h timepoint, the levels of NPs released STS was approximately 40% higher (1.48 ± 0.1 mg/mL, p≤.01) in the cells treated with 45 s/0.7% w/v PVA formulation compared to 15 s/0.3% w/v formulation (1.08 ± 0.08 mg/mL). These results further confirmed that 45 s/0.7% w/v PVA formulation provided a faster STS release profile as opposed to the 15 s/0.3% w/v formulation which may provide a slower release effect. Furthermore, successful NPs uptake was confirmed by visualising DilC labelled PLGA NPs within HEK293 cells ().
Figure 5. PLGA formulation provided a slow and sustained cellular uptake of STS compared with non-formulated STS for HEK293 cells. (A) The cellular uptake and release from STS in media compared with a PLGA formulation sonicated for either 15 or 45 s, completed in a 0.3 or 0.7% v/v PVA solution, respectively. Formulation was applied to HEK293 cells and cell lysate was used to measure uptake after 2, 4 or 24 h exposure using HPLC-UV analysis. Data represent mean ± SD. n = 3 independent batches. *** indicates statistical comparison between the formulations with a p≤.001. (B) Cells were grown on the coverslips for 1 d. Cell nuclei were visualised using DAPI (Blue). PLGA NPs sonicated for either 15 or 45 s, completed in a 0.3 or 0.7% v/v PVA solution were formulated with DilC for visualisation. Scale bar = 50 μm.
3.5. H2S release from PLGA NPs encapsulated with STS
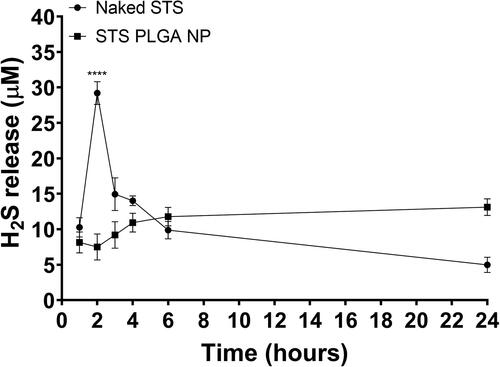
Having selected the 45 s/0.7% w/v PVA formulation owing to the smaller size of NPs produced, we investigated the potential of these NPs in controlling the release of the active gasotransmitter H2S. Levels of H2S in the conditioned media from HEK 293 cells stimulated with non-encapsulated or encapsulated STS were measured over the period of 24 h. Level of H2S in the non-encapsulated STS conditioned media peaked at 2 h followed by a sharp decline, whereas in the encapsulated STS conditioned media, the level of STS gradually increased and peaked at 24 h (). Furthermore, the concentration of H2S release from non-encapsulated STS at the peak was 29.20 ± 1.61 µM, significantly higher than that of the encapsulated STS at 13.11 ± 1.17 µM (p≤.0001), suggesting that maximum release of H2S occurs rapidly in non-formulated STS as opposed to its formulated counterpart.
Figure 6. PLGA formulation provided a slow and sustained cellular uptake of H2S from STS compared with non-formulated STS on HEK293 cells. Hourly H2S release values are plotted with curve-fitting results to highlight the donor compound decomposition. PLGA formulation selected was that with a second sonication time for 45 s, suspended in 0.7% PVA. n = 3 independent batches. **** indicates statistical comparison between the peak H2S release from both data sets with a p≤.0001.
3.6. Pro-angiogenic effect of STS-loaded PLGA NPs
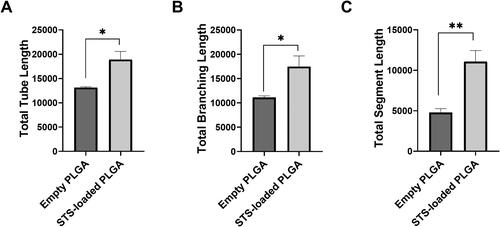
In order to explore the potential for the STS-loaded PLGA NPs to maintain H2S beneficial effects, we investigated the ability of the STS encapsulated in PLGA NPs to promote the formation of tube-like structures in HUVEC. Exposure to formulated STS in PLGA NPs significantly increased tubular network formation (p≤.01) in HUVEC cells demonstrated by enhanced total tube, total branching and total segment length (, respectively), suggesting that the formulation was able to retain H2S pro-angiogenic effects.
Figure 7. Formulation of STS into PLGA NPs sustained the pro-angiogenic effect of H2S. Tube formation was quantified by determining the lengths of tubes, total branching and segment lengths using image J angiogenesis tool. Results are representative of three independent experiments (mean ± SEM). n = 3 independent batches. * indicates statistical comparison between the formulations with a p≤.05. * indicates statistical comparison between the formulations with a p≤.01.
4. Discussion
H2S has a crucial role in the vascular system involving its functions in the regulation of energy production, anti-oxidative and anti-inflammatory processes. Evidence has shown H2S donors such as STS have potential cardioprotective effects as well as for the treatment of cardiovascular conditions due to its ability to decrease inflammatory response and exert vasorelaxant effect in various vascular tissues [Citation5,Citation37,Citation38]. However, there are many delivery challenges associated with H2S donors, including their rapid release rates of H2S, the gaseous nature of H2S and potential toxicity when present in excess [Citation39]. These difficulties have limited their clinical potential. Therefore, to explore the translation and potential therapeutic applications of H2S donors to the clinical setting, we endeavoured to design, characterise and screen an efficient method to deliver this gasotransmitter at a controlled rate enough to maintain a low sustained level of H2S. To this end, we proposed a drug delivery system based on PLGA NPs as evidence has shown PLGA NPs may provide many advantages, including increased efficacy and longer circulation times, and the potential for targeted or stimuli triggered delivery [Citation40,Citation41].
To ensure reproducible drug delivery rates, several NPs characteristics such as size distribution, polydispersity, charge and drug entrapment efficiency are critical in determining their application for drug delivery [Citation42]. In our study, we focused on investigating the effects of duration of the second sonication step due to this being the step in which the water-in-oil-in-water emulsion was formed [Citation43]. The effect of increasing ultrasonication time on STS loaded PLGA NPs caused a decrease in mean particle size, this effect might be related to an increased disintegration of droplets due to the longer emulsification process [Citation43]. In this regard, others have investigated the effect of second sonication time on the characteristics of BSA encapsulated in PLGA NPs emulsified in PVA 1% w/v. Similar to our results, this study observed a reduction in NPs size [Citation43]. Moreover, an increase in sonication time caused a decrease in STS entrapment efficiency perhaps owing to the stronger breakdown of the water in oil droplets allowing STS to escape into the external aqueous phase. Other groups encapsulating BSA within PLGA also observed a similar effect, however, they also observed an increase in PLGA concentration was able to mitigate this drawback owing to the higher encapsulation capacity of the PLGA matrix [Citation43]. Due to our results showing no cellular toxicity induced by increased PLGA concentrations, further studies are required to explore the potential link between increased PLGA concentration and enhanced STS entrapment.
Further exploration of our NPs design showed that as the PVA concentration is increased from 0.3% to 0.7%, the mean diameter of NPs as well as polydispersity decreased indicative of a more homogenous formulation. The presence of surfactant molecules stabilises the emulsion nanodroplets and prevents them from coalescing with each other. For effective stabilisation, surfactant molecules must cover the organic/aqueous interfacial area of all droplets. Thus a minimum number of surfactant molecules are required to achieve small particle size and a narrow size distribution [Citation24]. Buhdian et al. exploring haloperidol loaded PLGA NPs also noted a decrease in NP size associated to an increase in PVA concentration. They showed that increasing PVA concentration the NPs were suspended in also produced smaller particles. Furthermore, in our study, the PVA concentration did not appear to affect the ZP or EE of the NP produced.
Drug release from a PLGA matrix is a result of desorption, surface diffusion, bulk diffusion, and hydrolytic erosion/degradation of the matrix. Degradation of PLGA is a two-step process [Citation41,Citation44]. The first step is the autocatalytic hydrolysis involving scission in the polymer backbone leading to the formation of more water-soluble oligomers/monomers thus allowing pore formation in the polymeric matrix [Citation44,Citation45]. The second step is the subsequent hydration of the water-soluble oligomers/monomers. The particle size and weight eventually decrease. The kinetics of this process rests on the chemical structure, crystallinity and molecular mass of the polymer, as well as on the size and shape of the particle and the chemical structure of the encapsulated compound. The faster drug release observed within the first 12 h suggest that the release profile in the first h of incubation is probably determined by solubilisation/desorption of STS stuck on the outside of the NPs. In contrast, during the later phases of PLGA degradation the drug release is mediated by both diffusion and degradation processes. A similar profile was observed in a study encapsulating doxorubicin in PLGA NPs [Citation46]. Furthermore, compared to the 15 s/0.3% w/v PVA NP formulation, the 45 s/0.7% w/v PVA NPs formulation were smaller in size. Therefore, per unit mass of NPs, smaller NPs have a greater surface area in touch with the release media from which STS could diffuse out as well as polymer allowing degradation to begin. Finally, based on the in vitro release profile, the release of STS from PLGA NPs was pH dependant being slower at pH 7.4 compared to pH 4.5. It might be expected that the slower release rate at pH 7.4 indicates that the nanoparticulate formulations are able to deliver drug in a controlled manner over an extended period. However, once up taken into cells and in the lysosomal department STS may be released faster from NPs. Other compounds, for example doxorubicin, formulated in PLGA NPs also observed pH dependant release with a faster release at acidic pH environments [Citation46].
The drug release mechanism from NPs matrix was determined to be the Korsmeyer–Peppas model with the calculated n values suggesting a Fickian release (diffusion-controlled release) which occurred through the molecular diffusion of the drug based on the chemical potential gradient. Similar results were observed with PLGA NPs carrying indomethacin. In fact, this group observed the Weibull and Korsmeyer-Peppas models to have the best fit (R2=0.99 and 0.96) with the n value suggesting a Fickian type release pattern [Citation47].
To yield sustained intracellular delivery, PLGA NPs have to be internalised into the cells followed by the controlled release of STS due to degradation of the particles. We observed NPs were rapidly internalised, within 2 h, into the HEK293 cells. Similar studies encapsulating doxorubicin in PLGA NPs [Citation46] also observed a rapid cellular uptake, within 1 h, and further established uptake into lysosomes. We also observed a faster rate of STS release from NPs within the cells from the smaller NPs formulated (45 s/0.7% w/v PVA NP formulation). This followed the in vitro release study into buffer and maybe due to a greater surface area in touch with the release media from which STS could diffuse out from as well as allowing the degradation of polymer. Compared with the STS solution, both NPs observed >50% STS uptaken and released into the cells closer in pattern with the in vitro release in PBS at pH 4.5. This implies uptake into the lysosomes and release from this cellular compartment. The PLGA NPs could escape from secondary endosomes and lysosomes into the cytosol because of the NPs surface charge inversion due to PLGA protonation in the acidic endo-lysosomal environment. This inversion enables the interaction between the NPs surface and the endosomal membranes resulting in the subsequent localised destabilisation of the endo-lysosomal membrane [Citation48]. Further studies are required to determine STS rate of release specifically from endosomes/lysozymes.
Critically, we observed the controlled release of H2S from STS encapsulated PLGA NPs (45 s/0.7% w/v PVA NP) compared with non-formulated STS suggesting the PLGA polymer H2S was able to entrap STS and delay its release thus delaying the generation of H2S. This is crucial in the delivery of donors. Clinical trials observing the safety and tolerability of STS, specifically administered for its H2S donor properties in patients with an acute coronary syndrome undergoing coronary angiography have observed dosages of STS up to 2 × 15 g, 6 h apart, are well tolerated. Knowing our controlled release formulation was still able to maintain STS cellular response, it could potentially reduce STS dosing thereby reducing costly frequent intervention with the patient. Importantly, our studies were limited to an in vitro setting. The formation of protein corona around NPs in vivo is known to affect drug release [Citation49,Citation50] thus further work exploring the controlled release potential of PLGA NPs in vivo would be useful to ascertain the release profiles of both STS and H2S from the NPs.
5. Conclusion
PLGA NPs are a promising controlled release delivery system in the treatment of various cardiovascular conditions with the potential to offer sustained H2S levels in the circulation, thus reduce dose frequency. The results of this study demonstrate that STS-loaded PLGA NPs successfully provide a controlled release of STS. An increase in sonication time as well as PVA concentration decreased NPs size resulting in an increase in STS release kinetics and cellular uptake over 24 h. Furthermore, NPs are internalised into cells and critically, PLGA NPs are able to control the release of H2S from the STS and did not inhibit the angiogenic potential of H2S. Therefore, the development of PLGA NPs in the controlled release of H2S from STS could potentially reduce drug dose frequency and maintain therapeutic concentrations of H2S for longer periods of time.
MM and LSA conceived the study and secured funding. MM, SS, HS, JS and LSA performed experiments. MM, SS, LSA and HS drafted the manuscript. MM, LSA, KW, and SA edited the manuscript.
Supplemental Material
Download TIFF Image (618.9 KB)Disclosure statement
Authors declare no conflict of interest.
Additional information
Funding
References
- Lowicka E, Beltowski J. Hydrogen sulfide (H2S) - the third gas of interest for pharmacologists. Pharmacol Rep. 2007;59(1):4–24.
- Wang MJ, Cai WJ, Zhu YC. Hydrogen sulphide in cardiovascular system: a Cascade from interaction between sulphur atoms and signalling molecules. Life Sci. 2016;153:188–197.
- Polhemus DJ, Li Z, Pattillo CB, et al. A novel hydrogen sulfide prodrug, SG1002, promotes hydrogen sulfide and nitric oxide bioavailability in heart failure patients. Cardiovasc Ther. 2015;33(4):216–226.
- Pan LL, Qin M, Liu XH, et al. The role of hydrogen sulfide on cardiovascular homeostasis: an overview with update on immunomodulation. Front Pharmacol. 2017;8:686.
- Polhemus DJ, Calvert JW, Butler J, et al. The cardioprotective actions of hydrogen sulfide in acute myocardial infarction and heart failure. Scientifica (Cairo). 2014;2014:768607.
- Distrutti E, Sediari L, Mencarelli A, et al. Evidence that hydrogen sulfide exerts antinociceptive effects in the gastrointestinal tract by activating KATP channels. J Pharmacol Exp Ther. 2006;316(1):325–335.
- Paquette JM, Rufiange M, Iovu Niculita M, et al. Safety, tolerability and pharmacokinetics of trimebutine 3-thiocarbamoylbenzenesulfonate (GIC-1001) in a randomized phase I integrated design study: single and multiple ascending doses and effect of food in healthy volunteers. Clin Ther. 2014;36(11):1650–1664.
- Li L, Rose P, Moore PK. Hydrogen sulfide and cell signaling. Annu Rev Pharmacol Toxicol. 2011;51:169–187.
- Olson KR, DeLeon ER, Gao Y, et al. Thiosulfate: a readily accessible source of hydrogen sulfide in oxygen sensing. Am J Physiol Regul Integr Comp Physiol. 2013;305(6):R592–R603.
- de Koning M-S, Assa S, Maagdenberg CG, et al. Safety and tolerability of sodium thiosulfate in patients with an acute coronary syndrome undergoing coronary angiography: a Dose-Escalation safety pilot study (SAFE-ACS)). J Interv Cardiol. 2020;2020:6014915–6014915.
- Elrod JW, Calvert JW, Morrison J, et al. Hydrogen sulfide attenuates myocardial ischemia-reperfusion injury by preservation of mitochondrial function. Proc Natl Acad Sci USA. 2007;104(39):15560–15565.
- Li HZ, Sun WM, Li LN, et al. Exogenous H_2S contributes to recovery of ischemic post-conditioning-induced cardioprotection in the aging rat hearts and cardiomyocytes. 2016;8:2–11.
- Kondo K, Bhushan S, King AL, et al. H2S protects against pressure overload-induced heart failure via upregulation of endothelial nitric oxide synthase. Circulation. 2013;127(10):1116–1127.
- Pan LL, Liu XH, Shen YQ, et al. Inhibition of NADPH oxidase 4-related signaling by sodium hydrosulfide attenuates myocardial fibrotic response. Int J Cardiol. 2013;168(4):3770–3778.
- Nevozhay D, Kańska U, Budzyńska R, et al. [Current status of research on conjugates and related drug delivery systems in the treatment of cancer and other diseases]. Postepy Hig Med Dosw (Online). 2007;61:350–360.
- Cheng J, Teply BA, Sherifi I, et al. Formulation of functionalized PLGA-PEG nanoparticles for in vivo targeted drug delivery. Biomaterials. 2007;28(5):869–876.
- Allen TM, Cullis PRJS. Drug delivery systems: entering the mainstream. Science. 2004;303(5665):1818–1822.
- Lavan DA, McGuire T, Langer RJNB. Small-scale systems for in vivo drug delivery. Nat Biotechnol. 2003;21(10):1184–1191.
- Brigger I, Dubernet C, Couvreur P. Nanoparticles in cancer therapy and diagnosis. Adv Drug Delivery Rev. 2012;64:24–36.
- Avgoustakis K. Pegylated poly(lactide) and poly(lactide-co-glycolide) nanoparticles: preparation, properties and possible applications in drug delivery. Curr Drug Deliv. 2004;1(4):321–333.
- Kumari A, Yadav SK, Yadav SC. Biodegradable polymeric nanoparticles based drug delivery systems. Colloids Surf B Biointerfaces. 2010;75(1):1–18.
- Mu L, Feng SS. A novel controlled release formulation for the anticancer drug paclitaxel (taxol®): PLGA nanoparticles containing vitamin E TPGS. J Controlled Release. 2003;86(1):33–48.
- Jain RA. The manufacturing techniques of various drug loaded biodegradable poly(lactide-co-glycolide) (PLGA) devices. Biomaterials. 2000;21(23):2475–2490.
- Budhian A, Siegel SJ, Winey KI. Haloperidol-loaded PLGA nanoparticles: systematic study of particle size and drug content. Int J Pharm. 2007;336(2):367–375.
- Ali H, Opere C, Singh S. In vitro-controlled release delivery system for hydrogen sulfide donor. AAPS PharmSciTech. 2014;15(4):910–919.
- Lee J, Yang C, Ahn S, et al. Enhanced NO-induced angiogenesis via NO/H2S co-delivery from self-assembled nanoparticles [10.1039/D1BM00448D]. Biomater Sci. 2021;9(15):5150–5159.
- Sun X, Wang Y, Wen S, et al. Novel controlled and targeted releasing hydrogen sulfide system exerts combinational cerebral and myocardial protection after cardiac arrest. J Nanobiotechnol. 2021;19(1):40.
- Govender T, Stolnik S, Garnett MC, et al. PLGA nanoparticles prepared by nanoprecipitation: drug loading and release studies of a water soluble drug. J Control Release. 1999;57(2):171–185.
- Malik S, Lim J, Slack FJ, et al. Next generation miRNA inhibition using short anti-seed PNAs encapsulated in PLGA nanoparticles. J Control Release. 2020;327:406–419.
- Marwah M, Badhan RKS, Lowry D. Development of a novel polymer-based carrier for deformable liposomes for the controlled dermal delivery of naringenin. J Liposome Res. 2021;1–14.
- Schulz LT, Elder EJ, Jones KJ, et al. Stability of sodium nitroprusside and sodium thiosulfate 1:10 intravenous Admixture. Hosp Pharm. 2010;45(10):779–784.
- Gerő D, Torregrossa R, Perry A, et al. The novel mitochondria-targeted hydrogen sulfide (H2S) donors AP123 and AP39 protect against hyperglycemic injury in microvascular endothelial cells in vitro . Pharmacol Res. 2016;113(Pt A):186–198.
- Malik S, Slack FJ, Bahal R. Formulation of PLGA nanoparticles containing short cationic peptide nucleic acids. MethodsX. 2020;7:101115.
- Hillaireau H, Couvreur P. Nanocarriers’ entry into the cell: relevance to drug delivery. Cell Mol Life Sci. 2009;66(17):2873–2896.
- Fehrenbacher N, Jäättelä M. Lysosomes as targets for cancer therapy. Cancer Res. 2005;65(8):2993–2995.
- Peppas NA, Sahlin JJ. A simple equation for the description of solute release. III. Coupling of diffusion and relaxation. Int J Pharm. 1989;57(2):169–172.
- Liu YH, Lu M, Hu LF, et al. Hydrogen sulfide in the mammalian cardiovascular system. Antioxid Redox Signal. 2012;17(1):141–185.
- Qipshidze N, Metreveli N, Mishra PK, et al. Hydrogen sulfide mitigates cardiac remodeling during myocardial infarction via improvement of angiogenesis. Int J Biol Sci. 2012;8(4):430–441.
- Kasparek MS, Linden DR, Kreis ME, et al. Gasotransmitters in the gastrointestinal tract. Surgery. 2008;143(4):455–459.
- Kapoor DN, Bhatia A, Kaur R, et al. PLGA: a unique polymer for drug delivery. Ther Deliv. 2015;6(1):41–58.
- Makadia HK, Siegel SJ. Poly lactic-co-Glycolic acid (PLGA) as biodegradable controlled drug delivery Carrier. Polymers (Basel). 2011;3(3):1377–1397.
- Sadtler V, Rondon-Gonzalez M, Acrement A, et al. PEO-Covered nanoparticles by emulsion inversion point (EIP) method. Macromol Rapid Commun. 2010;31(11):998–1002.
- Feczkó T, Tóth J, Dósa G, et al. Influence of process conditions on the mean size of PLGA nanoparticles. Chem Eng Process. 2011;50(8):846–853.
- Mohammad AK, Reineke JJ. Quantitative detection of PLGA nanoparticle degradation in tissues following intravenous administration. Mol Pharm. 2013;10(6):2183–2189.
- Birnbaum DT, Brannon-Peppas L. Molecular weight distribution changes during degradation and release of PLGA nanoparticles containing epirubicin HCl. J Biomater Sci Polym Ed. 2003;14(1):87–102.
- Malinovskaya Y, Melnikov P, Baklaushev V, et al. Delivery of doxorubicin-loaded PLGA nanoparticles into U87 human glioblastoma cells. Int J Pharm. 2017;524(1–2):77–90.
- Ghitman J, Stan R, Ghebaur A, et al. Novel PEG-Modified hybrid PLGA-Vegetable oils nanostructured carriers for improving performances of indomethacin delivery. Polymers. 2018;10(6):579.
- Panyam J, Zhou W-Z, Prabha S, et al. Rapid endo-lysosomal escape of poly(DL-lactide-coglycolide) nanoparticles: implications for drug and gene delivery. FASEB J. 2002;16(10):1217–1226.
- Behzadi S, Serpooshan V, Sakhtianchi R, et al. Protein corona change the drug release profile of nanocarriers: the “overlooked” factor at the nanobio interface. Colloids Surf B Biointerfaces. 2014;123:143–149.
- Obst K, Yealland G, Balzus B, et al. Protein corona formation on colloidal polymeric nanoparticles and polymeric nanogels: impact on cellular uptake, toxicity, immunogenicity, and drug release properties. Biomacromolecules. 2017;18(6):1762–1771.