
 ?Mathematical formulae have been encoded as MathML and are displayed in this HTML version using MathJax in order to improve their display. Uncheck the box to turn MathJax off. This feature requires Javascript. Click on a formula to zoom.
Abstract
Drug nanofibers play a crucial role in ameliorating therapeutic effects, reducing toxicity, and increasing the bioavailability of drugs. This study was aimed at the fabrication of isotretinoin-loaded MMT-reinforced bi-polymeric (PAN/PU) nanofibers with varying concentrations of isotretinoin. In this study, montmorillonite (MMT)-reinforced cross-linked polyacrylonitrile and pullulan nanofibers combined with varying amounts of isotretinoin were fabricated through an electrospinning approach and investigated for their drug permeation potential. PAN-PU nanofibers were successfully integrated with the isotretinoin. The incorporation of isotretinoin into the nanofibrous structure was confirmed by FTIR and XRD. TGA study indicated the stability of the fabricated nanoparticles. The SEM results showed the beaded and smooth morphology of nanofibers. Formulation with a higher drug concentration had a non-significantly (p > 0.05) higher swelling ratio. Drug-loaded polymeric nanofiber erodes at a slower rate as compared to drug-free nanofibers. The ex-vivo permeation study of nanofibers revealed that the drug was not released all at once, but rather gradually and consistently over the period of 24 h, indicating a controlled release of the drug. In addition, the drug concentration in the nanofibers affected the permeation of the drug. According to the findings, isotretinoin-loaded MMT-reinforced bi-polymeric (PAN/PU) nanofibers with varying concentrations of isotretinoin were successfully fabricated. The fabricated nanofibers (PAN/PU) showed a promising potential for controlled permeation of drugs through rabbit skin.
1. Introduction
Electrospinning is a simple, flexible, and cost-effective method to fabricate nanofibers from a wide variety of materials, including polymers, metal oxide, ceramics, and composites. During the electrospinning process, the solution is spun under the application of an electric field to produce its fibres [Citation1]. Nanofibers are two-dimensional nanostructures with a high surface area-to-volume ratio and tunable porosity. Since nanofibers may be made from materials such as synthetic and natural polymers, proteins, composites, and inorganic nanomaterials, they are a durable and appealing option for many sophisticated biomedical applications [Citation2,Citation3], due to their tremendous porosity, superior mechanical properties, simplicity of surface functionalization, high drug loading capacity, and controlled drug release [Citation4].
The nanoscale structure and topography of fibres aid cell growth, adhesion, and differentiation. The high surface area of nanofibers allows better cell contact, which is favourable to cell adhesion. Nanofibers with high porosity and pore connection are also beneficial for the transport of nutrients and gases during the healing process. The small size of the pores helps to prevent bacterial infiltration and accelerate the wound healing process. Tissue engineering of bioactive compounds can be accomplished through electrospinning with polymers to achieve a range of activities. Nanofibers have a high drug-loading capacity due to their large surface area, which speeds up wound healing [Citation5].
For biomedical studies such as cancer therapies and drug delivery, polymeric nanofibers (NFs) have demonstrated a significant potential to synthesise anticancer products. According to WHO (World Health Organization) estimates, cancer killed 9.6 million people globally in 2018, making it one of the leading causes of death [Citation6]. The problem in enhancing medications’ ability to correctly target tumour cells (thus reducing their toxicity in healthy cells) is drastically hampering the advancement of cancer chemotherapeutic therapy [Citation7]. Nanotechnology-enabled localised cancer chemotherapy has demonstrated promising results in terms of targeted and regulated drug release of anticancer drugs throughout time in order to eliminate local or regional relapse of malignancies and improve tissue regeneration following treatment. Efficient drug delivery systems based on electrospun nanofibers have now been identified as a promising cancer treatment technique [Citation8]. Electrospun surface functionalization of nanofibrous mats can be used to change the physical and chemical properties of the fibre surface, as well as change the morphology of the fibres to achieve desired mechanical qualities [Citation9].
Several natural and man-made materials, as well as a precise mix of various polymers, are used in the electrospinning of nanofiber-based drug carriers for targeted cancer therapy. PVA (polyvinyl alcohol), polyethylene, PLA [poly(lactic acid)], poly(ethylene oxide), and copolymers such as PLGA [poly(lactide-o-glycolic acid)] and PCL [poly(caprolactone)] have been thoroughly investigated to produce nanofibers with favourable features for drug administration in medical approaches to heal tissue defects [Citation10].
In this study, nanofibers were fabricated from polyacrylonitrile (PAN), pullulan (PU), and montmorillonite (MMT), and isotretinoin. Polyacrylonitrile is an attractive polymer for electrospinning as its fibres are easily fabricated [Citation11–16]. Polyacrylonitrile nanofibers possess remarkable thermal, mechanical and solvent resistance properties [Citation17]. Pullulan is a linear maltotriose unit-based polymer that is produced by the polymorphic fungus, Aureobasidium pullulans. Pullulan has high water solubility and flexibility and is being studied for a number of applications, notably in biomedicine, due to its biocompatibility [Citation18]. MMT is a type of nanoclays, which are layered silicate nanoparticles. MMT is made up of two layers of 2:1 aluminosilicate, with one octahedral layer sandwiched between two tetrahedral layers. To create a stalk, the layers are connected by weak Van der Waals forces. Polymer molecules can easily be introduced between layers due to weak bonding [Citation19,Citation20]. Isotretinoin is the oral derivate of vitamin A. The IUPAC name of isotretinoin is 13-cis-retinoic acid. It is used to cure several skin diseases e.g. acne vulgaris and skin cancer. Isotretinoin is not an antibiotic, but it is widely used against skin-related disorders [Citation21,Citation22].
The aim of the study was to fabricate isotretinoin-loaded MMT-reinforced bi-polymeric (PAN/PU) nanofibers and to study their pharmaceutical properties along with their transdermal drug permeation potential.
2. Materials and methods
2.1. Materials
Polyacrylonitrile (MW = 150,000 g/mol), pullulan (MW = 10,000 g/mol) and MMT were purchased from Sigma-Aldrich (Inc. St. Louis, MO, USA). Isotretinoin (Saffron Pharmaceuticals, Faisalabad, Pakistan) was used as a model drug. Dimethyl formamide (DMF) of analytical grade was purchased from Lab-Scan.
2.2. Preparation of solution for electrospinning process
Briefly, PAN solution (12% w/v) was prepared by dissolving 1.2 g of PAN in 10 ml of DMF and stirred at 1000 rpm using a magnetic stirrer for 24 h at room temperature [Citation23]. Pullulan solution (12% w/v) was prepared by dissolving 1.2 g of pullulan in 10 ml of DMF. After that, the mixture was stirred at 600 rpm for 30 min using a magnetic stirrer at room temperature [Citation24]. After dissolving PAN and PU in DMF, the two solutions were combined and placed on a heated plate for 2 h at 40 with a 500-rpm stirring rate to achieve a clear homogenous polymer solution. Afterward, 1% (0.024 g) nanoclay solution was made by dissolving 0.024 g of nanoclay in 1 mL of DMF, and the mixture was shaken for 1–2 min. To fabricate the composite solution, it was added to a cross-linked PAN and PU solution and stirred constantly at 40
for 2 h. After that, the solution was left at room temperature to return to its original state. When the composite solution got to room temperature, the drug was added, and the solution was placed on a magnetic stirrer at a temperature of 25 °C with stirring at 700 rpm [Citation25]. Four different formulations were prepared by varying the amount of drug in solution ().
Table 1. Study design showing formulations having 12% polymeric solution, 1% MMT & varying drug amount.
2.3. Fabrication of drug loaded nanocomposite blends
The prepared solution was injected by using a 5 mL electrospinning machine syringe (Benson & Dickinson, USA). All the process parameters were set to their ideal values and remained constant throughout the operation. A FLUIDNA TEK LE-10 electrospinning machine was used to electrospun the solution. The diameter of needle was 12.45 m. The spinneret-to-collector distance was held constant at 18.5 cm, while the applied voltage was varied from 10 to 13.5 kV and the flow rate values were varied and set as 350 µL/h, 400 L/h, and 450 L/h during the experiment. The solution became charged as the voltage was increased, and the Taylor cone emerged, signalling the commencement of the electrospinning process. On the collection plate, the electrospun fluid was collected as fibres (). To cover the collecting plate, aluminum foil was employed. Aluminum foil was used to collect the fibres in the shape of a membrane (). Under the identical electrospinning circumstances, all four formulations were electrospun [Citation26].
Figure 1. Anti-cancer drug loaded polymeric nanofibers.
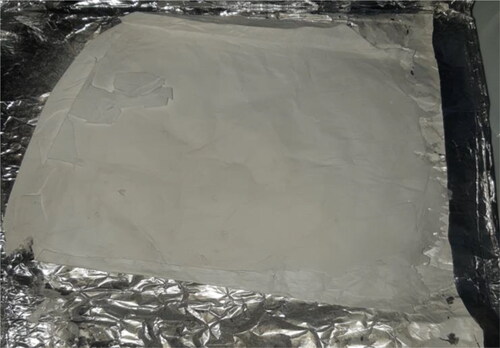
Table 2. Parameters of Electrospinning.
2.4. Chemical characterisation of nanofibers
2.4.1. Fourier transform infrared (FTIR) spectroscopy
In FT-IR spectroscopy, vibrations specific to each chemical bond determine the presence of functional groups in a sample. Vibrational transitions occur when infrared radiation passes through a sample. When the frequency of IR radiation matches the natural frequency of the bond, the spectrum is recorded, and absorption of IR radiation occurs. The vibrational frequency of each bond is different. FT-IR was used to determine the bonding type. The FTIR-66 type A spectra of electrospun polymeric NFs were recorded in the range of 3700–499 cm−1 to explore the interaction and intermolecular bonding between molecules of nanocomposite present in nanofibers.
2.4.2. Scanning electron microscopy (SEM)
The morphology and structure of electrospun nanofibers (F1 formulation) were studied using Joel, JSM 6400 F. When a highly focussed electron beam collides with the surface of material, it produces signals. These signals give information about the morphology, surface and shape of the nanofibers.
2.4.3. Thermogravimetric analysis (TGA)
Using the SDT Q600 TGA, the thermal stability of electrospun nanofibrous membranes (F1, F2, F3, and F4) was examined. In a nitrogen atmosphere, the samples were placed in an analytical pan at a constant flow rate of 20 mL/min. Accurately weighed 0.22 mg of material was heated in an alumina pan at a rate of 10 °C per minute from 20 °C to 700 °C. The weight loss and temperature were continuously recorded. The TGA analysis of these samples demonstrated that each temperature range had its own weight loss zone.
2.4.4. X-ray diffraction (XRD) spectroscopy
Material structural analysis was done by using XRD technique. It identifies whether electrospun nanofibers are crystalline or amorphous in nature. The Bruker D8 was used to explore the structural changes in nanofibers as a result of drug inclusion.
2.5. Pharmaceutical studies
2.5.1. Solubility studies
The solubility of isotretinoin was tested in a variety of solvent systems comprising distilled water and an organic solvent, such as DMSO, DMF, ethanol, or methanol. Briefly, a known amount of isotretinoin was mixed with a known volume (10 mL) of different solvent systems. These solutions were agitated for 1 h at 37 and centrifuged at 4000 rpm to remove excess isotretinoin. The supernatant layers of these solutions were filtered after centrifugation to obtain a clear solution, afterward it was diluted with the relevant solvent. With their respective solvents serving as a blank, the concentration of isotretinoin was determined using a UV-Vis spectrophotometer at wavelength 349 nm.
2.5.2. Calibration curve
Calibration curve is used to measure the drug concentration in an unknown sample by comparing it to a series of known concentrations (standard samples). Briefly, 100 mg of isotretinoin was dissolved in 100 mL of the selected solvent (7.5:2.5 of distilled water:ethanol, respectively). Six further dilutions were prepared using this stock solution with concentrations ranging from 0.1 to 0.6 µg/mL. The absorbance of the prepared dilutions was measured at 349 nm [Citation27] using the blank solvent (7.5:2.5 distilled water and ethanol) as a blank for the UV-Vis spectrophotometric test.
2.5.3. Swelling ratio
The water absorption capacity is measured by the swelling ratio. The dry fibres recovered from each solution was weighed first. Each recipe yielded 15 mg of fibre. All 15 mg films were swollen for about an hour in a petri-plate with 5 mL distilled water. The films were removed from the petri-dish after one hour and blotted with filter paper to remove any excess water before being weighed. After an interval of 15, 30, and 60 min, the swelling ratio was measured. The following formula was used to calculate the equilibrium swelling ratio:
where SR is swelling ratio, WS is swollen weight of films, and Wd is dry weight (
15 mg) of films. All of the experiments were done in triplicate, and the average value is displayed in the graph.
2.5.4. Erosion studies
Following the completion of the swelling tests, the wet samples were allowed to dry completely in the open air before being weighed at various intervals until a constant weight was achieved. The experiment was repeated three times. Film erosion was investigated using the formula below:
where Wₒ is initial weight of wet swollen films and Wf is final dry weight.
2.5.5. In-vitro skin permeation study
The Franz diffusion cell was used to study the permeation of isotretinoin-loaded nanofibers through rabbit skin [Citation28].
2.5.5.1. Preparation of rabbit skin
The skin of a rabbit was taken from the animal house of the Pharmacy Department at CUI Lahore. After the animal was killed, the skin was shaved (with an electric clipper). To prevent damage of the epidermal surface, the skin was peeled from the abdomen region of a dead rabbit, and the subcutaneous fat and other extraneous tissues were removed with scissors. Finally, the shaved skin was cleaned with distilled water and frozen in a petri plate at 4 °C until needed [Citation29].
2.5.5.2. Franz diffusion cell
The Franz diffusion cell is divided into two sections, i.e. the donor compartment and the receptor compartment. The prepared rabbit skin was placed between the donor part and the receptor portion’s O-ring, with the dorsal section facing the donor compartment and the dermal side facing the receptor compartment (receptor compartment). The two sections were held together by clamps. A 5 mL solution was added to the receptor side of the Franz cell containing the selected solvent (7.5:2.5 distilled water and ethanol, respectively). The temperature was kept constant at 37 [Citation30] by placing the cell on a magnetic stirrer. A magnetic stirrer was used to continuously mix up the diffusion medium in the receptor compartment in order to hydrate the rabbit skin. The stirring speed was maintained at 600 rpm [Citation31].
For the first 30 min, the receptor chamber was filled with a fresh mixture of a 5 mL solution of (7.5:2.5 distilled water and ethanol, respectively) to hydrate the skin. Isotretinoin was dissolved with ethanol. After that, a thin film of nanofiber sample (weighing 0.3 mg) was applied to the skin’s dorsal surface. Magnetic stirring bars were used to continuously mix the diffusion medium. 200 µL of the receptor solution was drained with the use of a micro-syringe at regular intervals of 5, 10, 15, 30, 60, 120, 240, and 480 min to measure absorbance using a UV-Vis spectrophotometer. The receptor cell was promptly replenished with a volume of receptor fluid equal to the initial volume [Citation29,Citation31–33].
2.5.5.3. Permeation data analysis
2.5.5.3.1. Steady state flux
The rate of drug diffusion through a permeable membrane is known as flux. When the drug had reached a steady state, the steady state flux was estimated, as follows:
where dM is quantity of drug permeated through area of unit cross-section (S) in unit time t.
2.5.5.3.2. Enhancement ratio
The enhancement ratio was developed to determine the relative enhancement of flux in comparison to the reference enhancement ratio. It was calculated as follows:
2.5.5.3.3. Permeability co-efficient
For permeability, the following equation was used to calculate the co-efficient (Kp) through the membrane.
where H is thickness of membrane and Cₒ is initial drug concentration.
3. Results and discussions
3.1. Chemical characterizations
3.1.1. FT-IR spectroscopy
FT-IR spectra of electrospun nanofibers with various compositions (ITN-PAN-PU-1, ITN-PAN-PU-2, ITN-PAN-PU-3, ITN-PAN-PU-4) are shown in and . The analysis shows that the adsorption frequency of various functional groups, present in the fabricated films, remained unaffected on varying concentration of drug. In FT-IR spectra of MMT reinforced drug-loaded PAN-PU nanofibers, O–H stretching, C–H stretching, C = O stretching, C–H bending vibration, C–H deformation vibration, C–O stretching, and C–C stretching vibration are responsible for the peaks recorded at 3319 cm−1, 2940 cm−1, 2232 cm−1, and 1459 cm−1, 1158 cm−1, and 1007 cm−1, respectively. The pullulan nanofibrous film was observed to have similar bands and a little peak at 850 cm−1, which was indicative of the glucopyranose units. Peaks at 755 cm−1 and 932 cm−1 show the presence of -(1, 4) glucosides bonds and
-(1, 6) glucosides bonds, respectively. Furthermore, the frequencies used to analyse the samples and reference are comparable. The stretching vibration bands of CH groups arise at 2850–3000 cm−1. In addition, at 3000–3600 cm−1, a highly rigid, broad hydroxyl band forms, and additional C–O stretching occurred at around 1000–1260 cm−1 [Citation34–37]. In the wave number range of 500–4000 cm−1, the FTIR spectrum of montmorillonite clay was also found. The asymmetric stretching vibrations of the Si–O–Si and the AlO4 and SiO4 groups of montmorillonite clay created the peak at 800 cm−1 and 1100 cm−1 [Citation37,Citation38]. Isotretinoin has a C–O peak at 1675 cm−1 in its FTIR spectra. The low drug dose, loaded in nanocomposite is confirmed by the peak in its FTIR spectrum, indicating that the drug is encapsulated within the nanocomposite film [Citation33]. Peaks around 2930 and 2240 cm−1 were attributed to C–H stretching present in PAN and PU and C–N stretching in PAN, respectively [Citation39]. The characteristic bands of the nitrile (2240 cm−1) and ether (1150–1060 cm−1) groups of PAN were also visible in the FT-IR spectra of PAN, while the ether bands are obtained from the methyl acrylate co-monomer [Citation40].
Figure 2. Overlay of FT-IR spectra of all the fabricated formulations.
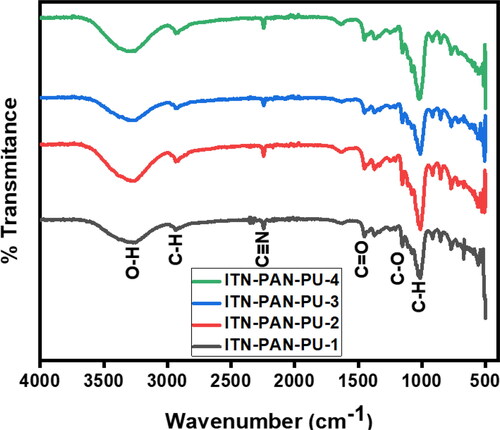
Table 3. FT-IR study of some prominent functional groups of drugs loaded nanofibers.
3.1.2 Scanning electron micrographs (SEM)
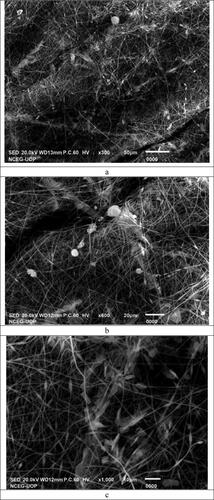
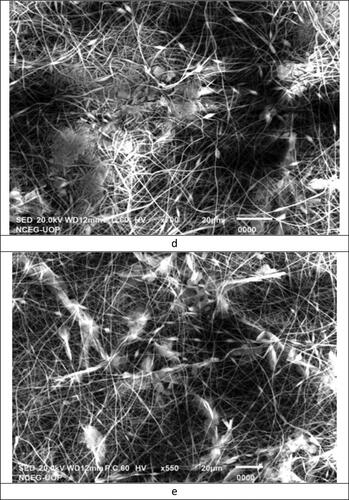
The surface morphology of MMT reinforced drug-loaded PAN and PU nanofibers of the formulation F-1, i.e. ITN-PAN-PU-1 at different magnification powers are shown in . The nanofibers have a randomly oriented, cylindrical, smooth, and beaded appearance in SEM micrographs, with an equal distribution of MMT. The diameter of nanofibers was increased as a result of the presence of PAN in the formulation that increased the viscosity of solution. SEM micrographs of drug-loaded nanofibers reveal that no clumps have been observed and the drug has been evenly dispersed throughout the nanofibrous mat [Citation41]. indicates that adding 1% w/w MMT to a polymer solution containing PAN-PU resulted in the crosslinking and a slight increase in fibre width. The size and shape of the MMT reinforced the drug-loaded PAN-PU nanofibrous mats containing 1% w/w MMT became uneven, and the surfaces became rough. The diameter of fibres and surface roughness was increased when MMT was added to the drug-loaded PAN-PU polymer solution, and these morphological changes remained as the MMT content were increased [Citation42]. The addition of MMT increased the viscosity of the polymer solution, resulting in the increased fibre diameters and surface roughness as the MMT content rises [Citation43]. It has also been discovered that surface pore size has a strong relationship with surface roughness and smaller pore size substrates having smoother surfaces and vice versa [Citation36].
Figure 3. SEM images of fabricated Nanofibers. (a) Nanofibers of ITN-PAN-PU-1 at resolution ×300. (b) Nanofibers of ITN-PAN-PU-1 at resolution ×600. (c) Nanofibers of ITN-PAN-PU-1 at resolution ×1000. (d) Nanofibers of ITN-PAN-PU-1 at resolution ×700. (e) Nanofibers of ITN-PAN-PU-1 at resolution ×300.
3.1.3. Thermogravimetric analysis
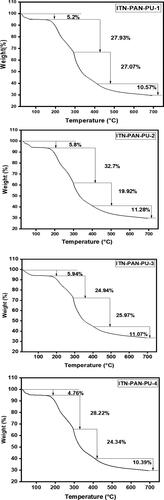
The weight-loss trend of MMT-reinforced drug-loaded PAN-PU nanofibers as a function of temperature is shown in . The thermal stability of MMT-reinforced drug-loaded PAN-PU nanofibers is clearly affected by the addition of 1% w/w MMT. As reported earlier, MMT improves the thermal stability of PAN and PU nanofibers [Citation42]. The TGA curve of nanofibers with various drug concentrations revealed four distinct weight loss zones. It was noted that there was no discernible effect on weight loss as the drug concentration increased. The first dip (27–150 °C) occurred by moisture and solvent evaporation present in nanofibers. It could possibly be attributed to the fact that from room temperature to 150 °C, all four samples lose about 10% of their initial weight due to water and solvent loss. The degradation in the second zone (160–300 °C) was caused by PAN, as the predominant degradation process occurs around 300 °C. Pullulan has similar temperatures of 290 °C and 310 °C, although its thermal stability is significantly lower [Citation44]. The biggest weight loss for PAN occurred in the third region (300–399 °C), with the highest weight loss occurring at 300 °C, which corresponded to the onset of polymer breakdown, and a little weight loss occurring up to 420 °C, corresponding to PAN dehydrogenation and ultimate degradation [Citation40]. The degradation from 406 °C to 486 °C in the fourth region (406–688 °C) was attributable to both PAN & MMT thermal degradation [Citation45]. Between 110 °C and 700 °C, the TGA curves of all formulations exhibited two major weight loss stages, which corresponded to the thermal breakdown of the isotretinoin into small organic groups. The thermostability of the biomolecule was enhanced to 110 °C. The initial weight loss from 110 °C to 380 °C could be a short procedure with a large mass loss (m = 80%). The second one, which is included in the fourth region, begins with a slow process followed by a rapid process with a small mass loss (m = 19.6%) between 380 °C and 600 °C (406 –688 °C). Both thermal degradation phases between 110 °C and 600 °C, which are typical of pure isotretinoin, could be of isotretinoin and PAN, which has been detected between 110 °C and 600 °C in all of our formulations [Citation46].
Figure 4. TGA thermograms (a) TGA thermogram of ITN-PAN-PU-1, (b) ITN-PAN-PU-2, (c) ITN-PAN-PU-3, (d) ITN-PAN-PU-4.
3.1.4. X-ray diffraction (XRD) Spectroscopy
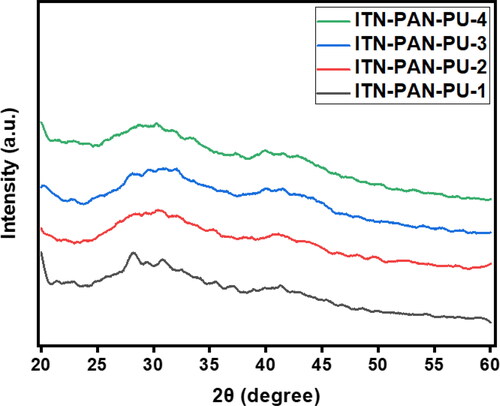
The X-ray diffraction method is an analytical technique for determining a substance’s crystalline nature, physical properties, and synthesis content. The X-ray scattering pattern of biochar polymer composites reveals how clay nanoparticles are dispersed inside the matrix material. , shows that the signal in the 28–29 (2θ range, which implies an interlayer polymer/layered silicate structure), displays homogeneous MMT distribution throughout the polymers, which is consistent with literature [Citation34,Citation43]. Pullulan is an amorphous polymer. When it comes to the amorphous form, other studies have shown comparable results [Citation36]. As demonstrated in , the presence of a peak at 2 of 21 in the XRD spectra confirms the amorphous phase of Accutane. However, arches appeared in the diffraction peaks of connected nanofibers, indicating that chemical links inside the fibres were oriented during the spinning process [Citation33].
Figure 5. Overlay of XRD of all the fabricated formulations.
3.2. Pharmaceutical studies
3.2.1. Calibration curve
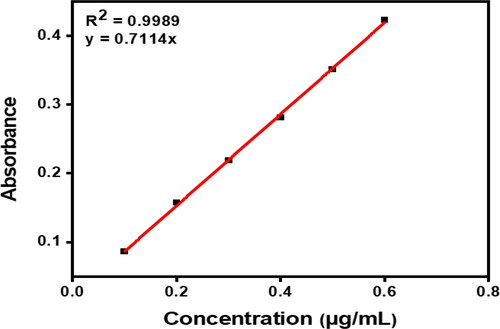
The calibration curve is linear for the concentration range of 0.1–0.6 ug/mL. The correlation coefficient (R2) is used to determine the degree of linear relationship. As seen in , R2 value is 0.9989, showing a high level of correlation. y = 0.7114x is the formula for a linear relationship equation. displays the calibration curve data.
Figure 6. Calibration curve of isotretinoin.
3.2.2. Swelling ratio
The drug’s release behaviour from the nanofibers sheet is influenced by the degree of swelling, thus it is important to study this property of the formulation. The swelling ratio of all the formulations is depicted in and . Formulation F1 showed non-significantly (p > 0.05) highest swelling ratio during the initial hour of soaking in the solvent but it was decreased afterward. It could be due to polymer chain relaxation in the initial moments which may also lead to increased porosity; however, the porosity could be reduced afterwards due to tightening of polymer chains and thus causing reduced swelling ratio [Citation45]. In addition, formulation with a higher drug concentration had a non-significantly (p > 0.05) higher swelling ratio. It could be due to the fact a formulation having larger drug contents allows the release of proportionally larger amount of drug, leaving loose polymer chains. On the other hand, the drug-loaded polymeric nanofiber erodes at a slower rate, which could be due to a decrease in water flux into the fibres.
Figure 7. Swelling ratio of drug loaded nanocomposite films at pH 6.8.
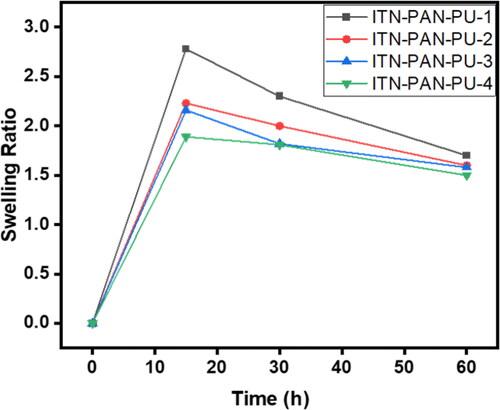
Table 4. Swelling ratio data of all the fabricated data.
3.2.3. Erosion studies
The weight loss of the enlarged films is referred to as erosion studies. The weight loss of drug-loaded nanocomposite films was measured at pH 6.8 in erosion investigations, with the films having the most drug showing the greatest weight loss. At pH 6.8, the films remained stable and none of them were fully degraded. Formulation F1 () showed significantly (p < 0.05) highest erosion as compared to all other formulations. It could be due to polymer chain relaxation, allowing the release of drug which resulted in an increased erosion of the films [Citation45].
Table 5. Erosion data of drug loaded films at pH 6.8.
3.2.4 In-vitro permeation studies
The in-vitro permeation profile of isotretinoin across rabbit skin using a water - ethanol solvent system (7.5:2.5) in the receiver compartment is shown in and . It illustrates that the drug is quickly released during the first hour, but slow drug release was observed during the later hours. It could be due to the higher swelling during the initial hour [Citation46]. In addition, quicker release occurred from the formulation with the highest amount of drug loaded to it (formulation F1). This swift release from formulation F1 could be attributed to its higher swelling and erosion of formulation [Citation47,Citation48].
Figure 8. In-vitro permeation profile of isotretinoin from nanocomposite films.
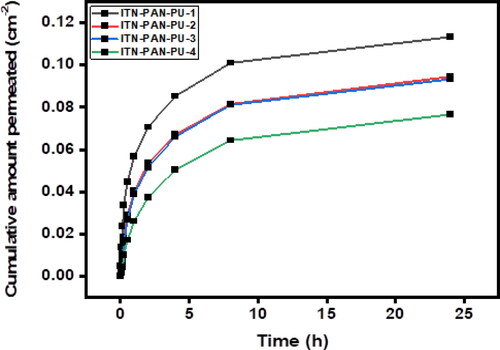
Table 6. Different permeability factors for cumulative drug release of films having 0.1, 0.2, 0.4, and 0.8 mg of drug.
4. Conclusion
In the present work, the varying concentrations of isotretinoin were successfully integrated into MMT-reinforced PAN-PU nanofibers using an electrospinning procedure. According to the results, the fabricated nanofibers (PAN/PU) showed a promising potential for controlled permeation of drug through rabbit skin. In addition, the loaded drug concentration in a nanofibrous formulation influenced its flux across the skin.
Author contributions
Badriyah Shadid Alotaibi, Qasim Talib Awan, Haya Yasin, Manal Buabeid, Saba Kaleem, Shumyla Nawazish, Abida Kalsoom Khan, and Ghulam Murtaza had substantial contributions to the conception or design of the work and interpretation of data for the work; Badriyah Shadid Alotaibi, Abida Kalsoom Khan, Ghulam Murtaza were involved in the acquisition, analysis, or interpretation of data for the work; Badriyah Shadid Alotaibi, Qasim Talib Awan, Haya Yasin, Manal Buabeid, Saba Kaleem, Shumyla Nawazish, Abida Kalsoom Khan, and Ghulam Murtaza drafted the work and revised it critically for important intellectual content and finally approved the version to be published; Badriyah Shadid Alotaibi, Kalsoom Khan, Ghulam Murtaza agrees to be accountable for all aspects of the work in ensuring that questions related to the accuracy or integrity of any part of the work are appropriately investigated and resolved.
Acknowledgment
Authors acknowledge Princess Nourah bint Abdulrahman University Researchers Supporting Project number (P NURSP2023R73), Princess Nourah bint Abdulrahman University, Riyadh, Saudi Arabia.
Disclosure statement
No potential conflict of interest was reported by the authors.
Data availability statement
The data that support the findings of this study are available from the corresponding author, [GM], upon reasonable request.
Correction Statement
This article has been republished with minor changes. These changes do not impact the academic content of the article.
References
- Ibrahim NA, Kaleem S, Khan AK, et al. Development and butyrylcholinesterase/monoamine oxidase inhibition potential of PVA-Berberis lycium nanofibers. Green Process Synth. 2022;11(1):1–18. doi: 10.1515/gps-2022-0017.
- Thenmozhi S, Dharmaraj N, Kadirvelu K, et al. Electrospun nanofibers: new generation materials for advanced applications. Mater Sci Eng B. 2017;217:36–48. doi: 10.1016/j.mseb.2017.01.001.
- Xu L, Zheng X, Cui H, et al. Equilibrium, kinetic, and thermodynamic studies on the adsorption of cadmium from aqueous solution by modified biomass ash. Bioinorg Chem Appl. 2017;2017:3695604. doi: 10.1155/2017/3695604.
- Pant B, Park M, Park S-J. Drug delivery applications of core-sheath nanofibers prepared by coaxial electrospinning: a review. Pharmaceutics. 2019;11(7):305. doi: 10.3390/pharmaceutics11070305.
- Sun Y, Cheng S, Lu W, et al. Electrospun fibers and their application in drug controlled release, biological dressings, tissue repair, and enzyme immobilization. RSC Adv. 2019;9(44):25712–25729. doi: 10.1039/c9ra05012d.
- Chen LX, Hu DJ, Xu WF, et al. Identification and determination of fructooligosaccharides in snow chrysanthemum (Coreopsis tinctoria nutt.). World J Tradit Chin Med. 2021;7:78–85.
- Courtney CM, Goodman SM, McDaniel JA, et al. Photoexcited quantum dots for killing multidrug-resistant bacteria. Nat Mater. 2016;15(5):529–534. doi: 10.1038/nmat4542.
- Fu Y, Li X, Ren Z, et al. Multifunctional electrospun nanofibers for enhancing localized cancer treatment. Small. 2018;14(33):1801183. doi: 10.1002/smll.201801183.
- Chen Z, Chen Z, Zhang A, et al. Electrospun nanofibers for cancer diagnosis and therapy. Biomater Sci. 2016;4(6):922–932. doi: 10.1039/c6bm00070c.
- Joshi MK, Tiwari AP, Pant HR, et al. In situ generation of cellulose nanocrystals in polycaprolactone nanofibers: effects on crystallinity, mechanical strength, biocompatibility, and biomimetic mineralization. ACS Appl Mater Interfaces. 2015;7(35):19672–19683. doi: 10.1021/acsami.5b04682.
- Karbownik I, Rac-Rumijowska O, Fiedot-Toboła M, et al. The preparation and characterization of polyacrylonitrile-polyaniline (PAN/PANI) fibers. Materials (Basel). 2019;12(4):664. PMID: 30813349; PMCID: PMC6416742. doi: 10.3390/ma12040664.
- Lv H, Guo S, Zhang G, et al. Electrospun structural hybrids of acyclovir-polyacrylonitrile at acyclovir for modifying drug release. Polymers (Basel). 2021;13(24):4286. PMID: 34960834; PMCID: PMC8708694. doi: 10.3390/polym13244286.
- Sarwar MN, Ullah A, Haider MK, et al. Evaluating antibacterial efficacy and biocompatibility of PAN nanofibers loaded with diclofenac sodium salt. Polymers (Basel). 2021;13(4):510. PMID: 33567692; PMCID: PMC7915392. doi: 10.3390/polym13040510.
- Park JH, Tai GZ, Lee BK, et al. Preparation and investigation of hydrolyzed polyacrylonitrile as a preliminary biomedical hydrogel. Biomater Res. 2015;19(1):20. doi: 10.1186/s40824-015-0043-1.
- Liu H, Zhang S, Yang J, et al. Preparation, stabilization and carbonization of a novel polyacrylonitrile-based carbon fiber precursor. Polymers. 2019;11(7):1150. doi: 10.3390/polym11071150.
- Kharaghani D, Gitigard P, Ohtani H, et al. Design and characterization of dual drug delivery based on in-situ assembled PVA/PAN core-shell nanofibers for wound dressing application. Sci Rep. 2019;9(1):12640. doi: 10.1038/s41598-019-49132-x.
- Tian LX, Li JH, Zhang L, et al. Discrimination of five species of Panax genus and their geographical origin using electronic tongue combined with chemometrics. World J Tradit Chin Med. 2021;7(1):104–110. doi: 10.4103/wjtcm.wjtcm_80_20.
- Hadrich A, Dulong V, Rihouey C, et al. Biomimetic hydrogel by enzymatic crosslinking of pullulan grafted with ferulic acid. Carbohydr Polym. 2020;250:116967. doi: 10.1016/j.carbpol.2020.116967.
- Krupskaya VV, Zakusin SV, Tyupina EA, et al. Experimental study of montmorillonite structure and transformation of its properties under treatment with inorganic acid solutions. Minerals. 2017;7(4):49. doi: 10.3390/min7040049.
- Bahreini Z, Heydari V, Namdari Z. Effects of nano-layered silicates on mechanical and chemical properties of acrylic-melamine automotive clear coat. PRT. 2017;46(5):333–341. doi: 10.1108/PRT-07-2016-0077.
- Wang ZB, Ma Y, Liu H, et al. Simultaneous determination and pharmacokinetics of tetrandrine, fangchinoline, and cyclanoline in rat plasma by ultra-high performance liquid chromatography‑mass spectrometry after oral administration of stephaniae tetrandrae radix extract. World J Tradit Chin Med. 2021;7(1):130–137. doi: 10.4103/wjtcm.wjtcm_73_20.
- Hosny KM, Alhakamy NA, Al Nahyah KS. The relevance of nanotechnology, hepato-protective agents in reducing the toxicity and augmenting the bioavailability of isotretinoin. Drug Deliv. 2021;28(1):115–125. doi: 10.1080/10717544.2020.1862365.
- Rianjanu A, Julian T, Hidayat S, et al. Polyacrylonitrile nanofiber as polar solvent N, N-dimethyl formamide sensor based on quartz crystal microbalance technique. J Phys: Conf Ser. 2018;1011:012067. IOP Publishing: doi: 10.1088/1742-6596/1011/1/012067.
- Laha B, Maiti S. Design of core-shell stearyl pullulan nanostructures for drug delivery. Mater Today: Proc. 2019;11:620–627. doi: 10.1016/j.matpr.2019.03.019.
- Hsi S-L, Surman P, Al-Kassas R. Development of a stability-indicating UPLC method for determination of isotretinoin in bulk drug. Pharm Dev Technol. 2019;24(2):189–198. doi: 10.1080/10837450.2018.1454469.
- Dodero A, Alloisio M, Vicini S, et al. Preparation of composite alginate-based electrospun membranes loaded with ZnO nanoparticles. Carbohydr Polym. 2020;227:115371. doi: 10.1016/j.carbpol.2019.115371.
- Gupta S, Wairkar S, Bhatt LK. Isotretinoin and α-tocopherol acetate-loaded solid lipid nanoparticle topical gel for the treatment of acne. J Microencapsul. 2020;37(8):557–565. doi: 10.1080/02652048.2020.1823499.
- David SRN, Hui MS, Pin CF, et al. Formulation and in vitro evaluation of ethosomes as vesicular carrier for enhanced topical delivery of isotretinoin. Int J Drug Deliv. 2013;5:28.
- Patel MR, Patel RB, Parikh JR, et al. Novel isotretinoin microemulsion-based gel for targeted topical therapy of acne: formulation consideration, skin retention and skin irritation studies. Appl Nanosci. 2016;6(4):539–553. doi: 10.1007/s13204-015-0457-z.
- Brinckmann JA, Cunningham AB, V. Harter DE. Reviewing threats to wild Rhodiola sachalinensis, a medicinally valuable yet vulnerable species. World J Tradit Chin Med. 2021;7(3):299–306. doi: 10.4103/wjtcm.wjtcm_47_21.
- Farah H, Brown M, McAuley WJ. Heat enhanced follicular delivery of isotretinoin to the skin. Pharm Res. 2019;36(8):1–14. doi: 10.1007/s11095-019-2659-7.
- Raza K, Singh B, Singal P, et al. Systematically optimized biocompatible isotretinoin-loaded solid lipid nanoparticles (SLNs) for topical treatment of acne. Colloids Surf B Biointerfaces. 2013;105:67–74. doi: 10.1016/j.colsurfb.2012.12.043.
- Ghaghelestani TN, Farhadian N, Binesh N. Preparation a core-shell lipid/polymer nanoparticle containing isotretinoin drug with pH sensitive property: a response surface methodology study. J Appl Polym Sci. 2021;138(30):50734. doi: 10.1002/app.50734.
- Yeasmin S, Yeum JH, Yang SB. Fabrication and characterization of pullulan-based nanocomposites reinforced with montmorillonite and tempo cellulose nanofibril. Carbohydr Polym. 2020;240:116307. doi: 10.1016/j.carbpol.2020.116307.
- Haghighatpanah N, Mirzaee H, Khodaiyan F, et al. Optimization and characterization of pullulan produced by a newly identified strain of Aureobasidium pullulans. Int J Biol Macromol. 2020;152:305–313. doi: 10.1016/j.ijbiomac.2020.02.226.
- Singh RS, Kaur N, Pandey A, et al. Hyper-production of pullulan from de-oiled rice bran by Aureobasidium pullulans in a stirred tank reactor and its characterization. Bioresour Technol Rep. 2020;11:100494. doi: 10.1016/j.biteb.2020.100494.
- Singh RS, Saini GK, Kennedy JF. Pullulan production in stirred tank reactor by a colour-variant strain of Aureobasidium pullulans FB-1. Carbohydr Polym Technol Appl. 2021;2:100086. doi: 10.1016/j.carpta.2021.100086.
- Bhagath S, Vivek A, Krishna VV, et al. Synthesis and characteristics of MMT reinforced chitosan nanocomposite. Mater Today: Proc. 2021;46:4487–4492. doi: 10.1016/j.matpr.2020.09.685.
- Jamshidifard S, Koushkbaghi S, Hosseini S, et al. Incorporation of UiO-66-NH2 MOF into the PAN/chitosan nanofibers for adsorption and membrane filtration of Pb (II), Cd (II) and Cr (VI) ions from aqueous solutions. J Hazard Mater. 2019;368:10–20. doi: 10.1016/j.jhazmat.2019.01.024.
- Saeed K, Haider S, Oh T-J, et al. Preparation of amidoxime-modified polyacrylonitrile (PAN-oxime) nanofibers and their applications to metal ions adsorption. J Membr Sci. 2008;322(2):400–405. doi: 10.1016/j.memsci.2008.05.062.
- Rabbani MM, Yang SB, Park S-J, et al. Characterization of pullulan/chitosan oligosaccharide/montmorillonite nanofibers prepared by electrospinning technique. J Nanosci Nanotechnol. 2016;16(6):6486–6493. doi: 10.1166/jnn.2016.12121.
- Rukmanikrishnan B, Lee J. Montmorillonite clay and quaternary ammonium silane-reinforced pullulan/agar-based nanocomposites and their properties for packaging applications. Int J Biol Macromol. 2021;191:956–963. doi: 10.1016/j.ijbiomac.2021.09.130.
- Kumar M, Upadhyay S, Mishra P. Effect of Montmorillonite clay on pyrolysis of paper mill waste. Bioresour Technol. 2020;307:123161. doi: 10.1016/j.biortech.2020.123161.
- Hussain MA, Abbas K, Lodhi BA, et al. Fabrication, characterization, thermal stability and nanoassemblies of novel pullulan-aspirin conjugates. Arab J Chem. 2017;10:S1597–S1603. doi: 10.1016/j.arabjc.2013.06.001.
- Lewicki JP, Liggat JJ, Patel M. The thermal degradation behaviour of polydimethylsiloxane/montmorillonite nanocomposites. Polym Degrad Stab. 2009;94(9):1548–1557. doi: 10.1016/j.polymdegradstab.2009.04.030.
- Guimarães CA, Menaa F, Menaa B, et al. Comparative physical–chemical characterization of encapsulated lipid-based isotretinoin products assessed by particle size distribution and thermal behavior analyses. Thermochim Acta. 2010;505(1-2):73–78. doi: 10.1016/j.tca.2010.04.001.
- Paiva-Santos AC, Mascarenhas-Melo F, Coimbra SC, et al. Nanotechnology-based formulations toward the improved topical delivery of anti-acne active ingredients. Expert Opin Drug Deliv. 2021;18(10):1435–1454. doi: 10.1080/17425247.2021.1951218.
- Wu DD, Qu C, Liu XQ, et al. A simple high‑performance liquid chromatography method for the assay of flavonoidsin Ginkgo biloba leaves. World J Tradit Chin Med. 2021;7(1):47–53. doi: 10.4103/wjtcm.wjtcm_9_21.