
 ?Mathematical formulae have been encoded as MathML and are displayed in this HTML version using MathJax in order to improve their display. Uncheck the box to turn MathJax off. This feature requires Javascript. Click on a formula to zoom.
Abstract
Nanocrystalline magnesium oxide powders (MgO) were prepared using a hydrothermal method. In various fuel-to-oxidizer ratios (F/O) and precursor solutions with pH levels from 8 to 12, magnesium nitrate hexahydrate Mg(NO3)2 was utilized as an oxidizer and polyvinyl alcohol (PVA) as a fuel. To improve crystallinity and phase purity, these materials were annealed for two hours at varied temperatures. XRD, FTIR, EDS, FESEM and DRS were used to study the MgO nanopowders’ structure, vibration, elemental and optical properties. The fuel-to-oxidizer ratios, annealing temperatures and pH values greatly affected the samples’ properties. The synthesized powders had a particle size distribution in the range of 18–49 nm. The XRD results showed that the crystallite percent of the MgO phase grew with an increase in the F/O from 0.5 to 0.75, and then, it decreased at F/O = 1. The maximum percent of crystallites was observed at pH = 8. By increasing the annealing temperatures, the crystallite size of the samples increased from 22.82 nm to 49.06 nm, while the specific surface area and dislocation density decreased from 20.59 m2/g to 7.83 m2/g and 0.0006 nm−2 to 0.0001 nm−2, respectively. FTIR spectra results indicated that the MgO band peaking at (418–688 cm−1) was high at pH value 8, then it reduced at pH 10 and finally, this peak had the smallest size at pH = 12. Further confirmation of MgO presence and its homogeneity in the final product was approved through EDS measurements. DRS spectra were used to obtain energy gap using Kubelka–Munk relation and noticed in the range of 5.72–5.89 eV for MgO NPs.
1. Introduction
Nanotechnology is currently applied in various sectors, and there are numerous compelling reasons to do so in the modern world. It is a scientific and engineering subdiscipline concerned with the synthesis, characterization and use of innovative materials to advance modern technology [Citation1]. Recently there has been a significant increase in interest in nanostructured materials owing to their distinctive characteristics such as improved damping qualities, strength, mechanical stability and thermal conductivity [Citation2]. Nanomaterials have the potential to produce superior and more specialized qualities for usage in a variety of applications in a variety of industries because of their distinct physicochemical characteristics resulting from their nanosized dimensions and enormous surface-to-volume ratios [Citation3]. In recent years, a significant number of researchers have centered their attention on metal oxides as a result of the wide variety of possible uses that they provide [Citation4–6].
Magnesium oxide (MgO) nanoparticles are drawing more attention as structural products in biological implants than many other metal oxide nanoparticles. They are extensively employed in numerous fields because of their environmental friendliness. Owing to these attributes of MgO nanoparticles, their potency is magnified many times. They have a high melting point, are affordable to manufacture and are highly biocompatible with living organisms [Citation7]. Magnesium oxide is employed in various applications, including optical coating, water treatment, catalysis, antimicrobial coating, sensors and adsorbents. This is primarily due to the material’s outstanding surface reactivity, wide bandgap, chemical and thermal properties and stability, contributing to its high performance. Their optical, electrical and luminescent characteristics have been extensively studied, and new wet chemical techniques such as sol-gel, hydrothermal, co-precipitation and spray pyrolysis have been used to synthesize nanoscale MgO powders [Citation8–14]. Since MgO nanoparticles and nanocomposite materials may be employed in many different sophisticated technologies, scientists have been concentrating on how to synthesize them [Citation15,Citation16]. Nanostructured MgO benefits from ceramics, electronics, catalysts and other fields [Citation17,Citation18]. Because MgO nanoparticles are nontoxic, they are often employed in crucibles, flame-retardant, refractory and coating materials [Citation19–21]. Ionic strength, pH and annealing temperature can modify the size and morphology of oxide particles [Citation8]. In previous studies, MgO has been synthesized using various precursors, resulting in various morphologies [Citation10]. Researchers worldwide have been intrigued by the multifunctional attributes of MgO, including its nontoxicity, eco-friendliness and highly specific surface area.
Establishing a controlled synthesis of MgO with precise morphology, small crystallite size and high specific surface area is challenging. Understanding growth mechanisms is also a critical area of study that must be pursued further. Synthetic methodologies for tailoring the size and form of nanostructures are critical in nanomaterials research. Numerous variables such as the fuel-to-oxidizer ratio, hydrogen potential, calcination temperature, calcination duration and ambient conditions significantly affect the properties of MgO [Citation22].
A hydrothermal approach was used in this study to synthesize magnesium oxide nanoparticles. The effects of the fuel-to-oxidizer ratio, hydrogen potential and annealing temperature on the properties of the nanocrystalline MgO powders were carefully examined. X-ray diffraction was used to analyze and determine the crystal structural characteristics and structural dislocations that occur during the synthesis of nanocrystalline MgO powders. It was subsequently supplemented by Fourier-transform infrared spectroscopy (FTIR) analysis to determine the functional group alterations in the resultant nanoparticles and energy-dispersive X-ray spectroscopy (EDS) for qualitative analysis. This study is the first of its kind to demonstrate, for the first time, how the various parameters (fuel-to-oxidizer ratio, hydrogen potential value and annealing temperature) influence the structure and optical properties of nanocrystalline MgO powders synthesized using the hydrothermal process. This has not been studied together in the previous literature.
2. Experimental procedure
2.1. Materials
All chemicals, including magnesium nitrate hexahydrate (Mg (NO3)2 · 6H2O (99.9%, Mw = 256.41 g mol−1), Polyvinyl alcohol PVA (Mw 13,000–23,000, 87–89% hydrolyzed) and sodium hydroxide NaOH (98%, Mw = 40 g mol−1), were purchased from Merck Company. The chemicals and reagents used in this study were acquired at standard levels and were used without additional purification. Absolute ethanol (99.8%, Mw = 46.07 g mol−1, Merck Company) and ultra-pure water (Milli-Q water, resistivity 18.5 MΩ) were used to wash the produced nanoparticles. A chromic acid solution and Milli-Q water were used to clean all the glassware before use.
2.2. Preparation of MgO nanocrystalline powders
The non-Stoichiometric hydrothermal method and ultrasonic irradiation technique were used to synthesize MgO nanocrystalline powders. A flowchart of the production of MgO nanocrystalline powders is illustrated in .
Figure 1. Flowchart for hydrothermal synthesis of MgO nanocrystalline powders.
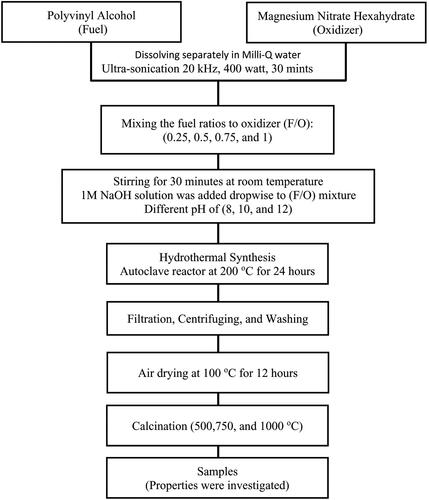
Here, we provide an in-depth overview of the entire process. The first step was to weigh and dissolve a suitable quantity of magnesium nitrate hexahydrate and polyvinyl alcohol individually in the smallest amount of Milli-Q water necessary to obtain a clear homogenous solution. Four different fuel-to-oxidizer (F/O) weight ratios were measured: 0.25, 0.5, 0.75 and 1. The prepared solutions were carefully mixed to obtain the appropriate compositions. Subsequently, they were ultrasonically homogenized for 10 min at constant sonication amplitude of 60% (Q700 Sonicator). The pH values of the solutions were adjusted to 8, 10 and 12 to obtain the desired results. Sodium hydroxide was then added to modify the pH of the solution. The (F/O) mixture was then placed in a hydrothermal autoclave reactor with a Teflon chamber and heated in an oven at 200 °C for 24 h. The autoclave was then cooled for an additional 24 h in an oven. A Buchner funnel vacuum filtration system was used to remove the suspended solid material from the liquid. The samples were then collected by centrifugation at 10,000 rpm for 10 min. It was washed with Milli-Q water numerous times to remove nitrates and then with ethanol to minimize agglomeration. On the basis of this synthesis route, the reaction was completed in two steps and the relevant chemical reactions can be formulated as follows:
Step one in the autoclave:
Step two under different calcination temperatures:
where (aqu) is in aqueous solution and (CP) is Cloudy Precipitate
The powders were then air-dried in an oven at 100 °C for 12 h. The powders were annealed for 2 h at 500, 750 and 1000 °C (at a rate of 5 °C/min) in a muffle furnace. This study investigated the effects of varying the F/O ratio, pH and annealing temperature on the properties of MgO nanopowders. summarizes the experimental conditions for synthesizing the MgO nanoparticles using the hydrothermal technique.
Table 1. Experimental conditions for synthesizing MgO nanoparticles.
2.3. Characterization methods
The prepared samples were structurally characterized by X-ray powder diffractometry (XRD) using monochromatized Cu-Kα radiation (PANalytical X'Pert Pro). The XRD patterns were obtained within a 2θ scanning angle range of 20° to 80° at a rate of 0.02°. The HighScore Plus software was used to refine the powder XRD patterns of the samples [Citation5]. A Fourier transform infrared (FTIR) spectrometer (Shimadzu, IRAffinity-1, Japan) was used to record FTIR spectra using the KBr pellet method. The FTIR spectra of the samples were acquired in the wavenumber range 400–4000 cm−1. The elemental composition was investigated using an energy dispersive spectroscopy (EDS) model (Aztec, Oxford instrument PLC, UK).
3. Results and discussion
3.1. Structural characterization
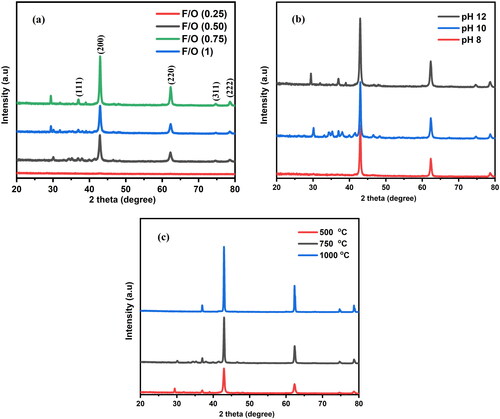
The crystal structural characteristics of the MgO samples prepared by the hydrothermal method were investigated by XRD, as shown in . The patterns show the well-resolved reflection peaks at (222), (311), (220), (200) and (111) in all samples, which belong to a cubic structure. The patterns were identical to the reference code (ICSD 98-002-2101). The samples obtained at different fuel-to-oxidizer weight ratios (0.25, 0.5, 0.75 and 1) at a pH of 12 and an annealing temperature of 500 °C are shown in . The samples obtained at different pH values (8, 10 and 12) with a constant fuel-to-oxidizer ratio of 0.75 and an annealing temperature of 500 °C are shown in . shows the samples produced using a constant fuel-to-oxidizer ratio of 0.75 and a pH of 12. These samples were then annealed at 500 °C, 750 °C and 1000 °C.
Figure 2. X-ray diffraction patterns of nanocrystalline MgO powders synthesized at (a) different F/O ratios (b) different pH and (c) different annealing temperatures.
Using Scherrer’s formula and the full width at half maximum (β) of the most intense peak with a (200) hkl value, the crystallite size was calculated and the obtained values were recorded [Citation23].
(1)
(1)
where (D) is the crystallite size, (λ) is the wavelength of the X-ray, (β) is the full width at half maximum intensity for the maximum peak and (
) is Bragg’s diffraction angle.
The lattice constant (a) values were calculated from the relation below, and the obtained values are tabulated in .
(2)
(2)
where h, k and l are the Miller indices of the lattice plane and
is the interplanar spacing.
Table 2. Lattice parameter (a), crystalline size, X-ray density (), percentage of porosity, dislocation density (δ) and lattice strain (ε) of MgO nanocrystal for different ratio of fuel-to-oxidizer, deferent pH and different annealing temperature.
The X-ray density () of the NPs was determined using the following equation:
(3)
(3)
where (8) represents the number of molecules per unit cell, (M) is the molecular weight of the sample, (a) is the lattice constant and (N) is Avogadro’s number (6.023 × 10²³ mol−1).
The bulk density was calculated by using the following equation:
(4)
(4)
The formula below was used to measure the percentage of porosity [Citation24]
(5)
(5)
where
and
are the bulk and X-ray densities, respectively.
The specific surface area (S) can be calculated by Sauter formula:
(6)
(6)
where (S) is the specific surface area.
The value (δ) represents the number of crystal defects exhibited by a solid material. The following equation can be used to determine the dislocation density:
(7)
(7)
The lattice strain (ε) from a given peak intensity angle was estimated using the following equation [Citation25]:
(8)
(8)
where β is the full width at half the maximum intensity of the peak. The results are presented in .
MgO shows interesting phase formation behavior at different F/O ratios, pH values and annealing temperatures, as shown in . This process begins with an oxidizer-fuel reaction. In this reaction, cation, such as carbon or hydrogen, act as fuels and the anions of metal nitrates (such as oxygen) act as the oxidizers. As shown in , either too little or too much fuel does not result in the formation of pure nanocrystalline MgO powders. If more oxygen is present in the combustible mixture than required to react with the fuel, some oxygen will not participate in the reaction. This situation is known as the fuel-lean condition.
In contrast, a fuel-rich condition occurs when there is less oxygen in the combustible mixture than is necessary for the fuel to react completely. In this case, more oxygen is required to complete the reaction [Citation26–28]. In the fuel-lean condition, when F/O = 0.25, the samples were amorphous, as XRD could not identify the crystalline phase of MgO. When F/O = 0.50, the amorphous state transformed into the MgO crystalline phase, retaining the particle properties under controlled conditions. By increasing the F/O ratio to 0.75, all of the MgO X-ray diffraction peaks [(111), (200), (220), (311) and (222)] appear clearly, indicating that MgO phases exist with fewer impurities. The XRD results indicated that the increased fuel content caused a steady increase in the lattice parameters of MgO. Furthermore, as the F/O ratio is increased to 1, the formation of impurity phases is observed to increase owing to less oxygen in the combustible mixture than is required for the fuel to react completely.
The pH of the solution is an important factor that can affect the hydrothermal process [Citation29]. When the pH value is varied, the formation of the pure phase of nanocrystalline MgO powders changes. illustrates the effect of pH on the formation of pure phases. When the pH value was 8, some peaks in the sample disappeared because the fuel did not react entirely. The formation of impurity phases was observed at pH = 10. All the distinct peaks attest to a high level of crystallization, whereas the peaks attributable to the impurity phases decreased as the pH value increased [Citation30]. Additionally, no other X-ray peaks were observed, indicating the high purity of the MgO samples prepared at a pH 12, which is due to an improvement in the crystallinity of the formation powder [Citation31]. The crystallite size for each sample was determined by identifying the most prominent peak in . The crystallite sizes at pH 8, 10 and 12 were found to be 31.62, 29.44 and 22.82 nm, respectively. With an increase in pH to 12, the phase transition that occurred during the hydrothermal process caused the crystallite size to decrease to 22.82 nm. In the presence of a strongly alkaline medium, a greater number of hydroxide ions initially interacted with Mg+2 to produce magnesium hydroxide, which was subsequently dehydrated to generate MgO [Citation22]. The samples produced at different annealing temperatures (500, 750 and 1000 °C), with a constant fuel-to-oxidizer ratio (0.75) and a pH of 12, are shown in with their powder XRD patterns. Because there were still some impurities, the peaks disappeared when the annealing temperature was 500 °C. Additionally, the broad peaks in the XRD analysis demonstrate that the particles initially formed in the amorphous phase. The XRD peaks demonstrated that, as the annealing temperature increased, the peaks became narrower and more distinct, indicating that the crystallinity improved. When the temperature reached 1000 °C, the presence of accurate peaks indicated that the powders underwent a high-temperature treatment to form crystals with a pure phase [Citation23]. The variations in the crystallite size and dislocation density of the nanocrystalline MgO powders at different F/O ratios, pH values and annealing temperatures are given in and shown in . The relationship between specific surface area and average crystalline size is inversely proportional as indicated in EquationEq. (6)(6)
(6) . Then, upon analyzing the results of specific surface area and average crystallite size, it was discovered that a higher specific surface area was associated with a smaller average crystalline size, as demonstrated in . The sample S2 has a minimum crystallite size (18.55 nm) with maximum surface area (30.40 m2/g) and the sample S6 has a maximum crystallite size (49.06 nm) with minimum surface area (7.83 m2/g).
Figure 3. Crystallite size and dislocation density values of the nanocrystalline MgO powders at (a) different F/O (b) different pH and (c) different annealing temperatures.
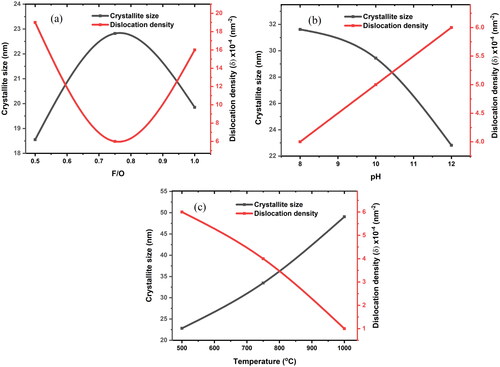
The size of the crystal defects was measured in terms of the dislocation density (δ), which is the number of dislocation lines per unit volume of crystal. In other words, the dislocation density demonstrates the degree of crystallinity of the nanoparticle profile. The samples obtained at different fuel-to-oxidizer weight ratios of (0.25, 0.5, 0.75 and 1) with a pH of 12 and an annealing temperature of 500 °C are shown in .It has been observed that the dislocation density decreases with an increase in crystallite size. The F/O ratio of 0.75 had the highest crystallinity and the smallest dislocations of all the ratios. Various pH levels (8, 10 and 12) with a constant fuel-to-oxidizer ratio of 0.75 and an annealing temperature of 500 °C are depicted in . As the pH increased, the dislocation density decreased significantly and the crystallite size increased, indicating a lower number of lattice imperfections [Citation32,Citation33]. It is clear that the crystallinity increased owing to the observed relationship between the crystallite size and annealing temperature, as shown in . Additionally, the dislocation densities tended to decrease as the annealing temperature increased. The nanoparticles created in this study have a low dislocation density. This is due to a decrease in the occurrence of grain boundaries and lattice defects due to an increase in the crystallite size of the samples as the temperature increased [Citation27]. A low dislocation density indicates that the produced nanocrystalline MgO powders produced have a high degree of crystallinity. Similar results have been previously reported [Citation34]. According to the results of these studies, by increasing the fuel-to-oxidizer ratio to F/O = 0.75, the pH to 12 and the annealing temperatures, all the MgO X-ray diffraction peaks [(111), (200), (220), (311) and (222)] appear clearly, indicating that highly pure nanocrystalline MgO phases exist.
To obtain more specific information regarding the crystal structure, the patterns collected for the samples were refined by the Rietveld method using X'Pert HighScore software. Rietveld profile refinement of the XRD patterns was performed in the space group Fm-3m (No.225, Z = 4). The initial refinement focused on parameters such as 2θ–zero and the background. The other parameters were used as free parameters. These include lattice constants, isothermal parameters, occupancy rates, scale factors and shape parameters [Citation35]. To improve the background, a pseudo-Voigt function was used to improve the background. The best fitted patterns for different temperatures and different pH values at F/O = 0.75 are presented in . The experimental data are represented by open circles, whereas the computed intensities are represented by solid black lines. The difference between the observed and estimated intensities is indicated by the blue line at the bottom of the graph.
Figure 4. The Rietveld refinements of nanocrystalline MgO powders synthesized at F/O (0.75): (a–c) pH 12, annealed at 500 °C, 750 and 1000, respectively (d) pH 10, annealed at 500 °C (e) pH 8, annealed at 500 °C.
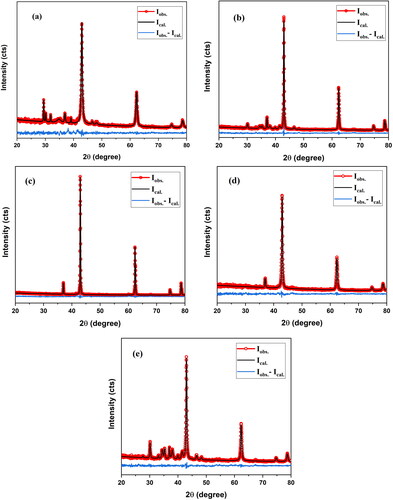
Good fitting of the XRD profiles, indexing of all Bragg peaks and absence of impurity peaks indicated the existence of a single phase of MgO with a NaCl-type cubic structure. The minimum values of the reliability parameters, such as the profile factor (Rp), weighted residual factor (Rwp) and expected residual factor (Rexp) were obtained. displays the results of the calculation of the distribution formulae for the reliability factors Rwp, Rexp and goodness of fit χ2 using EquationEqs. (9)(9)
(9) –Equation(11)
(11)
(11) to assess the accuracy of the fitting of the experimental data. Refinements were made until the goodness of fit approached unity.
(9)
(9)
(10)
(10)
(11)
(11)
where yi is the observed intensity, yc,i is the calculated profile intensity, wi is the perfect weight and N-P is the number of degrees of freedom.
Table 3. Profile factor (Rp), weighted residual factor (Rwp), expected residual factor (Rexp) and goodness of fit (χ2) of MgO samples from Rietveld refinement.
3.2. Elemental characterization
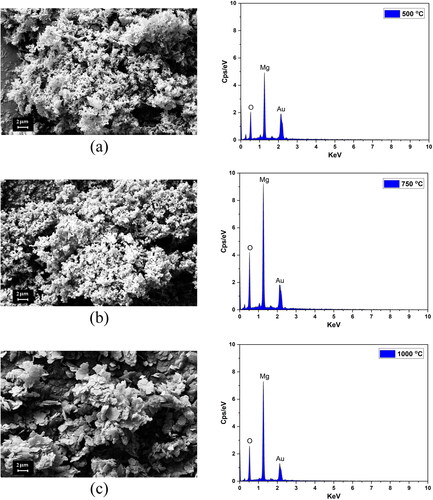
According to comprehensive experimental data and model calculations, there were numerous oxygen vacancies at the surface or subsurface region of MgO. This was verified by measuring the number of O and Mg atoms in the MgO structures produced under various conditions using energy dispersive spectroscopy (EDS) and field emission scanning electron microscope (FESEM). Magnesium (Mg) and oxygen (O), the primary chemical elements present in the samples, were found to have high percentages after analysis. This demonstrates the purity of MgO nanoparticles, which are free of contaminants [Citation36]. As indicated in , the percentages of Mg and O atoms in their compositions varied significantly with variations in the synthesis conditions of the produced MgO. In contrast to other covalent oxides, MgO does not form new bonds when oxygen atoms are removed from its structures; instead, it forms voids, which may account for the varying incentive performances of MgO with different morphologies. As expected, MgO should have a mass of 60.33% an oxygen mass of 39.67%, as predicted by its formula [Citation37]. Depending on the F/O ratio, pH and annealing temperature, the amounts of the chemical elements Mg and O that enter the making MgO nanoparticles change; for instance, the percentage of Mg in MgO nanoparticles made with F/O = 0.75 is higher than that in MgO nanoparticles made with other weight ratios of fuel-to-oxidizer (0.25, 0.5 and 1) when the pH and annealing temperature are constant. In addition, when the F/O ratio and annealing temperature were held constant, MgO nanoparticles prepared at a pH of 8 had a higher percentage of Mg than those prepared at a pH of 10 or 12. Furthermore, increasing the annealing temperature to 1000 °C increased the magnesium content of MgO nanoparticles to 72.5% owing to an increase in crystallite size and the high purity of the samples as the temperature increased.
Table 4. EDS data for MgO at various synthesis conditions.
As seen in , the morphology of the hydrothermally produced nanocrystalline magnesium oxide powders (MgO) was examined by FESEM at annealing temperatures of 500, 750 and 1000 °C. Grain size rises with annealing temperature. The rise in annealing temperature leads to a growth in grain size. The increased grain size seen in the sample annealed at 1000 °C can be attributed to the absence of extra impurity components in the samples. This absence of impurities leads to defect-free and homogeneous samples, which in turn accelerates the growth of the grains. During grain growth, these pores are dragged along the moving boundaries. Thus, the pore’s movement restricts grain growth. At the end of the annealing process, the pore is a specific void. This makes it much easier to separate from a grain boundary. If the grain separates from the pore and becomes isolated, vacancies can no longer easily move out. As a result, the pore stops shrinking and the MgO powder appear to have reached its maximum density.
Figure 5. FESEM images and EDS spectra of the MgO samples annealed at temperatures of (a) 500 °C, (b) 750 °C and (d) 1000 °C.
3.3. Vibrational characterization
Fourier transform infrared spectroscopy was used to determine the functional groups and features of the MgO nanoparticles. The samples were scanned in the wavenumbers range from 400 cm−1 to 4000 cm−1 as shown in . When magnesium oxide is exposed to the atmosphere, it is commonly known that molecules of water and carbon dioxide can be chemisorbed onto its surface with relative ease. The broad vibration band at 3430–3450 cm-1 corresponds to the OH stretching vibrations of water molecules, whereas the vibrations at 1610–1620 cm−1 correspond to their bending mode [Citation38]. In addition, a weak band due to CO2 adsorption in the gas phase was observed between 2375 and 2385 cm−1, whereas CO32- was evident between 1430 and 1440 cm−1 [Citation10]. The stretching and bending vibrations of the Mg-O bond were typical at 418 and 688 cm−1, respectively, and the deformation vibration of the Mg-O-Mg bond and the stretching vibration of the Mg-O bond formed a broad band at approximately 1450 cm−1 [Citation35,Citation39].
Figure 6. FTIR spectrum of nanocrystalline MgO powders synthesized att (a) different F/O (b) different pH and (c) different annealing temperatures.
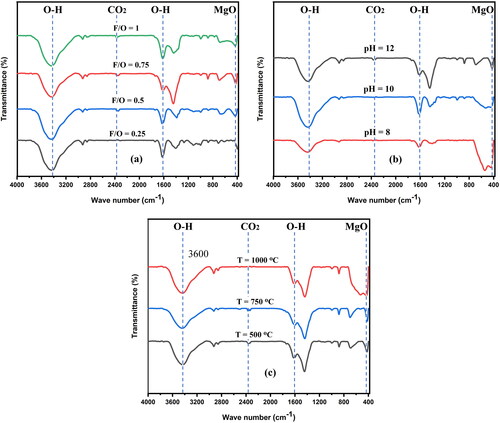
The FTIR transmittance spectra of the produced nanocrystalline MgO powders with different fuel-to-oxidizer weight ratios (0.25, 0.5, 0.75 and 1), pH = 12, and an annealing temperature of 500 °C are shown in . The crystallite size of the MgO nanoparticles is comparatively larger when F/O = 0.75, and the stretching vibration and bending vibration peaks of the Mg-O bond are more pronounced. Compared to smaller crystallites, larger crystallites have fewer atoms/surface units available for binding interactions with H2O molecules; hence, the sample’s absorption peak (F/O = 0.75) shifts for the H2O molecule (from 3450 to 3434 cm−1 and from 1627 to 1617 cm−1) and becomes weaker as observed in . The FTIR spectra of the samples with different pH values (8, 10 and 12), a constant fuel-to-oxidizer ratio (0.75) and an annealing temperature of 500 °C are shown in . In this case, the synthesized sample contained larger crystallites than those with pH values of 10 or 12. As a result, the absorption is reduced and the peak weakens (shifting for the H2O molecule from 1622 to 1618 cm−1 and from 3438 to 3434 cm−1). This is because hydroxyl groups have lower energy and are weakly bound at Mg2+ sites in considerably larger crystallites [Citation14].
The spectra of the annealed samples at different temperatures at pH 12 and F/O = 0.75 are shown in . As previously mentioned the crystallite size increased with increasing temperature [Citation5]. At a substantially larger crystallite size, flaws are anticipated to be less noticeable because the dislocation density decreases with the crystallite size. Additionally, for the samples annealed at 500 °C and 750 °C, a weak band associated with the adsorption of gas-phase CO2 is discernible at approximately 2375–2385 cm−1, but it vanishes at 1000 °C. In addition, the CO2 bands became weaker and shifted from 2383 to 2377 cm−1. During the FTIR tests in open air, it was demonstrated that the CO2 molecules bonded to the larger crystallites less and less, whereas the H2O groups could not be eliminated.
3.4. Optical characterization
The optical characteristics of the nanocrystalline MgO particles were investigated using UV–Vis diffuse reflectance spectroscopy (DRS). The results of the analysis of the UV–Vis absorption spectra of MgO nanoparticles from 200 to 800 nm are shown in . The MgO nanoparticles produced by the hydrothermal method exhibited a large absorption peak at 224 nm. The electronic structure, band gap and electronic transition of these samples are related to their linear optical properties.
Figure 7. Diffuse reflectance spectra of the nanocrystalline MgO powders synthesized at (a) different F/O ratios (b) different pH and (c) different annealing temperatures.
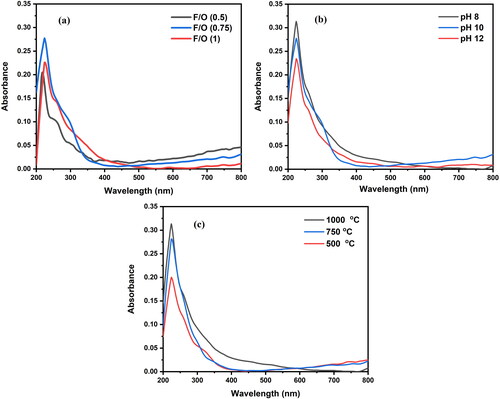
The optical band gaps of the synthesized nanocrystalline MgO powders were determined using fundamental absorption, which occurs when an electron transitions from the valence band to the conduction band. The optical bandgap energies of the samples created in various ways were calculated using Tauc’s relation and the Kubelka–Munk function [Citation6,Citation40].
(12)
(12)
where F(R) is the absorbance and R represents the reflectance.
The absorption coefficient, α, may be expressed as follows:
(13)
(13)
where Eg is the optical energy bandgap, hν is the incident photon energy and A is an absorption constant that depends on the material. The value of n is determined by the transition type. n is 1/2 and 2 for the direct and indirect permissible transitions, respectively. Typically, an indirect transition occurs in amorphous materials. In contrast, a direct transition was observed in substances that were either very crystalline or single crystalline. In polycrystalline materials, the transition may be direct or indirect.
EquationEquations (12)(12)
(12) and Equation(13)
(13)
(13) can be combined to give:
(14)
(14)
Eg values were obtained by extrapolating the linear part of the [F(R)hν]n × hν plot to the photon energy axis [Citation41]. The energy of the band gap can be affected by a variety of factors [Citation42], including the size and shape of the crystallites as well as the presence of impurities [Citation43]. The values of the direct and indirect band gaps determined from the Tauc plots are listed in and are displayed in . presents a comparative analysis of the bandgap widths and average particle size of MgO nanoparticles as reported in various studies.
Figure 8. The Kubelka–Munk elaboration of the nanocrystalline MgO powders synthesized at (a) different F/O ratios (b) different pH and (c) different annealing temperatures.
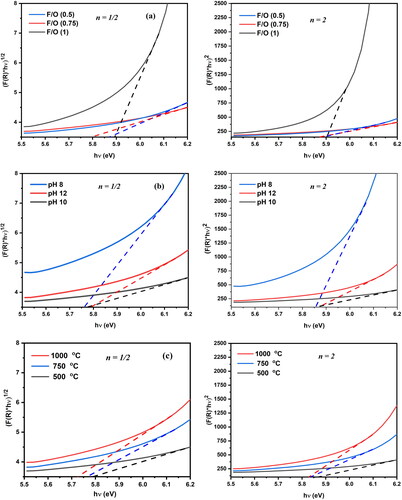
Table 5. Direct and indirect band gap of nanocrystalline MgO powders at various synthesis conditions.
Table 6. Comparison of bandgap widths and average particle size of MgO nanoparticles.
The fuel-to-oxidizer ratios, annealing temperatures and pH values had significant effects on the direct and indirect band gaps of the samples. Variables such as lattice constant, crystallite size, agglomeration and lattice defects influence the energy gap. In samples with these specifications, decreasing band gap energy levels are caused by increasing crystalline size. The absorbance values increased linearly with increasing particle size [Citation44].
The energy gap of the samples decreased as the annealing temperature increased, whereas the threshold absorption wavelength increased. The gap between the conduction and valence bands narrows as the crystals become larger owing to a decrease in the number of atoms inside the crystals and an increase in the level density [Citation45].
4. Conclusions
Nanocrystalline magnesium oxide powders were successfully synthesized using hydrothermal and ultrasonic irradiation methods. Polyvinyl alcohol was used as the fuel, and the oxidizer was magnesium nitrate hexahydrate with weight ratios of 0.25, 0.5, 0.75 and 1. The pH of the mixture was adjusted to values ranging from 8 to 12, and the powders were annealed at different temperatures ranging from 500 °C to 1000 °C. The synthesized nanoparticles were characterized using XRD, FTIR and EDS techniques. The results revealed that the hydrothermal method is susceptible to pH and the fuel-to-oxidizer weight ratio. The XRD analysis confirmed that the MgO nanostructures formed had a cubic structure and that, under fuel-lean conditions (F/O ratio = 0.25), a pure phase of nanocrystalline MgO powder did not form. The XRD results also showed that at a F/O ratio of 0.50, the MgO phase transitioned from amorphous to crystalline, and the highest crystalline size (22.82 nm) and lowest dislocation density (0.0006 nm−2) were observed when the F/O ratio was 0.75. The EDS data indicated that the proportions of Mg and oxygen atoms in the MgO compositions varied significantly under different conditions. The FTIR data showed that the functional groups of magnesium nitrate hexahydrate were primarily converted into MgO nanoparticles, and the band peaking at (418–688 cm−1) is high at pH value 8, then, it reduces at pH 10, and finally, this peak has the smallest size at pH = 12. The direct and indirect band gaps of the samples were noticed in the range of 5.72–5.89 eV and decreased with increasing crystalline size and annealing temperature, and they were significantly influenced by the fuel-to-oxidizer ratios, annealing temperatures and pH values.
Authors’ contributions
Bruska Azhdar: Conceptualization, Methodology, Validation, Investigation, Formal analysis, Data curation, Writing – original draft, Visualization, Conceptualization, Methodology, Validation, Investigation, Formal analysis, Data curation, Writing – review & editing, Visualization, Supervision, Project administration.
Acknowledgements
The author is grateful for laboratory assistance from the Nanotechnology Research Laboratory, Department of Physics, University of Sulaimani. Mr. Sarwar Hasan and Mrs. Znar Saeed deserve special thanks and appreciation for their beneficial recommendations and motivation to pursue the current job.
Disclosure statement
The author declares that he has no known competing financial interests or personal relationships that could have appeared to influence the work reported in this paper. This research did not receive any specific grant from funding agencies in the public, commercial or not-for-profit sectors.
Data availability
All data that support the findings of this study have been included in the article.
References
- Balakrishnan G, Velavan R, Batoo KM, et al. Microstructure, optical and photocatalytic properties of MgO nanoparticles. Res Phys. 2020;16:1. doi: 10.1016/j.rinp.2020.103013.
- Kuekha R, Mubarak TH, Azhdar B, et al. Electromagnetic interference shielding and characterization of Ni2+ substituted cobalt nanoferrites prepared by Sol-Gel auto combustion method. Adv Mater Sci Eng. 2022;2022:1–20. doi: 10.1155/2022/3992402.
- Devaraja PB, Avadhani DN, Prashantha SC, et al. Synthesis, structural and luminescence studies of magnesium oxide nanopowder. Spectrochim Acta A Mol Biomol Spectrosc. 2014;118:847–851. doi: 10.1016/j.saa.2013.08.050.
- Hasan S, Azhdar B. Thermo-dielectric, humidito-dielectric, and humidity sensing properties of barium monoferrite and barium hexaferrite nanoparticles. Res Phys. 2022;42:105962. doi: 10.1016/j.rinp.2022.105962.
- Hasan S, Azhdar B. Synthesis of nickel-zinc ferrite nanoparticles by the sol-gel auto-combustion method: study of crystal structural, cation distribution, and magnetic properties. Adv Condens Matter Phys. 2022;2022:1–14. doi: 10.1155/2022/4603855.
- Chandekar KV, Shkir M, Khan A, et al. Significant and systematic impact of yttrium doping on physical properties of nickel oxide nanoparticles for optoelectronics applications. J Mater Res Technol. 2021;15:2584–2600. doi: 10.1016/j.jmrt.2021.09.072.
- Fernandes M, Rb Singh K, Sarkar T, et al. Recent applications of magnesium oxide (MgO) nanoparticles in various domains. Adv Mater Lett. 2020;11(8):1–10. doi: 10.5185/amlett.2020.081543.
- Rao KV, Sunandana C. Structure and microstructure of combustion synthesized MgO nanoparticles and nanocrystalline MgO thin films synthesized by solution growth route. J Mater Sci. 2008;43(1):146–154. doi: 10.1007/s10853-007-2131-7.
- Rukh S, Sofi AH, Shah MA, et al. Antibacterial activity of magnesium oxide nanostructures prepared by hydrothermal method. Asian J Nanosci Mater. 2019;2:425–430.
- Selvam NCS, Kumar RT, Kennedy LJ, et al. Comparative study of microwave and conventional methods for the preparation and optical properties of novel MgO-micro and nano-structures. J Alloys Compd. 2011;509(41):9809–9815. doi: 10.1016/j.jallcom.2011.08.032.
- Wahab R, Ansari S, Dar MA, et al. Synthesis of magnesium oxide nanoparticles by sol-gel process. MSF. 2007;558–559:983–986. doi: 10.4028/www.scientific.net/MSF.558-559.983.
- Shukla S, Parashar G, Mishra A, et al. Nano-like magnesium oxide films and its significance in optical fiber humidity sensor. Sens Actuators B. 2004;98(1):5–11. doi: 10.1016/j.snb.2003.05.001.
- Camtakan Z, Erenturk S, Yusan S. Magnesium oxide nanoparticles: preparation, characterization, and uranium sorption properties. Environ Prog Sustain Energy. 2012;31(4):536–543. doi: 10.1002/ep.10575.
- Kumar A, Kumar J. On the synthesis and optical absorption studies of nano-size magnesium oxide powder. J Phys Chem Solids. 2008;69(11):2764–2772. doi: 10.1016/j.jpcs.2008.06.143.
- Wayan Sutapa I, Wahid Wahab A, Taba P, et al. Synthesis and structural profile analysis of the MgO nanoparticles produced through the Sol-Gel method followed by annealing process. Orient J Chem. 2018;34(2):1016–1025. doi: 10.13005/ojc/340252.
- Ningombam GS, Nongmaithem RS. Morphology and photoluminescence of self-assembled CaWO4: Sm3+ microspheres: effect of pH and surfactant concentration. Int Nano Lett. 2017;7(2):133–140. doi: 10.1007/s40089-017-0206-2.
- Madani S, Mahmoudzadeh G, Khorrami SA. Influence of pH on the characteristics of cobalt ferrite powder prepared by a combination of sol-gel auto-combustion and ultrasonic irradiation techniques. J Ceram Process Res. 2012;13:123–126.
- Lopez T, Garcia-Cruz I, Gomez R. Synthesis of magnesium oxide by the sol-gel method: effect of the pH on the surface hydroxylation. J Catal. 1991;127(1):75–85. doi: 10.1016/0021-9517(91)90210-U.
- Sharma SK, Pitale SS, Malik MM, et al. Influence of fuel/oxidizer ratio on lattice parameters and morphology of combustion synthesized ZnO powders. Phys B. 2010;405(3):866–874. doi: 10.1016/j.physb.2009.10.005.
- John Sushma N, Prathyusha D, Swathi G, et al. Facile approach to synthesize magnesium oxide nanoparticles by using clitoria ternatea—characterization and in vitro antioxidant studies. Appl Nanosci. 2016;6(3):437–444. doi: 10.1007/s13204-015-0455-1.
- Kandiban M, Vigneshwaran P, Potheher IV. Synthesis and characterization of MgO nanoparticles for photocatalytic applications. Department of Physics, Bharathidasan Institute of Technology (BIT) Campus, Anna University, Tiruchirappalli, Tamilnadu, India; 2015.
- Munusamy TD, Sarmin S, Ong HR, et al. Catalytic performance and antimicrobial activity of Mg(OH)2/MgO colloidal nanoparticles in alkyd resin nanocomposite derived from palm oil. Polym Bull. 2020;77(9):4571–4586. doi: 10.1007/s00289-019-02993-8.
- Saeed Z, Azhdar B, Gan CL. Influence of high temperature on the crystal structure of SrFe12O19 nanoparticle. J Nanomater. 2022;2022:1–11. doi: 10.1155/2022/5467020.
- Aziz C, Azhdar B. Synthesis of dysprosium doped cobalt ferrites nanoparticles by solgel auto-combustion method and influence of grinding techniques on structural, morphological, and magnetic properties. J Magn Magn Mater. 2022;542:168577. doi: 10.1016/j.jmmm.2021.168577.
- Saeed Z, Azhdar B. A novel method for synthesizing narrow particle size distribution of holmium–doped strontium hexaferrite by sol-gel auto-combustion. Mater Res Express. 2020;7(4):045006. doi: 10.1088/2053-1591/ab7f5e.
- Tahmasebi K, Paydar MH. The effect of starch addition on solution combustion synthesis of Al2O3–ZrO2 nanocomposite powder using urea as fuel. Mater Chem Phys. 2008;109(1):156–163. doi: 10.1016/j.matchemphys.2007.11.009.
- Ehi-Eromosele CO, Ita BI, Iweala EEJ. Low-temperature combustion synthesis of cobalt magnesium ferrite magnetic nanoparticles: effects of fuel-to-oxidizer ratio and sintering temperature. J Sol-Gel Sci Technol. 2015;76(2):298–308. doi: 10.1007/s10971-015-3777-2.
- Sijo AK, Lakshmi N, Venugopalan K, et al. Effect of fuel to oxidizer ratio on structural and magnetic properties of ZnCrFeO4 nanopowder. Adv Porous Mat. 2015;2(3):189–191. doi: 10.1166/apm.2014.1071.
- Malligavathy M, Pathinettam Padiyan D. Role of pH in the hydrothermal synthesis of phase pure alpha Bi2O3 nanoparticles and its structural characterization. Adv Mater Proc. 2021;2(1):51–55. doi: 10.5185/amp.2017/112.
- Zhang A, Zhang J, Cui N, et al. Effects of pH on hydrothermal synthesis and characterization of visible-light-driven BiVO4 photocatalyst. J Mol Catal A: Chem. 2009;304(1–2):28–32. doi: 10.1016/j.molcata.2009.01.019.
- Bartonickova E, Cihlar J, Castkova K. Microwave-assisted synthesis of bismuth oxide. PAC. 2007;1(1–2):29–33. doi: 10.2298/PAC0702029B.
- Zeid EFA, Ibrahem IA, Ali AM, et al. The effect of CdO content on the crystal structure, surface morphology, optical properties and photocatalytic efficiency of p-NiO/n-CdO nanocomposite. Res Phys. 2019;12:562–570. doi: 10.1016/j.rinp.2018.12.009.
- Venkateswarlu K, Sandhyarani M, Nellaippan T, et al. Estimation of crystallite size, lattice strain and dislocation density of nanocrystalline carbonate substituted hydroxyapatite by X-ray peak variance analysis. Proc Mater Sci. 2014;5:212–221. doi: 10.1016/j.mspro.2014.07.260.
- Begum A, Hussain A, Rahman A. Effect of deposition temperature on the structural and optical properties of chemically prepared nanocrystalline lead selenide thin films. Beilstein J Nanotechnol. 2012;3:438–443. doi: 10.3762/bjnano.3.50.
- Balamurugan S, Ashna L, Parthiban P. Synthesis of nanocrystalline MgO particles by combustion followed by annealing method using hexamine as a fuel. J Nanotechnol. 2014;2014:1–6. doi: 10.1155/2014/841803.
- Sackey J, Bashir A, Ameh A, et al. Date pits extracts assisted synthesis of magnesium oxides nanoparticles and its application towards the photocatalytic degradation of methylene blue. J King Saud Univer-Sci. 2020;32(6):2767–2776. doi: 10.1016/j.jksus.2020.06.013.
- Ammulu MA, Vinay Viswanath K, Giduturi AK, et al. Phytoassisted synthesis of magnesium oxide nanoparticles from pterocarpus marsupium rox. b heartwood extract and its biomedical applications. J Genet Eng Biotechnol. 2021;19(1):21. doi: 10.1186/s43141-021-00119-0.
- Ansari A, Ali A, Asif M, et al. Microwave-assisted MgO NP catalyzed one-pot multicomponent synthesis of polysubstituted steroidal pyridines. New J. Chem. 2018;42(1):184–197. doi: 10.1039/C7NJ03742B.
- Janet C, Viswanathan B, Viswanath R, et al. Characterization and photoluminescence properties of MgO microtubes synthesized from hydromagnesite flowers. J Phys Chem C. 2007;111(28):10267–10272. doi: 10.1021/jp072539q.
- Trabelsi ABG, Chandekar KV, Alkallas FH, et al. A comprehensive study on Co-doped CdS nanostructured films fit for optoelectronic applications. J Mater Res Technol. 2022;21:3982–4001. doi: 10.1016/j.jmrt.2022.11.002.
- Shkir M, Chandekar KV, Hossain MM, et al. Enhanced dielectric and electrical properties of PbS nanostructures facilely synthesized by low-cost chemical route: an effect of Ce doping concentrations. Mater Chem Phys. 2022;278:125626. doi: 10.1016/j.matchemphys.2021.125626.
- Shkir M, Chandekar KV, Khan A, et al. Tailoring the structure-morphology-vibrational-optical-dielectric and electrical characteristics of Ce@ NiO NPs produced by facile combustion route for optoelectronics. Mater Sci Semicond Process. 2021;126:105647. doi: 10.1016/j.mssp.2020.105647.
- Yadav RS, Kuřitka I, Vilcakova J, et al. Structural, magnetic, optical, dielectric, electrical and modulus spectroscopic characteristics of ZnFe2O4 spinel ferrite nanoparticles synthesized via honey-mediated sol-gel combustion method. J Phys Chem Solids. 2017;110:87–99. doi: 10.1016/j.jpcs.2017.05.029.
- Goh E, Xu X, McCormick P. Effect of particle size on the UV absorbance of zinc oxide nanoparticles. Scr Mater. 2014;78–79:49–52. doi: 10.1016/j.scriptamat.2014.01.033.
- Lv J, Gong W, Huang K, et al. Effect of annealing temperature on photocatalytic activity of ZnO thin films prepared by sol–gel method. Superlattices Microstruct. 2011;50(2):98–106. doi: 10.1016/j.spmi.2011.05.003.
- Nemade K, Waghuley S. Synthesis of MgO nanoparticles by solvent mixed spray pyrolysis technique for optical investigation. Int J Met. 2014;2014:1–4. doi: 10.1155/2014/389416.
- Badar N, Chayed NF, Roshidah R, et al. Band gap energies of magnesium oxide nanomaterials synthesized by the sol-gel method. AMR. 2012;545:157–160. doi: 10.4028/www.scientific.net/AMR.545.157.
- Chayed NF, Kamarulzaman N, Badar N, et al. Effect of Cu doped in MgO on nanostructures and their band gap energies. SSP. 2019;290:323–328. doi: 10.4028/www.scientific.net/SSP.290.323.
- Selvi KT, Mangai KA, Priya M, et al. Effect of solvent and annealed temperature on band gap energies of MgO nanoparticles. 2014 International Conference on Science Engineering and Management Research (ICSEMR); IEEE; 2014. p. 1–6. doi: 10.1109/ICSEMR.2014.7043584.
- Almontasser A, Parveen A, Azam A. Synthesis, characterization and antibacterial activity of magnesium oxide (MgO) nanoparticles. IOP Conference Series: Materials Science and Engineering. IOP Publishing; 2019. p. 012051. doi: 10.1088/1757-899X/577/1/012051.
- Thamilvanan D, Jeevanandam J, Hii YS, et al. Sol-gel coupled ultrasound synthesis of photo-activated magnesium oxide nanoparticles: optimization and antibacterial studies. Can J Chem Eng. 2021;99(2):502–518. doi: 10.1002/cjce.23861.
- Bindhu M, Umadevi M, Micheal MK, et al. Structural, morphological and optical properties of MgO nanoparticles for antibacterial applications. Mater Lett. 2016;166:19–22. doi: 10.1016/j.matlet.2015.12.020.
- Krishnamoorthy K, Manivannan G, Kim SJ, et al. Antibacterial activity of MgO nanoparticles based on lipid peroxidation by oxygen vacancy. J Nanopart Res. 2012;14(9):1–10. doi: 10.1007/s11051-012-1063-6.