
 ?Mathematical formulae have been encoded as MathML and are displayed in this HTML version using MathJax in order to improve their display. Uncheck the box to turn MathJax off. This feature requires Javascript. Click on a formula to zoom.
Abstract
The thermal decomposition of complex oxide phases, such as perovskite, in the La2O3-Lu2O3-Yb2O3 systemwith a specific surface area of 37 m2/g, synthesised by the heterogeneous precipitation method under non-isothermal conditions of linear heating at a rate of 5 deg/min, was studied to reveal the features of structure changes in intermediate products. Thermogravimetric and adsorption-structural analyses, infrared spectroscopy, powder diffraction and electron microscopy revealed that the decomposition of precursors occurs in two main stages. Up to 700 °C, the initial coordination spheres are destroyed in a sequential manner, resulting in the powders remaining amorphous in phase composition. However, with a gradual increase in the order of the atoms, the change in the pore structure is non-monotonic, with an inflection point observed at 450 and 675 °C. At 675 °C, the system undergoes a collapse, accompanied with decrease in both the pore volume (V∑) and the specific surface area (SBET), which attain the lowest values of 0.0415 cm3/g and 16.5 m2/g, respectively. The second stage of decomposition of the precursor in the temperature range of 750-825 °C is associated with the formation and accumulation of the crystalline phase of perovskite in the form of a nanodispersed mesoporous powder with a specific surface area of 18 m2/g and the average mesopore diameter of 17 nm corresponding to a particle size of 40 nm when using the calculated X-ray density of 8.26 g/cm3.
1. Introduction
The development of technologies for creating transparent functional ceramics represents a promising area of modern materials science. However, it is necessary to have initial materials with specific properties, including nanopowders of complex oxide phases LnLn’O3 (Ln, Ln’ = REE) with a perovskite-type structure. Over the past two decades, these materials have become increasingly the focus of research due to their diverse physical and chemical properties. Perovskite-type nanoparticles exhibit a range of properties which have led to their exploitation in a number of scientific and technological applications. These include optical [Citation1], magnetic [Citation2], photovoltaic [Citation3], electrical and microwave [Citation4] properties etc.
A variety of techniques were employed to synthesize such nanopowders, including mechanosynthesis [Citation4–6], gas-phase (plasma chemical synthesis) [Citation7], pyrolysis [Citation8,Citation9], chemical deposition from solutions [Citation10–14], hydrothermal [Citation15,Citation16], and sol-gel [Citation17,Citation18] methods. However, there are a number of general requirements for the structural and morphological parameters of nanopowders that are crucial for the fabrication of transparent ceramics. These include morphological stability, geometric shape, high size uniformity, low agglomeration, high degree of crystallinity and phase composition stability. The distinctive feature of the technological process of producing nanopowders is the dependence of the structural-phase and particle size state on the synthesis method.
The authors focused on a method of chemical precipitation, followed by thermal treatment of the precursor, which allows for the production of particles with a narrow size distribution. This method enables the control over the phase, chemical composition, particle size and agglomeration degree of nanopowders, as well as the achievement of a uniform distribution of ions in the solution by altering the precipitation parameters, such as reagent concentration, precipitant type, order and rate of mixing, synthesis temperature, and pH value [Citation19].
The literature contains information on the synthesis of powders to obtain isotropic ceramics based on cubic solid solutions of rare earth oxide (REE) compounds. In [Citation10], the synthesis of (Lu0.95Eu0.05)2O3 by heterogeneous deposition from REE chlorides in ammonium bicarbonate is reported. The synthesis of Er3+:Lu2O3 [Citation14] was carried out by the method of deposition from REE nitrates, with ammonium hydroxide employed as a precipitant The synthesis of transparent ceramics based on Nd3+:Lu2O3 [Citation13] was carried out by the method of deposition from REE nitrates in a mixture of NH4OH + NH4HCO3 solutions.
This research examines the properties of LaLuO3 doped with Yb3+ ions. Whereas the properties of pure LaLuO3 have been investigated in several previous studies, including optical and structural [Citation1], physicochemical and electrical [Citation20], and photoluminescence [Citation21]. Ovanesyan K.L. [Citation22] suggests the potential use of this material as a laser medium, and it is also used as a high-k dielectric for the gate semiconductor transition [Citation23,Citation24].
To the best of our knowledge, there were no data on the thermal decomposition of the compound synthesised by the chemical co-precipitation method to obtain LaLuO3:Yb3+. Therefore, the objective of this study was to investigate the thermal decomposition of the intermediate and final products of the precursor in order to obtain nanopowders of complex oxide phases LnLn’O3 (Ln, Ln’ = REE) with a perovskite-type structure in the La2O3-Lu2O3-Yb2O3 system under non-isometric decomposition conditions at a constant heating rate, allowing the synthesis of nanoparticles with varying dispersions, suitable for the fabrication of transparent anisotropic laser ceramics.
2. Experimental section
The precursor was synthesised by heterogeneous co-precipitation of a mixture of rare-earth elements (La3+ and Lu3+) nitrate solutions with 3% Yb3+ luminescent additive (La2O3 99.99% LaO-1 grade; Lu2O3 99.99% Merck Corp.; Yb2O3 99.99% Merck Corp.). The concentration of the Ln3+ nitrate solution was 0.1 mol/l, and the temperature of the solution during the precipitation of the mixture was 80 °C. A 1 M ammonia (analytical grade) solution containing 5% urea (analytical grade) was used as a precipitant. The precipitate was separated from distilled water by triple centrifugation and single centrifugation in the presence of ethyl alcohol. It was then dried at 120 °C for 24 h. The thermal decomposition of the synthesised precursor was carried out under non-isothermal conditions at a heating rate of 5 deg/min. To study the structure, the precursor synthesised under these conditions and the intermediate products of its thermal decomposition were used at temperatures determined by thermogravimetric analysis in accordance with the differential thermal analysis (DTA) curve.
A number of physicochemical methods were used to study the properties of the samples, including X-ray diffraction analysis (XRD), adsorption and structural analysis, thermogravimetric analysis, transmission (TEM) and scanning (SEM) electron microscopy, and infrared spectroscopy (IR).
X-ray diffraction patterns were recorded in continuous mode using a multifunctional X-ray diffractometer SmartLab SE with a nickel filter to analyse the phase composition of the samples. The porous structure of the obtained samples was investigated by the adsorption-structural static volumetric method utilising the ASAP 2000 M (Accelerated Surface Area and Porosimetry System), which is designed to obtain adsorption isotherms of gases, including nitrogen, argon, krypton and other non-aggressive gases, followed by their calculation. Thermogravimetric analysis was performed using a DQ 1000 derivatograph with maximum temperature of 1000 °C. The electronic structure was investigated using transmission electron microscopy (TEM) on a JEOL JEM-2100F instrument and scanning electron microscopy (SEM) on a MIRA3 Tescan instrument, with a thin layer of Au/Pd = 50/50 deposited on the samples for SEM analysis. TEM data analysed using CrystBox [Citation25]. IR spectra were recorded on a Fourier-spectrometer FCM 1202 (Ltd. ‘Infraspectr’) in the wavelength range of 400 to 4000 cm−1 using the KBr pellets technique. The powder material was mixed with KBr powder at a ratio of 1:300 mg and pressed into transparent round tablets with a diameter of 13 mm.
3. Results and discussion
3.1. Investigation of the precursor thermal decomposition
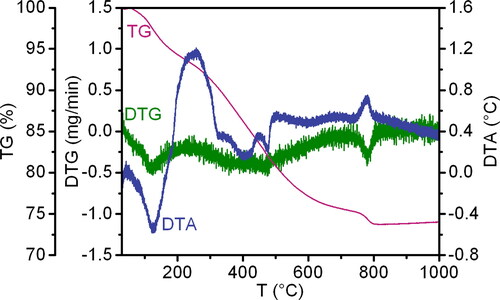
Thermogravimetry (TG), differential thermogravimetry (DTG), and differential thermal analysis (DTA) were utilised to ascertain that the precursor (sample with a specific surface area BET of 37 m2/g) undergoes thermal decomposition in multiple stages. Each stage is accompanied by mass loss and the presence of endo- or exo-effects. As the decomposition process continues, the dissociation products are removed, contributing to the formation of a rigid framework and pore space with changing parameters.
The data from the differential thermal and thermogravimetric analyses of the precursor are presented in . The DTA curve of the precursor indicates the presence of six distinct extremes: two exothermic and four endothermal effects. This suggests that the thermal breakdown process occurs in six stages. The initial stage is characterised by an intense endothermic peak on the DTA curve within the low temperature range of 50-180 °C. This peak is associated with the removal of adsorbed and structurally bound water. The second stage, which is recorded in the temperature range of 180-325 °C, is accompanied by an intense exothermic effect and occurs as a result of the beginning of decomposition of the main compound for the formation of which urea (NH2CONH2) was used. It is presumed that the chemical activity of the NH2 ligand contributes to the release of a large amount of energy during thermal decomposition. The subsequent three stages of decomposition on the DTA curve are accompanied by endothermic peaks of medium intensity in the temperature range 325-450 °C and 450-500 °C, as well as low intensity in the temperature range 500-700 °C. At the final stage of thermal decomposition in the elevated temperature range of 750-800 °C, an intense exothermic effect is observed, which is presumed to correspond to the crystallisation of the final product. Each effect of the DTA curve is associated with a mass loss on the TG curve. Therefore, the primary decomposition of the synthesised precursor, as indicated by DTG data, occurs within the temperature range of 180-500 °C (from the second to the fourth stage of decomposition). This process is characterised by the intensive destruction of the formed complex compound, which is accompanied by the greatest mass loss. The fifth stage of destruction, which is associated with the intra-complex rearrangement of atoms and molecules, is not accompanied by a significant mass loss. The total mass loss of the sample is 26%.
Figure 1. The DTG, TG, and DTA curves of the synthesized precursor powder.
Thus, according to the thermogravimetric analysis, the temperature range of the probable existence of intermediate metastable samples of the thermal decomposition of the synthesised precursor was chosen for further study of the evolution of the precursor structure when obtaining nanopowders of complex oxide phases LnLn’O3 (Ln, Ln’ = REE) of the perovskite type in the La2O3-Lu2O3-Yb2O3 system. The temperature ranges are as follows: I: 20-180 °C; II: 180-325 °C; III: 325-450 °C; IV: 450-500 °C; V: 500-700 °C; VI: 700-750 °C; VII: 750-825 °C.
3.2. FTIR analysis
The infrared spectra of the thermal decomposition of the precursor in the temperature range of 180-1000 °C and the formation of perovskite LnLn’O3 were studied. The results are presented in .
Figure 2. The IR spectra of the precursor samples obtained following thermal decomposition at temperatures ranging from 120 to 1000 °C.
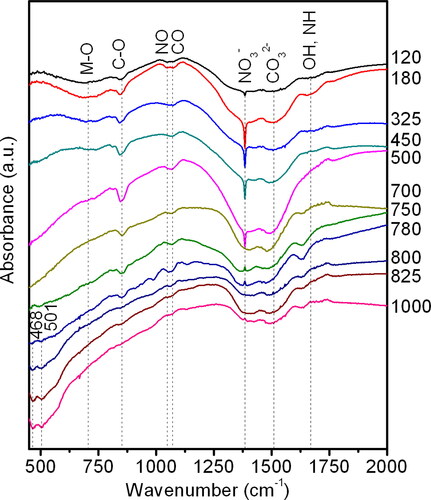
The analysis of the IR spectra revealed that the raw sample of the precursor exhibited a broad type of absorption bands, which is indicative of a disorder in the system under investigation. The absorption bands in the frequency range of approximately ν ∼ 800-450 cm−1 correspond to M-O vibrations, where M = La, Lu. The band at approximately ν ∼ 844 cm−1 corresponds to C-O vibrations of carbonate ions. In the frequency range of approximately ν ∼ 1120-1020 cm−1, absorption bands for both C-O and N-O vibrations are present. The absorption bands within the frequency range of approximately ν ∼ 1600-1150 cm−1 are indicative of the vibrations of carbonate and nitrate ions in various monodentate and bidentate coordination. A narrow peak at approximately ν ∼ 1384 cm−1 corresponds to the presence of nitrate complexes. Weak absorption bands within the frequency range of approximately ν ∼ 1740-1620 cm−1 are indicative of C = O, NH, and OH vibrations [Citation14,Citation26–28].
The thermal decomposition of the precursor at a temperature of 180 °C results in an increase in the intensity of the absorption bands in the IR spectrum. Between the temperatures of 325-500 °C, the precursor undergoes decomposition. At 450 °C, a peak with a frequency of approximately ν ∼ 480 cm−1 appears, and its intensity increases with the temperature. Furthermore, a reduction in the intensity of bands within the frequency range of approximately ν ∼ 750-600 cm−1 is observed. At 700 °C, the absorption band with a frequency of approximately ν ∼ 1386 cm−1, which characterises the presence of nitrate ions, disappears.
Starting at a temperature of 750 °C, two peaks appear with frequencies of approximately ν ∼ 468 and 501 cm−1, corresponding to the process of perovskite ordering and crystallisation. The intensities of these peaks increase with further temperature growth, while the absorption band characterising the amorphous phase narrows. In the temperature range of 800-1000 °C, a decrease in the intensity of the carbonate ion absorption bands is observed. The presence of weak carbonate bands may be attributed to the coexistence of intermediate decomposition products with products of a lower degree of decomposition, given that the structure of the samples is a combination of intermediate products of different degrees of decomposition. A gradient in composition and structure is observed within a nanodispersed formation, with the internal structural regions lagging behind the surface ones in terms of decomposition. The obtained nanopowder has a fine pore structure with an average diameter of 16-17 nm, as determined by data from the adsorption-structural method. Decomposition products can be retained on the surface of such pores due to the surface potential, but their amount is insignificant, since XRD records only the perovskite phase. Furthermore, lanthanides have a strong tendency to absorb water and carbon dioxide, which can be observed in the infrared spectra of these compounds [Citation27] as absorption peaks of OH, CO, and carbonate groups.
As a result, the process of precursor decomposition and internal rearrangement is observed up to 700 °C. The primary decomposition of the synthesized precursor takes place within the temperature range of 180-500 °C, which corresponds to the intensive destruction of the formed complex compound. In the temperature range of 500-700 °C, atoms and molecules undergo intra-complex rearrangement. Subsequently, at temperatures above 750 °C, the perovskite LaLuO3:Yb3+ begins to order and crystallise.
3.3. Adsorption-structural studies of the pore structure
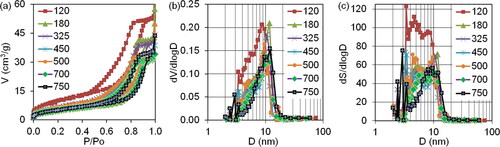
The adsorption-structural analysis () reveals that the isotherms of nitrogen sorption on the prepared samples belong to the type IV isotherms according to the Brunauer, Deming, Deming and Teller classification (BDDT). This classification characterises the samples as mesoporous nanodisperse bodies [Citation29]. The type of hysteresis loops on the isotherms of the samples obtained up to the heating temperature of 700 °C remains practically unchanged. According to the IUPAC classification, it should be classified as an H2 type, which corresponds to an intermediate type of pore structure for samples that are corpuscular [Citation30]. It is important to highlight that the precursor synthesized under these conditions (initial drying at 120 °C) exhibits the highest overall porosity characteristics (V and S) and a bimodal size distribution of mesopore volumes and surfaces, with the main equivalent average diameters ranging from 4.65 to 8.7 nm. The differential size distribution of the volumes and surfaces of the mesopores maintains its bimodal nature up to 700 °C as the heating temperature increases. However, the main average equivalent diameters of the bimodal ranges gradually increase to 6 and 10.7 nm at 700 °C.
Figure 3. The nitrogen sorption isotherms (a) and differential size distribution of mesopore volumes and surfaces (b, c) on the intermediate samples after precursor thermal decomposition at temperatures up to 750 °C.
It is evident from that the relationship between the general characteristics of porosity and temperature is not monotonous. Inflection points are fixed at 450 and 675 °C.
Figure 4. The temperature dependence of the general characteristics of the samples porosity during the thermal decomposition of the precursor is investigated. Where: Vsum (cm3/g) – the total pore volume within the measurement range of the adsorption-structure method (0.3-300 nm); SBET (m2/g) – the specific surface area, calculated by the BET method; vme (cm3/g), sme (m2/g) – the total volume and specific surface area of the mesopores, calculated by the BJH method; DavgBET, DavgBJH (nm) – the average equivalent pore diameter, calculated using the BET and BJH methods.
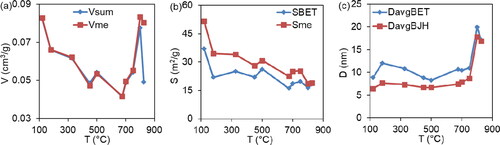
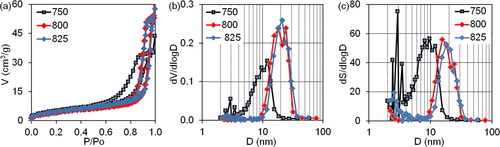
A temperature rise above 750 °C results in a change of the hysteresis loops to H1 (), indicating that the samples are homogeneously packed agglomerates or globule pellets of the same size. The mesopore volumes and surfaces exhibit differential size distributions that become unimodal, with average equivalent mesopore diameters of 17-18 nm. The thermal decomposition process is characterised by essential temperatures of 450 and 675 °C. The relationship between total porosity characteristics and temperature is reflected in the changes in slope angle. For example, the total pore volume within the measuring range of the method (3-300 nm) and the volume of the mesopores () significantly increase with a slight decrease in surface area as the temperature rises. Furthermore, as the temperature exceeds 750 °C, the average equivalent diameter of the mesopores sharply increases (). Thus, the precursor undergoes thermal decomposition up to 750 °C, with subsequent heating leading to the formation and accumulation of the final product.
Figure 5. The nitrogen sorption isotherms (a) and differential size distribution of mesopore volumes and surface areas (b, c) on intermediate samples after precursor thermal decomposition at a temperature range of 750-825 °C.
3.4. XRD analysis
X-ray powder diffraction analysis indicates that the evolution of the structure during the thermal decomposition of the synthesized precursor can be divided into two main stages. The first stage is the decomposition of the complex chemical compound formed after co-precipitation. The second stage is the crystallization of the perovskite phase.
Amorphous solids lack long-range order, yet their atomic arrangement can exhibit near-order. If the curve of a well-crystallised form is unknown, the diffraction pattern only provides a set of distances with poor accuracy due to the width of the lines. Furthermore, an amorphous diffraction pattern can also be produced by the crystals with a very small size.
During the initial stage of synthesized precursor decomposition, XRD patterns of the powder samples obtained at temperatures ranging from 120 to 700 °C show two broad faint peaks (halo) first from 22° to 38° and second from 38° to 70° (). This suggests that all this samples are composed of an amorphous phase. Although their XRD patterns are highly similar, there are some notable differences. For the samples heated at temperatures ranging from 120 to 325 °C, the diffraction pattern of the amorphous phase in terms of its shape resembles that of LaLuO3:Yb3+ (perovskite) (see ). They exhibit a sharp triangular shape for the first halo, with the apex located at approximately 30°. The width of the second halo between 38 and 60° is approximately 22°, with the centre shifted towards the smaller angles. This indicates that the average distance between interatomic bonds is greater, resulting in a lower density of the powder.
Figure 6. The diffraction patterns of the synthesised precursor samples during the first stage of thermal decomposition at temperatures ranging from 120 to 700 °C.
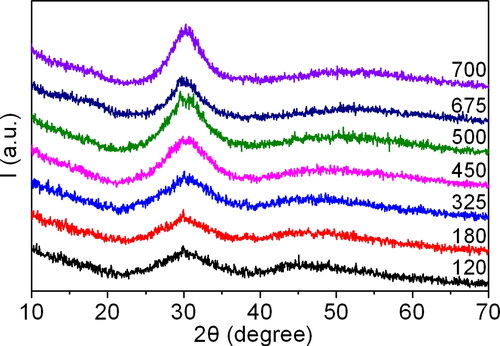
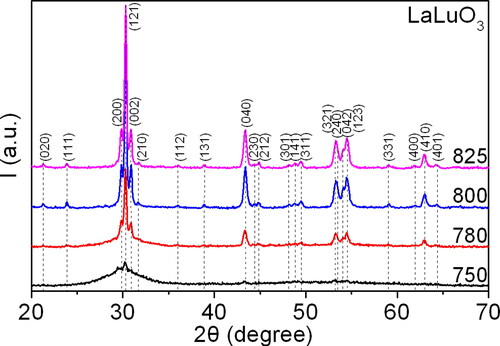
Figure 7. The diffraction patterns of the synthesised precursor samples during the second stage of thermal decomposition at temperatures ranging from 750 to 825 °C.
Whereas, the diffraction patterns of the intermediate samples, obtained following thermal decomposition of the precursor at temperatures ranging from 450 to 700 °C, demonstrate the broad peak at ∼30°. The maximum value of its intensity is reached at 700 °C. At 675 °C, a third halo at 12-20° is formed, which diminishes as the temperature rises to 700 °C. The shape of the second halo undergoes a gradual change, becoming increasingly smooth and broad, extending up to 65°. This is accompanied by a shift in the halo’s centre towards larger angles. Concurrently, the background intensity decreases, suggesting an enhancement of atomic ordering. This could be attributed to the formation of ordered domains within the amorphous matrix, which are characteristic of REE carbonates, hydrides, or carbohydrates.
In the temperature range of 120 to 700 °C, the interatomic distances vary and internal structural rearrangement occurs. Therefore, complex compound decomposition and internal rearrangement occur during the precursor thermal decomposition process. A powder with gradually increasing atomic ordering is formed, as indicated by a reduction in background and a qualitative change.
The second main stage of precursor decomposition in the preparation of nanopowders of complex perovskite-type oxide phases LnLn’O3 (Ln, Ln’ = REE) is associated with the formation and accumulation of the perovskite crystal phase in the La2O3-Lu2O3-Yb2O3 system (see ). Consequently, when the temperature exceeds 700 °C, the perovskite phase commences crystallisation.
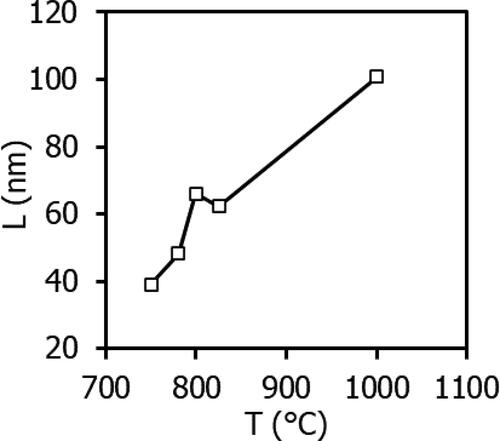
The process of crystallisation is non-uniform. Initially, at temperatures between 750 and 780 °C, the size of the crystallites of the perovskite-type phase LaLuO3:Yb3+ increases rapidly. However, this growth then slows down (see ). The size of the crystallites was estimated using Scherrer’s formula [Citation31]:
where L (nm) – average crystallite size; K – particle shape factor constant (typically equal to 0.94); λ (Å) – X-ray wavelength; B (degree) – full width at half maximum of the peak; θ (degree) – diffraction angle.
Figure 8. The dependence of the sample crystallite size on temperature.
A comparison of the lattice period data presented in with the literature data reveals that the obtained precursor has a higher theoretical density. For reference, the lattice periods in [Citation2] are a = 0.6022 nm, b = 0.8380 nm, c = 0.5826 nm, resulting in ρXRD = 8.175 g/cm3.
Table 1. Unit cell periods (a, b, c), theoretical density ρXRD and equivalent diameter dBET of precursor samples after thermal decomposition at temperatures from 750 to 1000 °C.
3.5. SEM and TEM analysis
presents a SEM micrograph and the particle size distribution of LaLuO3:Yb3+ nanopowder. The powder comprises nanosized globular particles with a narrow size distribution and an average size of 17 nm. The particle size distribution from SEM data was based on the image analysis of more than 140 particles. Owing to their small size, the particles tend to combine and form aggregates, which are irregularly shaped and have an average size of approximately 500 nm. The aggregates exhibit a branched cellular structure.
Figure 9. Typical SEM micrographs (a, b), particle size distribution (c) and EDS spectrum (d) of the final product particles resulting from the thermal decomposition of the synthesized precursor.
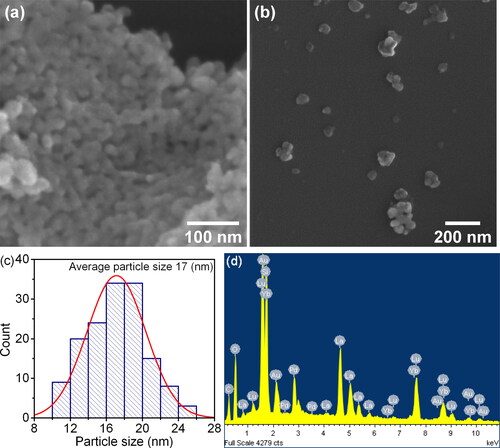
The elemental composition of the obtained compound was compared using EDS analysis at three points to determine the number and ratio of lutetium and lanthanum atoms present. The analysis revealed that the number of lutetium atoms in the perovskite composition exceeded that of lanthanum atoms. The reason for this is currently unknown. A representative example of the typical EDS spectrum of the final product of thermal decomposition of the synthesised precursor is presented in .
The TEM image () depicts a perovskite particle comprising a monocrystalline constituent, as evidenced by its SAED pattern (). The unit cell parameters, as determined by XRD analysis, were employed to assign Miller indices to electron diffraction spots via the CrystBox software. The microstructure (illustrated in ) reveals that the aggregates contain pores located between particles. The microdiffraction image displays well-crystallised monocrystalline particles with varying degrees of defectiveness, as evidenced by individual reflexes nearly aligned on the same imaginary line. The absence of well-defined rings may be attributed to the mixture of monocrystalline nanoparticles that overlap each other.
Figure 10. (a) TEM image of a perovskite particle with corresponding (b) SAED pattern along [723] zone axis, and polycrystalline agglomerate of perovskite particles with corresponding SAED pattern (c, d) along zone axis.
![Figure 10. (a) TEM image of a perovskite particle with corresponding (b) SAED pattern along [723] zone axis, and polycrystalline agglomerate of perovskite particles with corresponding SAED pattern (c, d) along [7¯45] zone axis.](/cms/asset/96ff2da5-a10c-43a0-9fe0-63308afdf474/tjen_a_2366269_f0010_b.jpg)
Particle porosity is a characteristic feature of the crystallisation method of inorganic precursors. This phenomenon is attributed to the release of gaseous products, such as H2O and CO2, during the thermal decomposition of the amorphous precursor.
4. Conclusions
The precursor synthesised has an amorphous structure and is defined as nanodisperse mesoporous powders with a broad size distribution of the mesopores.
The investigation of the thermal decomposition products of the synthesised precursor under non-isothermal conditions of linear heating at a rate of 5 deg/min aimed to produce a perovskite-type nanopowder of complex oxide phases LnLn’O3 (Ln, Ln’ = REE). The thermal decomposition process may be divided into three main stages: decomposition of the complex chemical compound formed after precipitation, intra-complex regrouping of atoms and molecules, and perovskite phase crystallisation. Up to almost 700 °C, the initial coordination spheres break down in a sequential manner, accompanied by internal rearrangement, while the phase composition remains amorphous. However, as the ordering of atomic structures increases gradually, there is a non-linear change in pore structure, with a kink observed at temperatures of 450 and 675 °C. Further elevation in temperature between 750 and 825 °C leads to the formation and accumulation of a crystalline phase of perovskite in the La2O3-Lu2O3-Yb2O3 system.
The process of crystallisation is non-uniform. Initially, crystallites of the perovskite-type phase LaLuO3:Yb3+ increase rapidly at temperatures between 750 and 780 °C. Subsequently, the growth rate slows down, while changes in the pore structure become apparent. Specifically, the mesopore volume and average equivalent diameter of the mesopores increase rapidly. The precursor was decomposed, resulting in a mesoporous powder with an average mesopore diameter of 17 nm and a specific surface area of 18 m2/g. The particle size was calculated to be 40 nm using an X-ray density value of 8.26 g/cm3. TEM data show similar particle size values, while SEM analysis registers an average size of 17 nm.
Authors’ contributions
All authors contributed to the study conception and design. Material preparation, data collection and analysis were performed by Lobunets Tatiana, Chudinovych Olga, Shyrokov Oleksandr, Tomila Tamara and Ragulya Andrey. The first draft of the manuscript was written by Lobunets Tatiana, Shyrokov Oleksandr and Tomila Tamara and all authors commented on previous versions of the manuscript. All authors read and approved the final manuscript.
Disclosure statement
The data generated or analysed during this research are included in this published article.
Data availability statement
Research data are not shared.
Additional information
Funding
References
- Tryus M, Nikolaev KV, Makhotkin IA, et al. Optical and structural characterization of orthorhombic LaLuO3 using extreme ultraviolet reflectometry. Thin Solid Films. 2019;680:94–101. doi: 10.1016/j.tsf.2019.04.037.
- Ito K, Tezuka K, Hinatsu Y. Preparation, magnetic susceptibility, and specific heat on interlanthanide perovskites ABO3 (A = La–Nd, B = Dy–Lu). J Solid State Chem. 2001;157(1):173–179. doi: 10.1006/jssc.2000.9071.
- Njema GG, Kibet JK, Ngari SM. A review of interface engineering characteristics for high performance perovskite solar cells. Measurement: Energy. 2024;2:100005. doi: 10.1016/j.meaene.2024.100005.
- Varghese J, Joseph T, Sebastian MT, et al. Crystal structure and microwave dielectric properties of LaLuO3 ceramics. J Amer Ceram Soc. 2010;93(10):2960–2963. doi: 10.1111/j.1551-2916.2010.03930.x.
- Fabián M, Arias-Serrano BI, Briančin J, et al. Mechanosynthesis and electrical conductivity of undoped and calcium-substituted GdAlO3 perovskites. J Alloys Compd. 2023;965:171374. doi: 10.1016/j.jallcom.2023.171374.
- Kolesnichenko V, Yurchenko Y, Kornienko O, et al. Spark plasma sintering of a ceramic material with a LaLuO3 perovskite-type structure. NHC. 2024;43:1–11. doi: 10.4028/p-DnGZ2B.
- Zhang H, Goh BHH, Chong CT, et al. A review of flame aerosol synthesis technology for the synthesis of nanoparticles and functional energy materials. J Solid State Chem. 2024;336:124774. doi: 10.1016/j.jssc.2024.124774.
- Gao Y, Ma W, Meng X, et al. Phase composition and thermal properties of Yb-Gd co-doped SrZrO3 coating prepared by the solution precursor plasma spray. J Therm Spray Tech. 2021;30(5):1174–1182. doi: 10.1007/s11666-021-01201-2.
- Pal DR, Kant KM. Synthesis and characterization of nanocrystalline Ce0.9Gd0.1O2-δ powders with ameliorated ionic conductivity by citrate combustion route. J Mater Sci: mater Electron. 2023;34(14):1134. doi: 10.1007/s10854-023-10499-3.
- Dulina NA, Baumer VN, Danylenko MI, et al. Effects of phase and chemical composition of precursor on structural and morphological properties of (Lu0.95Eu0.05)2O3 nanopowders. Ceram Int. 2013;39(3):2397–2404. doi: 10.1016/j.ceramint.2012.08.092.
- Ahmadi S. Synthesis and characterization of aluminum-yttrium perovskite powder using a co-precipitation technique. Synth Sinter. 2022;2(4):170–175. doi: 10.53063/synsint.2022.24135.
- Tripathi H, Sharma JD, Kumar S, et al. Effect of La2O3 as sintering aid on the structural, mechanical & electrical properties of Y2O3. Mater Sci Eng. 2024;303:117259. doi: 10.1016/j.mseb.2024.117259.
- Zhou D, Ren Y, Xu J, et al. Fine grained Nd3+:Lu2O3 transparent ceramic with enhanced photoluminescence. J Eur Ceram Soc. 2014;34(8):2035–2039. doi: 10.1016/j.jeurceramsoc.2014.01.038.
- Serivalsatit K, Wasanapiarnpong T, Kucera C, et al. Synthesis of Er-doped Lu2O3 nanoparticles and transparent ceramics. Opt Mater. 2013;35(7):1426–1430. doi: 10.1016/j.optmat.2013.02.013.
- Zahra T, Alotaibi BM, Alrowaily AW, et al. Facile hydrothermal synthesis of cerium aluminate (CeAlO3) and its composite with reduced graphene oxide (rGO) as an outstanding supercapacitor electrode. J Storage Mater. 2024;87:111457. doi: 10.1016/j.est.2024.111457.
- Spiridigliozzi L, Ferone C, Cioffi R, et al. New insights in the hydrothermal synthesis of rare-earth carbonates. Materials (Basel). 2019;12(13):2062. doi: 10.3390/ma12132062.
- Assirey EAR. Perovskite synthesis, properties and their related biochemical and industrial application. Saudi Pharm J. 2019;27(6):817–829. doi: 10.1016/j.jsps.2019.05.003.
- Navas D, Fuentes S, Castro-Alvarez A, et al. Review on sol-gel synthesis of perovskite and oxide nanomaterials. Gels. 2021;7(4):275. doi: 10.3390/gels7040275.
- Abid N, Khan AM, Shujait S, et al. Synthesis of nanomaterials using various top-down and bottom-up approaches, influencing factors, advantages, and disadvantages: a review. Adv Colloid Interface Sci. 2022;300:102597. doi: 10.1016/j.cis.2021.102597.
- Radtke C, Krug C, Soares GV, et al. Physicochemical and electrical properties of LaLuO3/Ge(100) structures submitted to postdeposition annealings. Electrochem Solid-State Lett. 2010;13(5):G37. doi: 10.1149/1.3322517.
- Ueda K, Tanaka S, Yoshino T, et al. Site-selective doping and site-sensitive photoluminescence of Eu3+ and Tb3+ in perovskite-type LaLuO3. Inorg Chem. 2019;58(16):10890–10897. doi: 10.1021/acs.inorgchem.9b01273.
- Ovanesyan KL, Petrosyan AG, Shirinyan GO, et al. Czochralski single crystal growth of Ce- and Pr-doped LaLuO3 double oxide. J Cryst Growth. 1999;198-199:497–500. doi: 10.1016/S0022-0248(98)01091-4.
- Gomeniuk YY, Gomeniuk YV, Nazarov A, et al. Electrical properties of high-k LaLuO3 gate oxide for soi mosfets. AMR. 2011;276:87–93. doi: 10.4028/www.scientific.net/AMR.276.87.
- Volk C, Schubert J, Schnee M, et al. LaLuO3 as a high-k gate dielectric for InAs nanowire structures. Semicond Sci Technol. 2010;25(8):085001. doi: 10.1088/0268-1242/25/8/085001.
- Klinger M. More features, more tools, more CrysTBox. J Appl Crystallogr. 2017;50(4):1226–1234. doi: 10.1107/S1600576717006793.
- Salavati-Niasari M, Hosseinzadeh G, Davar F. Synthesis of lanthanum carbonate nanoparticles via sonochemical method for preparation of lanthanum hydroxide and lanthanum oxide nanoparticles. J Alloys Compd. 2011;509(1):134–140. doi: 10.1016/j.jallcom.2010.09.006.
- Mousavi-Kamazani M, Alizadeh S, Ansari F, et al. A controllable hydrothermal method to prepare La(OH)3 nanorods using new precursors. J Rare Earths. 2015;33(4):425–431. doi: 10.1016/S1002-0721(14)60436-1.
- Nakamoto K. Infrared and Raman spectra of inorganic and coordination compounds: part A: theory and applications in inorganic chemistry. 1st ed. Wiley, Hoboken, New Jersey; 2008. doi: 10.1002/9780470405840.
- Greg S, Singh K. Adsorption, specific surface area, porosity. Moscow: Mir; 1984.
- Everett DH. Manual of symbols and terminology for physicochemical quantities and units, Appendix II: definitions, terminology and symbols in colloid and surface chemistry. Pure Appl Chem. 1972;31(4):577–638. doi: 10.1351/pac197231040577.
- Langford JI, Wilson AJC. Scherrer after sixty years: a survey and some new results in the determination of crystallite size. J Appl Crystallogr. 1978;11(2):102–113. doi: 10.1107/S0021889878012844.