Abstract
Crystallite size distributions and particle size distributions were determined by transmissions electron microscopy (TEM), X-ray powder diffraction (XRD), and small-angle X-ray scattering (SAXS) for three commercially available TiO2 powders (P25, UV100, and TiO2_5 nm) and one SSEC produced powder (SSEC78). The theoretical Guinier model was fitted to the experimental obtained XRD data and compared to analytical expressions. Modeling of the XRD spectra showed a difference between the analytical size dependent expressions and the theoretical Guinier model. Primary particle size distributions were extracted from SAXS measurements by the hard sphere model including an interparticle interference factor. The sizes obtained from SAXS were smaller than the sizes obtained from the XRD experiments; however, a good agreement was obtained between the two techniques. Electron microscopy confirmed the primary particle sizes and the shapes obtained by XRD and SAXS. The SSEC78 powder and the commercially available powders showed different morphologies, but SSEC78, UV100, and TiO2_5 nm all consisted of both primary particles as well as a secondary structure comprised of nanosized primary particles agglomeration into larger clusters. P25 showed the largest primary particle size, but did not show a secondary structure.
Keywords:
1. Introduction
Production of nanopowders for various applications has gained considerable commercial interest during the last few years. Quality and reproducibility are essential if the nanopowders are to be used in large-scale commercial applications. Furthermore, the ability to characterize various physical and chemical properties of these powders is critical to the increased acceptance and use of nanoparticles Citation1, Citation2.
In many industrial applications the activity of nanoparticles is size dependent and the price of nanoparticles depends on powder characteristics such as particle size, size distribution, and purity. As an example the morphology of the catalysts drastically affects the photocatalytic properties of nanocrystalline semiconductors as it does in many cases found in solid catalysis. Therefore, controlling the morphology of catalyst particles is a key technology for obtaining well-tailored photocatalysts Citation3. In that sense nanopowders prepared by different methods are often stated to have a narrow size distribution. However, the lack of suitable characterization techniques for determination of size distributions in nanopowders makes the stated particle properties questionable.
Up to now the most common way to determine size distribution of nanopowders is from transmission electron microscopy (TEM). However, this method is relative time consuming and not applicable in large scale industrial processes. The particle size, D, of commercially available nanopowders is often determined from powder X-ray diffraction (XRD) spectra by Scherrer's formul Citation4, Citation5.
The K factor in Scherrer's formula is dimensionless and is accounting for the shape of the specimen and often has the value of 0.9 or close to unity Citation3. Langford and Wilson showed in 1978 that K depends on the crystallite shape, crystallite size distribution, and the definition of the FWHM Citation6. λ is the wavelength and FWHM is the full width of the peak at half the maximum intensity after subtraction of instrumental background, and θ is the diffraction angle.
The size obtained from Scherrer's formula is the average or “apparent” crystallite size and is not necessarily the same as the particle size. This is the case for partly crystalline powders and aggregated powders made up of smaller primary particles Citation7. Furthermore, powders are normally not monodisperse but consist of a size distribution. The polydispersity of nanopowders is not taken into account in Scherrer's formula.
Two fundamentally different approaches exist to model the XRD peak shape. Firstly the Rietveld structure refinement where simple analytical functions such as Gaussian, Lorentzian, Pseudo-Voigt, Pearson VII, and empirical profile shape functions are used together with Scherrer's formula Citation8. Secondly the physical model approach as Bertaut and Guinier developed in the middle of the last century, where they were the first to establish models extracting size distributions from powder diffraction line profiles Citation5, Citation9.
The principal advantage of modeling powder patterns by physical models is that it can provide physically meaningful quantities to describe the microstructure of the sample. Furthermore, by using a physical model with a size distribution instead of the Rietveld refinement fewer fitting parameters are required.
Langford et al . found using the physical model approach that the effect of a broad size distribution on the shape of a diffraction line was a lengthening of its tail compared to a single crystallite size Citation10. Ungar et al . showed for nanocrystalline tungsten-carbide that ball-milled specimen had an extremely long tail in XRD indicating a wide crystallite size distribution confirmed by TEM Citation11. Gubicza et al . used the model derived by Guinier for size depended XRD line profile analysis and found the variance and the median of the size distribution for nanodisperse silicon nitride powder Citation12. Ribárik et al . continued this work and developed a program for whole profile fitting of diffraction peaks Citation8.
Small-angle X-ray scattering (SAXS) is another suitable technique to determine the size and size distribution of nanopowders. Several models have been proposed to extract the size and morphology from SAXS spectra. The most common and accepted model is the physical hard sphere model. The hard sphere model can be extended to describe SAXS spectra from nanopowders containing size distributions with and without interparticle interference Citation5, Citation13–15.
The main objective of this paper was to develop methods to determine particle size and crystallite size distributions of nanopowders by several consistent techniques. TEM, XRD, and SAXS were used as characterization techniques. Physical models explaining the XRD and SAXS spectra from nanopowders were used and developed to determine the crystallite size distribution and particle size distribution. The morphology upon which the XRD and SAXS models were developed was determined by TEM and the importance of using XRD and electron microscopy, TEM or SEM, together to extract convincing physical models of the nanopowders was demonstrated.
2. Theory
2.1 Particle size, crystallite size, and size distributions
Nanopowders often consist of primary particles arranged in a larger macroscopic structure. The primary particle size is defined to be the smallest size of individual particles. The primary particles can be made up of several crystals or consist of a crystalline core with an amorphous shell. The size of the primary particles can be determined by for example SAXS and electron microscopy, TEM and SEM. The primary particle size is not necessarily equal to the crystallite size determined by XRD where only the crystalline part is detected.
If a larger structure is made up through cementation of the primary particles mainly by chemical bonding the structure is defined as agglomerates. Aggregates are similar to agglomerates except that the particles formed are held together by physical Van der Waals bondings, and may be broken down to its individual units of primary particles when subjected to stronger forces or changes in surface charges Citation16. Agglomeration and aggregation are normally defined as secondary particle growth. The consequence of secondary growth is that the powder is not monodisperse but polydisperse and needs to be described by a size distribution instead of an average size. The polydispersity can also be caused by the different physical and chemical processes used during particle synthesis.
The most common used particle size distribution is the log-normal distribution and if each particle in a powder is a single crystal, the distribution of crystallite sizes frequently has this form Citation10. Furthermore, particle size distributions characterized with a long large tail can often be described by a power-law relationship between particle size and number and in such cases the log-normal distribution is used. The following definition of the log-normal size distribution will be used in this study Citation12:
The standard deviation of the log-normal size distribution is the square root of the variance.
2.2 XRD
The crystallite size distribution can be extracted from XRD spectra by analyzing the line profile of the diffraction peak and not only the broadening. A. Guinier derived in 1963 an equation for the line profile including a size distribution function g(M) Citation5. This formulation will in this study be used to extract information of the crystallite size distribution from XRD spectra. The theoretical Guinier model for XRD of small crystals will be compared to the average crystallite size obtained from Scherrer's formula, where the FWHM is extracted form the XRD peak by a Pseudo-Voigt function. Furthermore, size dependent analytical expression together with Scherrer's formula will be used to fit the experimental XRD data.
2.2.1 Size dependence in XRD–Guinier's model
Guinier showed that the intensity profile of a diffraction peak can be derived as Citation5:
The intensity profile in equation (Equation4) is written as an integration of the column length M, the distribution function g(M) of the column lengths, and s0 which is defined as Citation5:
The relationship between the distribution function of the column length g(M) and the density function f(x) of the size of the crystals, equation (Equation2), depends on the shape of the crystallites Citation8, Citation12. Assuming spherical grains, which in section 4.1 will be confirmed by TEM, the distribution function of the column lengths is:
Figure 1. XRD spectra as a function of μ and σ; A) μ = 10 nm, B) σ = 1.5.
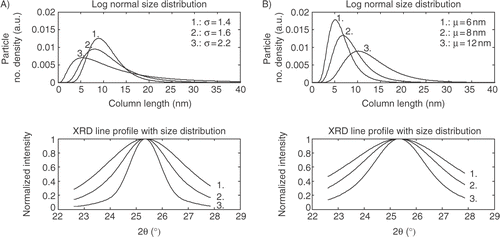
The profiles in show that by increasing the width of the size distribution a larger tail of the line profile of the XRD peak is observed. If σ is changed from 1.4 to 2.2 and the crystallite size is kept constant it is clearly that the line profile of the XRD peak is changed significantly and a long tail is observed. Keeping σ constant and changing the crystallite size from 6 nm to 12 nm results in a broadening of the line profile as expected.
2.2.2 Extracting the crystallite size from XRD by analytical expressions
The most common way to obtain the average crystallite size from an unknown sample is fitting the XRD peak by an analytical expression assuming that the line profile follows a Gaussian or Pseudo-Voigt function. Inserting w from the Pseudo-Voigt function in Scherrer's formula, equation (Equation1), as the FWHM w can be rewritten as a function of the average crystallite size w = Kλ/(Dcos(θ)). However, as in the case for the theoretical Guinier model a size dependent analytical expression will be proposed. Inserting w from Scherrer's formula into a Pseudo-Voigt function and expressing D by a log-normal size distribution function f(D), equation (Equation2), the size depend analytical XRD expression becomes:
2.3 SAXS in low density systems
In SAXS only the form factor, Σ(q), gives rise to scattering in the nano range Citation18. The scattering intensity for SAXS in the immediate proximity of the center of the reciprocal space can be deduced which is shown in equation (Equation9). However, for the SAXS investigation the scattering vector modulus s, equation (Equation5), will be substituted with the scattering vector modulus q equal to 2πs Citation5.
The form factor for a sphere is Citation13, Citation14:
Figure 2. SAXS model with different size distributions; A) σ = 1.4, B) μ = 10 nm.
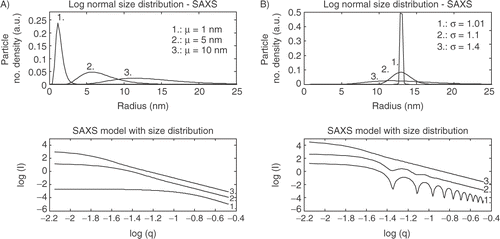
The SAXS model presented in is shown in a log-log plot. This plot gives rise to two main features: 1) Typically scattering patterns display power-lay decays in intensity reflecting power lay scaling features of many materials. 2) Power-law decays begin and end at exponential regimes that are shown as a knee in a log-log plot. These exponential knees reflect a preferred size as described by R = 1/q for the knee regime Citation18. The scattering patterns in show decay in intensity as q increases. This is due to the decreasing number of electrons as the particle size decreases Citation18.
The SAXS models in show that the position of the knee in a log-log plot is changed as the mean radius is changed going to larger q's for smaller radii. The theoretical models displayed in show that a narrow size distribution gives an oscillating curve which is often shown in practice. Increasing the width of the size distribution contributes to a more “smooth” curve. This kind of behavior is often modeled by an average or apparent particle size, but it is shown that it is more likely to consist of a broad size distribution.
The model in equation (Equation11) is as the name says only valid for spherical particles. If the sample is cylindrical or ellipsoid different models should be used to describe the form facto Citation5, Citation19. Furthermore in this study a log-normal size density function is chosen for the model. These assumptions vary from sample to sample and therefore it is necessary to investigate the sample by electron microscopy to observe what shape or size distribution the sample has.
2.4 SAXS in dense systems
To investigate SAXS spectra from dense systems the interparticle interference effect has to be considered and equation (Equation11) becomes Citation13:
3. Materials and method
3.1 Nanopowders
A SSEC produced Citation22 powder (SSEC78) and three commercially available nanocrystalline titanium dioxide powders prepared by different methods are investigated and the crystallite size distributions and particle size distributions are determined. In a previous work the absolute crystallinities and the specific surface areas were determined Citation7. These results together with the preparation methods are shown in .
Table 1. Measured particle properties and preparation methods Citation7, Citation23.
Degussa P25 is a commercially available powder from Degussa Company. It is produced by the chloride method where the precursor, TiCl4, is oxidized in the gaseous phase at high temperature (985°C) in a H2/O2 flame. Hombikat UV100 is produced by Sachtleben Chemie GmbH. It is produced by the sulphate process where titanium sulphate in the final step is reacting with water resulting in the formation of titanium oxide. The company Nanostructured and Amorphous Material, Inc. produces TiO2_5 nm by a normal sol-gel process. The SEEC produced powder, SSEC78, has been produced by a modified sol-gel process. This process involves a sol-gel reaction, but in the contrary to a normal sol-gel process the reaction is occurring with supercritical CO2 as solvent. As shown in . Hombikat UV100 and TiO2_5 nm are after the synthesis calcinated at elevated temperatures. The different preparation methods are described in more details in Citation23, where it was shown that the surface properties and photocatalytic properties of these powders depend on the preparation method.
3.2 Methods
The XRD spectra are obtained using a CuKα1 radiation (λ = 1.54 Å) from a STOE Stadi P transmission diffractometer and to get good statistics a counting time of 30 min/point is required. The SAXS data were obtained using an adaptation of a Brukers AXS, Nanostar SAXS system, with a rotating anode X-ray generator, cross-coupled Goebel mirrors, three pinholes, and a Bruker AXS Hi-star Area Detector. The scattering intensity, I, was measured in terms of the scattering vector modulus q, where λ = 1.54 Å. The scattering intensity was measured in the range q = 0.0071 Å−1 to q = 0.334 Å−1. The data were corrected for background and azimuthally averaged to obtain a spectrum of average intensity vs. q. Transmission electron microscope (TEM) is used to investigate the shape and morphology as well as the size of the samples. The TEM used is a JEOL 100 CX. The acceleration voltage was 100 kV for all samples/images. The samples were prepared by dispersion of the powder onto a formwar film.
4. Results
The experimental results obtained in this study will in the following be analyzed. The XRD and SAXS models shown in section 2 will be fitted to the experimental data by the Least Square Method. First TEM images of the investigated powders will be analyzed and these images are used to support the theoretical XRD and SAXS models.
4.1 TEM
In the XRD and SAXS theory grains of spherical shapes were assumed. This assumption can be confirmed by TEM, .
Figure 3. TEM images of the four powders; A) SSEC78, B) P25, C) UV100, D) TiO2_5 nm.
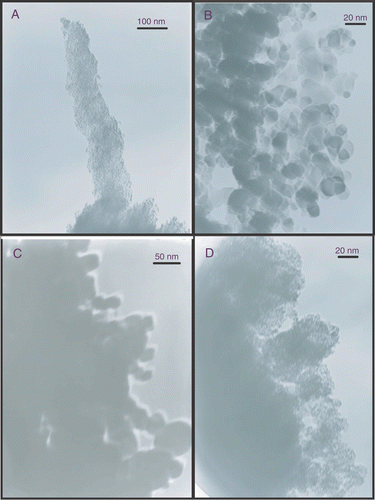
The particles are not exactly spherical but it seems to be a good approximation; however, particles of irregular shapes were found as well.
For the SSEC78 samples primary particles of 5 nm or less can be observed. These primary particles are agglomerated into larger clusters. The primary particles observed show a narrow size distribution. The TEM images of P25 show typical diameters of 20–30 nm. Although smaller particles well below 20 nm can be observed and the TEM image of P25 shows a wider size distribution than SSEC78. A similar result can be observed for the UV100 powder. The TiO2_5 nm particles are of approximately the same size and have a similar size distribution as the SSEC78 sample.
4.1.1 XRD – analytical and theoretical models
The Pseudo-Voigt function including a linear term to correct for the background of the 100% anatase peak, ∼25.4°(2θ), is used to determine the FWHM and the peak center of the four samples. These values will be used to calculate the average crystallite size from Scherrer's formula. The analytical expressions and the Guinier model will in the following be fitted to the background corrected 100% anatase peak for the four samples.
A Gaussian function and a Pseudo-Voigt function with a size distribution terms, equation (Equation8), are fitted to the XRD spectra as shown in . The peak center is taken from the Pseudo-Voigt fit, resulting in only two unknown parameters for the size dependent Gaussian function; μ and σ from the log-normal size distribution, equation (Equation2), and an extra unknown parameter for the size dependent Pseudo-Voigt function – the ϕ parameter. In the fit of the XRD line profile from the Gaussian function is shown.
Figure 4. Gaussian function with log-normal size distribution function fit; A) SSEC78, B) P25, C) UV100, D) TiO2_5 nm.
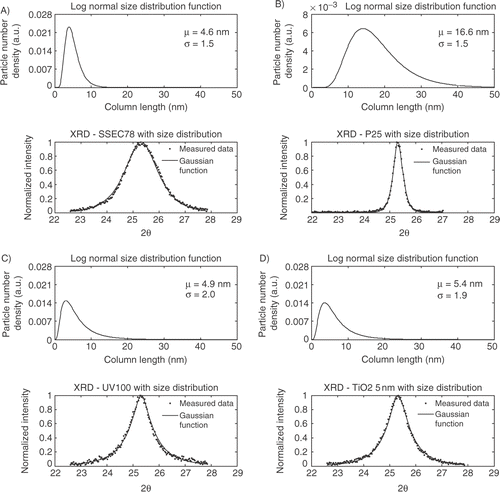
Table 2. Crystallite size and standard deviation from analytical and theoretical models.
The size dependent Gaussian function fits the experimental data well. However, some problems are observed for the four samples where the tails of the XRD peaks are overestimated compared to the experimental data. From the fits it is observed that the SSEC78 sample shows a very narrow size distribution compared to TiO2_5 nm and Hombikat UV100. Furthermore, Degussa P25 has the largest mean diameter 3–4 times larger then the three other.
The Guinier model shown in equation (Equation7) is fitted to the experimental XRD data for the four powders, which is shown in . The grain shape of the crystallites is assumed spherical and a log-normal size distribution function is included.
Figure 5. XRD line profile fit for A) SSEC78, B) P25, C) UV100, and D) TiO2_5 nm.
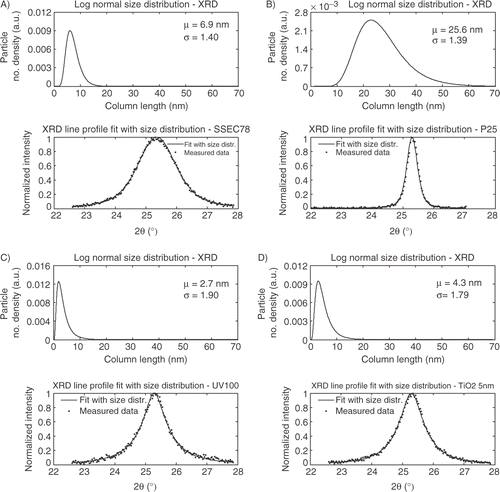
The experimental XRD spectra show different line profiles depending on the different preparation method. Fitting the Guinier model to the experimental data confirms the visual observations. SSEC78 shows a broad symmetrical peak corresponding to a narrow size distribution. SSEC78 is shown to consist of nanocrystallites with a mean diameter of 6.9 nm and σ is equal to 1.40. Hombikat UV100 and TiO2_5 nm have similar line profiles with a relative narrow top of the peak with a wide tail. The different line profiles compared to SSEC78 correspond to a broader size distribution. Hombikat UV100 shows a mean diameter of 2.7 nm and a σ value of 1.90. TiO2_5 nm has a slightly larger mean diameter of 4.3 nm and a σ value of 1.79. Degussa P25 has a σ value of 1.39 and a mean diameter of 25.6 nm.
4.1.2 SAXS
The hard sphere model with size distribution and a structure factor is in the following used to fit the experimental measured SAXS data. In the SAXS data for P25 is shown.
Figure 6. SAXS fit for P25.
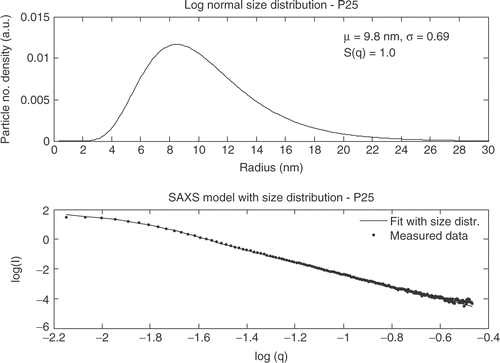
The particles in the Degussa P25 powder do not show an interference effect and S(q, ηHS , CHS ) is equal to one. Hombikat UV100 shows a significantly different SAXS curve than Degussa P25 and the “knee” for Hombikat UV100 is observed at larger q values. The SAXS data for Hombikat UV100 is shown in .
Figure 7. SAXS fit for UV100.
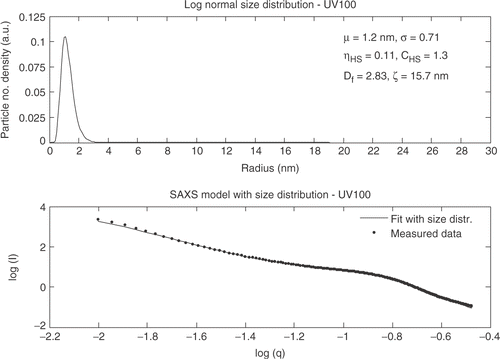
The structure factor is included for the fit of the SAXS data for Hombikat UV100 indicating that the powder is denser packed compared to Degussa P25. The SAXS curve for TiO2_5 nm has similar trends as Hombikat UV100 ().
Figure 8. SAXS fit for TiO2_5 nm.
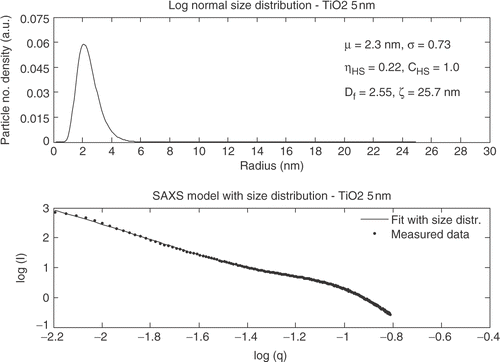
The structure factor was also required to model the SAXS curve for TiO2_5 nm but a mean size of approximately twice as large as for Hombokat UV100 was observed. In the SAXS fit for the SSEC78 powder is shown.
Figure 9. SAXS fit for SC78.
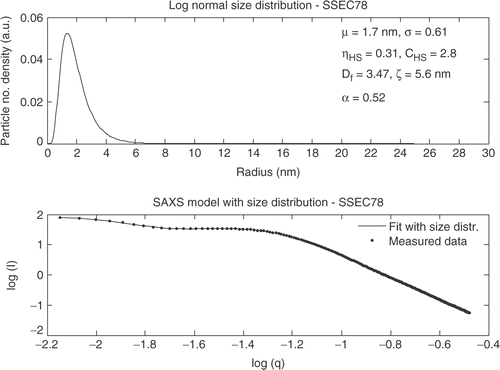
The SAXS curve for SSEC 78 shows a different tendency at large q values. The hard sphere model could not explain this type of scattering because for the SSEC78 powder a positive deviation from the Porod slope (-4) was observed, which is normally attributed to the scattering from a rough surface or indeed from a surface fractal Citation24. This additional features on the primary particle surfaces was taken into account by multiplying the form factor by (qR)α where 0 < α < 1 and expresses the degree of roughness. The surface fractal of the primary particles can be extracted as Ds = 6 − (4 − α).
5. Discussion
5.1 XRD: Analytic expressions vs. theoretical model
In the mean diameters with standard deviations calculated from equation (Equation3) are shown for the two analytical XRD models and the Guinier model.
The four methods used to extract the crystallite size show a variation in the mean diameter and standard deviation. The Guinier model gives a larger diameter for SSEC78 and Degussa but a significant smaller diameter for Hombikat UV100 and TiO2_5 nm compared to the analytical expressions. Comparing the standard deviations it is observed that the standard deviations obtained from the Pseudo-Voigt function with size distribution are different from the Gaussian function and the Guinier model which are consistent. This indicates that the standard deviation is not obtainable from the Pseudo-Voigt function but should be extracted from one of the other models.
Based on this XRD investigation no concise conclusion can be made on whether to use Scherrer's analytical formulation or Guinier's theoretical expression. Both the Scherrer formula from 1918 and Guinier's model from 1963 can be used for extracting crystallite size distribution from experimental XRD spectra.
5.2 SAXS: The hard sphere model
The analysis of the SAXS curves for the three commercial powders showed that for Hombikat UV100 and TiO2_5 nm the structure factor had to be included in the model to take into account the interference factor for agglomerated nanoparticles. For Degussa P25 the interference factor was found to be unity indicating that no interparticle interference is occurring. For the SSEC produced powder the hard sphere model was not sufficient to model the scattering curve due to a positive deviation from the Porod slope was observed. The positive deviation is caused by a surface roughness or surface fractal of the primary particles. The slope in the Porod regime for SSEC78 was −3.48 with an α factor of 0.52 indicating a surface fractal dimension of 2.48. Previously in the literature a positive deviation is reported for aerogels and xerogels Citation25, Citation26 but also for supercritical dried aerogels Citation24, Citation27.
5.3 Morphology: TEM, XRD, and SAXS
The TEM, XRD, and SAXS data have been analyzed by different models. In the extracted data are shown.
Table 3. Extracted particle properties by TEM, XRD (Guinier Model), and SAXS.
A qualitative judgment of the TEM images shows good agreement with the particle sizes found from XRD and SAXS measurements. The three different analysis methods all show comparable values of the extracted sizes. However, the sizes obtained from the SAXS measurements are for all four samples smaller than the sizes from the XRD measurements expressed by the Guinier model. An explanation to this phenomenon could be that the size extracted from XRD is only for the crystalline areas and the smallest particles in the individual powders are amorphous. SAXS on the other hand can determine the size from both amorphous and crystalline particles and the mean sizes extracted from SAXS thereby become smaller than the size extracted from XRD. However, taken the uncertainties and variances into account the size distributions for each sample are similar from both SAXS and XRD.
Some comparisons can be made between the TEM images, from this study and the SEM images from Jensen et al . 2004 of the SSEC78 sample. The primary particles seem to be agglomerated into larger clusters as can be seen on both the SEM and TEM images. Occasionally thinner and narrow structures can be observed from the clusters surfaces as observed from TEM. The secondary structure found in both SEM and TEM was confirmed by SAXS, although a smaller secondary structure was extracted from SAXS than seen in SEM and TEM. The SAXS analysis of SSEC78 also confirms this secondary structure by the implementation of the interparticle interference factor.
The P25 particles show a significantly larger size of the primary particles than SSEC78. However, as observed by SEM, TEM, and SAXS P25 does not show a secondary structure. On the other hand the size distribution for P25 is wider than for SSEC78. The UV100 and the TiO2_5 nm particles show the same tendencies in SAXS and XRD and both samples have primary particles of approximately 5 nm or less; although, the TEM analysis revealed that UV100 consists of remarkable larger primary particles than extracted from XRD and SAXS. The TEM images of TiO2_5 nm showed primary particles with sizes in the same range as SSEC78. Both the UV100 and the TiO2_5 nm samples consist of a secondary structure observed from SAXS.
6. Conclusion
The present study showed that crystallite and primary particle size distributions can be extracted from experimental measurements by theoretical models assuming spherical particles with a log-normal size distribution. The morphology upon which the XRD and SAXS models were developed was determined by TEM and SEM and the importance of using XRD and electron microscopy together to extract convincing physical models of the nanopowders was shown. The crystallite size extracted from the theoretical Guinier model was in agreement with the SAXS measurements. However, the SAXS analysis showed for all samples a smaller primary particle size compared to XRD.
The Guinier model deviated slightly from Scherrer's formula and analytical models including a size dependent term. No exact conclusion can be made from this study to whether Guinier's model or Scherrer's formula is more precise.
Related Research Data
References
- Saltiel , C and Giesche , H . 2000 . Needs and opportunities for nanoparticle characterization . J. Nanopart. Res. , 2 : 325
- Jillavenskatesa , A and Kelly , JF . 2002 . Nanopowder characterization: challenges and future directions . J. Nanopart. Res. , 4 : 463
- Waseda , Y and Muramatsu , A . 2004 . Morphology Control of Materials and Nanoparticles -- Advanced Materials Processing and Characterization , New York : Springer .
- Scherrer , P . 1918 . Bestimmung der Grösse und der inneren Struktur von Kolloidteilchen mittels Röntgenstrahlen , Berlin : Nachrichten von der Königlichen Gesellschaft der Wissenschaften zu Göttingen Weidmannsche Buchhandlung .
- Guinier , A . 1963 . X-Ray Diffraction – In Crystals, Imperfect Crystals, and Amorphous Bodies , New York : Dover Publication .
- Langford , JI and Wilson , AJC . 1978 . Scherrer after sixty years: a survey and some new results in the determination of crystallite size . J. Appl. Cryst. , 11 : 102
- Jensen , H , Joensen , KD , J⊘rgensen , JE , Pedersen , JS and S⊘gaard , EG . 2004 . Characterization of nanosized partly crystalline photocatalysts . J. Nanopart. Res. , 6 : 519
- Ribárik , G , Ungár , T and Gubicza , J . 2001 . MWP-fit: A program for multiple whole-profile fitting of diffraction peak profile by ab initio theoretical functions . J. Appl. Cryst. , 34 : 669
- Bertaut , EF . 1950 . Rais de Debye-Scherrer et Répartition des Dimensions de Bragg dans les Poudres Polycrystallines . Acta Cryst. , 3 : 14
- Langford , JI , Loür , D and Scardi , P . 2000 . Effect of a crystallite size distribution on X-ray diffraction line profiles and whole-powder-pattern fitting . J. Appl. Cryst. , 33 : 964
- Ungár , T , Borbély , A , Goren-Muginstein , GR , Berger , S and Rosen , AR . 1999 . Particle-size, size distribution and dislocation in nanocrystalline tungsten-carbide . Nanostr. Mat. , 11 : 103
- Gubicza , J , Szépvölgyi , J , Mohai , I , Ribárik , G and Ungár , T . 2000 . The effect of heat-treatment on the grain-size of nanodipserse plasmathermal silicon nitride powder . J. Mater. Sci. , 35 : 3711
- Pedersen , JS . 1993 . Small-angle scattering from prercipitates: Analysis by use of a polydisperse hard-sphere model . Phys. Rev. B , 47 : 657
- Pedersen , JS . 1997 . Analysis of small-angle scattering data from colloids and polymer solutions: modeling and least-squares fitting . Advances in Colloid and Interface Science , 70 : 171
- Visser , SA and Cooper , SL . 1991 . Analysis of small-angle x-ray scattering data for model polyurethane ionomers: evaluation of hard-sphere models . Macromolecules , 24 : 2584
- Sathyamoorthy , S , Moggridge , GD and Hounslow , J . 2001 . Particle formation during anatase precipitation of seeded titanyl sulfate solution . Crystal Growth & Design , 1 : 123
- Walpole , RE , Myers , RH and Myers , SL . 1998 . Probability and Statistics for Engineers and Scientists , New Jersey : Prentice Hall .
- Beaucage , G . Small Angle X-ray Scattering (SAXS) http://www.eng.uc.edu/~gbeaucagResearchGroup.html, March 8 (2005)
- Pedersen , JS . 2002 . “ Modelling of small-angle scattering data from colloids and polymer systems ” . In X-Rays and Light , Edited by: Lidner , P. and Zemb , T. 391 – 420 . Oxford : Elsevier .
- Hoekstra , H , Mewis , J , Narayanan , T and Vermant , J . 2005 . Multi length scale analysis of the microstructure on sticky sphere dispersions during shear flow . Langmuir , 21 : 11017
- Teixeira , J . 1988 . Small-angle scattering by fractal systems . J. Appl. Cryst , 21 : 781
- Jensen , H , Joensen , KD , Iversen , SB and S⊘gaard , EG . 2006 . Low Temperature Synthesis of Metal Oxides by a Supercritical Seed Enhanced Crystallization (SSEC) Process . Ind. Eng. Chem. Res. , 45 : 3348 – 3353 .
- Jensen , H , Soloviev , A , Lie , Z and S⊘gaard , EG . 2005 . XPS and FTIR investigation of the surface properties of different prepared titania nano-powders . Applied Surface Science , 246 : 239
- Pajak , L , Bierska-Piech , B , Mrowiec-Bialon , J , Jarzebski , AB and Diduszko , R . 2005 . SAXS from particle and disordered systems . Fibres and Textiles in Eastern Europe , 13 : 69
- Blanco , E , Esquivias , L , Litran , R , Pinero , M , Ramirez-del-Solar , M and Rosa-Fox , N . 1999 . Sonogels and derived materials . Appl. Organometal. Chem. , 13 : 399
- Vollet , DR , Donatti , DA and Ruiz , AI . 2004 . Comparative study using small-angle x-ray scattering and nitrogen adsorption in the characterization of silica xerogels and aerogels . Phys. Rev. B , 69 : 064202
- Hackley , VA , Stoimenov , PK , Ho , DL , Sung , LP and Klabunde , KJ . 2005 . Structure development in aerogel-processed nanocrystalline alkaline earth oxides as revealed by SANS . J. Appl. Cryst. , 38 : 619