Abstract
We have combined a microfluidic network and miniature thin film pH sensors (40 × 40 µm2) to trap and measure the acidification rates of single cardiomyocytes in a confined extracellular space. The miniature pH sensors were fabricated by electrodeposition of iridium oxide (IrOx) films on planar platinum microelectrodes. The pH electrodes as well as stimulation electrodes were integrated into the device with a 160 picoliter cell trap. Single cardiac cells were trapped in the sensing volume using pressure gradients. Miniature mechanical valves allowed the control of the fluidic flow in the network precisely to eliminate small residual flows. The measurement acidification rate of quiescent cells depended on the Ca2+ concentration of the media and was 6.45 ± 0.4 mpH\min for 0.8 mM Ca2+ (n = 8) and 11.96 ± 1.3 mpH\min for 1.8 mM Ca2+ (n = 9). Multiple cell traps equipped with pH sensors can be arranged on one chip. Such chips could have potential applications in high-content high throughput drug screening efforts.
1. Introduction
Multiple sensor technologies have been developed to monitor cell physiology on the single cell level Citation1. Fluorescent probes and indicators are certainly the most widely used approaches to study the dynamics of cellular processes such as changes in membrane potential or cytosolic calcium concentration Citation2–4. The detection of the fluorescence signals from single cells requires sophisticated optics, optrodes and/or expensive detectors such as photomultiplier tubes or high resolution CCD cameras. Electrochemical methods especially scanning electrochemical microscopy (SECM) Citation5 allow imaging of cellular activities such as respiration, single vesicular exocytosis of oxidisable hormones, neurotransmitters and membrane transport with high temporal and spatial resolution Citation6. Carbon-fibre microelectrodes allow the real time detection of zeptomole quantities of dopamine released from a single neuronal vesicle as a current spike Citation7. Although, the detection of the currents in the pico-ampere range is not trivial the technical challenges are the fabrication of the needle type sensors and the manual positioning of the sensor in close proximity to the cell, which prevent the use of this technology in high-throughput studies. Most of these experiments are performed in very large volumes compared to the cell. This has serious drawbacks: the analyte collection efficiency of the sensor is small, the accumulation of signal molecules in a small confined extracellular space cannot be studied and the chemical composition of the extracellular space can not be changed rapidly. Patch clamp techniques, which are used to record ion fluxes through membrane ion channels, face similar challenges Citation8.
Micromachining, mirofabrication and microfluidic technologies are currently being investigated to address some of these shortcomings Citation9. Photolithography and thin film technologies have been utilised to develop planar electrochemical sensing electrodes Citation10 for the amperometric detection of a variety of oxidisable analytes such as glucose Citation11, lactate Citation10, purines or potentiometric detection of charged ionic species such a protons (pH) Citation12, calcium Citation13, potassium or sodium Citation14. Single cell studies on planar microelectrodes using amperiometric detection were conducted in oil sealed restricted volumes and have shown the release of lactate or purine from single cardiac myocytes Citation15, Citation16. However, this approach does not allow extracellular volumes comparable to the cell size, the perfusion and chemical control of the extracellular space.
In this manuscript, we report on a microfluidic network sealed to a glass substrate with planar miniature pH electrodes. The device allows the trapping of single cardiac myocytes in a 160 picoliter extracellular volume and conduct acidification rate measurements on single cells. Acidification rate measurements on the macroscopic scale have been used to detect changes in the metabolic activity as a result of receptor activation, toxin effects or enzyme inhibition Citation17, Citation18. Changes in the extracellular acidification rate are either from alterations in the energy demand as a response to the stimulus or changes in the intracellular pH homeostasis mediated through the sarcolemmal sodium-hydrogen exchanger. In order to demonstrate device functionality, we measured the metabolic rate of quiescent single cardiac cells at different extracellular Ca2+ concentrations.
2. Materials and instrumentation
Universal pH buffers were used (buffers for pH 2, 4, 6, 7, 8, 10 and 12 from VWR Scientific, West Chester, PA). Anhydrous potassium carbonate, oxalic acid dehydrate, hydrogen peroxide (30% solution in water) and iridium tetrachloride were purchased from Aldrich. The components of Tyrode's solution (potassium chloride, sodium chloride, magnesium chloride, sodium phosphate, sodium bicarbonate) were supplied by Fisher Scientific. All chemicals were used as received. Double-distilled (DI) water was used for the preparation of all solutions.
Titanium (99.95%, rod diam. 2 mm), and platinum (99.95%, rod diam. 2 mm) were purchased from Goodfellow Corp. Fisherbrand® (Fisher Scientific) Microscope glass slides (75 × 25 × 1 mm) were used as substrate for pH sensors.
Polydimethylsiloxane (PDMS) elastomer composed of prepolymer and curing agent (Sylgard 184 kit, Dow Corning, Midland, MI) was purchased from Essex Chemical.
Thin film electrodes were fabricated on microscope glass substrates using e-beam vacuum evaporation (Inotec Corp.) of Ti and Pt from carbon crucible liners (Kurt J. Lesker Company). The deposition rate and the thickness of the films were verified by deposition controller MDC-360 (Maxtek, Inc.).
All electrochemical experiments were performed with a CHI model 660B and model 1030 potentiostat/galvanostat (CH Instruments, Austin, TX). A three-electrode configuration was used for electrochemical deposition of the pH sensitive iridium oxide thin films and a two-electrode configuration (open circuit potential (OCP) mode) was used for calibration of the pH electrodes and acidification rate measurements on cardiac myocytes. The counter electrode was typically a Pt wire with a diameter of 1 mm (CHI 115, CH Instruments). A Dri-Ref −450 from World Precision Instrument Inc. was used as reference electrode (diameter 0.45 mm). A stylus surface profiler (Alphastep 200, Tencor Instruments) was used to measure the thickness of the photoresist layers and iridium oxide films.
An upright optical microscope (OLYMPUS BX-41) with a CCD camera (Micropublisher 3.3, QImagine, Canada) was used to monitor the surface of platinum and iridium oxide thin films. A stereomicroscope STEMI 2000-C (Carl Zeiss, Germany) was used to align the thin film pH sensitive electrodes relative to the flow channels of our PDMS microfluidic device. Fluidic flow visualisation was performed using colored solutions and an inverted microscope (AXIOVERT 25CFL, Carl Zeiss, Germany) in combination with a color CCD camera (KP-D20BU, Hitachi, Japan). Images were captured by an image capture board (FlashBus® Spectrum, Integral Technologies Inc., Indianapolis, IN) linked to a standard PC. The same system was used to image the morphology and the motion of cells in the on chip cell culture volume.
Electrical stimulation of single cardiomyocytes was performed with the help of a GRASS SD9 stimulator (Grass Instrument, Quincy, MA) or Arbitrary Waveform Generator (model 75A, WAVETEC, San-Diego, CA).
3. Experimental
3.1. Single cell isolation
Mice were anesthetised by intraperitoneal injection of Avertin solution (5 mg Avertin per 10 g body weight, T48402, Sigma-Aldrich) containing heparin (3 mg/10 ml, H9399, Sigma-Aldrich). The heart was rapidly excised and placed into ice-cold Ca2 +-free and glucose-free Hepes-buffered Tyrode's solution (T). The T solution contained (in mM): NaCl–140, KCl–4.5, MgCl2–0.5, NaH2PO4–0.4, NaHCO3–10, Hepes–10. The pH of all solutions was adjusted to 7.4 using NaOH.
The aorta was cannulated and the heart was perfused with T solution at room temperature for 10 min to stop contractions. The perfusion was then switched to T solution containing 10 µM CaCl2 with collagenase (178 U/ml, CLS2, Worthington Biochemical) and protease (0.64 U/ml, P5147, Sigma-Aldrich) for 12 minutes at 37°C. Tissues from the atria and aorta were discarded. The remaining ventricular tissue was coarsely minced and placed into T solution containing 0.5 mM Ca2+. Myocytes were dissociated by gentle agitation and used within 3 hours of isolation.
3.2. PDMS microfluidic network
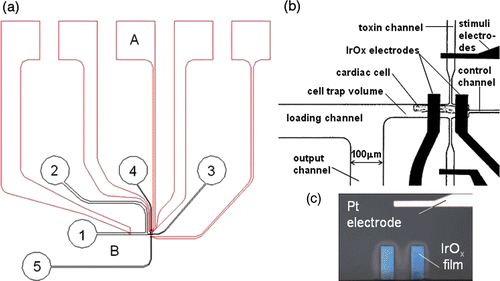
The microfluidic network was fabricated from PDMS (polydimethylsiloxane) by replica molding, using photoresist on a silicon wafer as a master. PDMS prepolymer was prepared by mixing PDMS pre-polymer with curing agent in a 10 : 1 ratio by weight and degassing the mixture in a vacuum chamber for 20 min. The master was fabricated by spinning a 20 µm thick layer of photoresist (SU-8 2025, MicroChem Corp, Newton, MA) on a 3′′diameter silicon wafer (Nova Electronic Materials, Ltd, Carrolton, TX) and by exposing it to UV light (160 mJ/cm2) through a metal mask using a contact mask aligner. The photoresist was processed according to the manufacturer's recommendation on the datasheet. An optional 30-minute hard bake at 200°C was performed on a hot plate to increase the durability of the resist. The master was placed in a clean Petri dish, which was filled to a height of approximately 1 cm with PDMS prepolymer and cured in an oven for 4 hours at 70°C. After curing, the elastomer was mechanically separated from the master and cut into discrete devices. Access holes for the fluidic connections were punched into the PDMS using sharpened blunt-tip 18 gauge needles. The PDMS microfluidic device was manually aligned relative to the pH and stimulation electrodes () with a stereo microscope. The PDMS device was sealed to the glass substrate by auto-adhesion, and stabilised with a mechanical clamp. Glass capillaries were inserted into the access holes to connect the microfluidic channels to syringes using standard microtubing (0.5 mm inner diameter, Cole Parmer). For fast cell manipulation we controlled the syringes connected to the output and control port by hand. A microsyringe pump “Micro 4” (WPI, Sarasota, FL) was used to control the flow of solution during the calibration of pH electrodes in the microfluidic devices.
Figure 1. (a) Schematics of a microfluidic device with integrated pH electrodes designed to trap single cardiac myocytes in a 160 pL volumes and to measure the metabolic activity: A–micro-electrode array (red); B–microfluidic network (black); 1–input port; 2–output port; 3–control port; 4, 5–toxin or stimuli port. (b) Detailed view of pH IrOx microelectrodes, stimulation electrodes and the cell trap with loading and waste channels. (c) Optical image of the IrOx pH sensitive microelectrodes (the width of electrodes is 40 µm) and the Pt stimulation electrode.
3.3. Mechanical valves
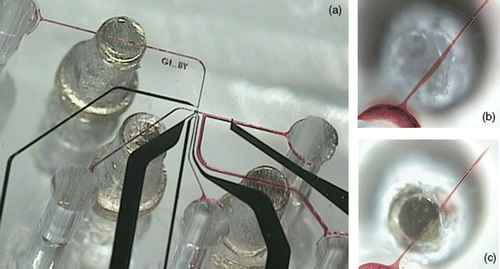
In order to measure acidification rates and characterise the metabolic activity of cells, the flow in the microfluidic devices needs to be controlled very precisely. There is a wide range of different valve technologies to control fluid flow and deliver specific amounts of reagents in microfluidic-based cell culture devices. In our application, even small leak rates could lead to large errors, so we decided to implement miniature mechanical screw valves Citation19. Our design allowed us to place three valves within a footprint of 6 × 8 mm2 in close proximity to the cell trap (). The valves were fabricated by drilling a pocket hole above the microfluidic channel into the PDMS. Into the pocket hole we inserted an oversized threaded sleeve and a screw which allowed us to compress the PDMS beneath the screw and above the microfludic channel. show the operation of these mechanical valves. The functionality and the leak rate of the valves were assessed with a dye solution. shows the channel opened and shows the channel closed after rotating the screw. The use of these valves proved essential in obtaining reliable measurements of acidification rates from single cardiac myocytes in a confined extracellular space. In microfluidic devices, small pressure gradients will result in unpredictable flow pattern and larger errors.
Figure 2. Bottom view of the microfluidic device with mechanical valves sealed to the glass substrate with pH sensing and stimulation electrodes. (a) Microfluidic device with 3 valves filled with a red dye (black–Pt electrodes; red–microfluidic channels: 100 µm wide, 20 µm tall), (b) Bottom view of a channel filled with red dye; the valve is open, (c) Bottom view of a channel that is completely closed by rotating the screw.
3.4. Thin film conducting electrodes
The planar thin film metal electrodes were fabricated on microscope glass slides which later were cut into small sections of 25 × 25 mm2. The glass substrates were thoroughly cleaned prior to deposition (5 min soaked in hexane, 5 min. ultrasonic acetone bath, 10 min. boiling in isopropyl alcohol and 10 min. rinsed in running DI water after each procedure). The planar electrodes consisted of two layers: a Ti adhesive layer (10 nm) and a Pt working layer (100 nm). Thin film electrodes were deposited by e-beam vacuum evaporation of Ti and Pt from carbon crucible liners in a single process without breaking vacuum. The main parameters of the deposition process were: substrate temperature ∼300 K; total gas pressure during deposition ∼2–5 × 10⁻⁶ torr; Ti deposition rate ∼1 nm/sec; Pt deposition rate ∼5 nm/sec. The deposition rate and the thickness of the films were controlled by a quartz crystal microbalance deposition controller. The conducting network electrodes configuration was created by patterning the Ti–Pt films using a standard photolithography process using a 1 µm-thick photoresist (NR7-1000P, Futurrex, Inc). The unprotected Ti–Pt film was removed by ion beam etching (Ar pressure ∼5–8 × 10⁻⁵ torr, cathode filament current ∼1.8–2 A, beam voltage–600 V, beam current ∼30–40 mA, etching time of 110 nm Ti–Pt film ∼7–9 min). The photoresist was stripped from the electrodes in acetone or in resist remover PR4 (Futurrex, Inc.) at room temperature. Finally, the surface of conducting electrodes was cleaned with isopropyl alcohol and then rinsed 10 min in running DI water. The size of the active pH sensing area is defined in the IrOx deposition step to be 40 × 100 µm2. A schematic drawing of the electrode geometry is shown in .
3.5. Iridium oxide pH sensitive electrodes
Iridium oxide pH sensitive thin films were then electrodeposited onto the microfabricated conducting electrodes (Ti–Pt) in a three-electrode cell using a CHI 660B potentiostat (chronoamperometric mode). The counter electrode was a Pt wire, 1 mm diam. and an Ag/AgCl DRIREF–450 was used as reference electrode. Dark blue iridium oxide films () with a thickness of 150–200 nm were obtained at a current density in the range of 1.5–2 mA/cm2. The electrochemical deposition lasted between 8 and 10 min. The solution for the electrochemical deposition of iridium oxide films was prepared based on a protocol described in the literature Citation20–22. We dissolved 45 mg of iridium tetrachloride in 30 ml of DI water and stirred for 15 min; 0.3 ml of 30% hydrogen peroxide was added and stirred for 5 min, 150 mg of oxalic acid was added and stirred for 5 min. Anhydrous potassium carbonate was added to adjust the pH of the solution to 10.5. During a two day homogenisation period at room temperature the color of the solution changed from yellow to light-violet. After two days the solution was stored in a sealed dark bottle and stored in the refrigerator at 4°C. The deposition solution can be used for up to three months after its preparation.
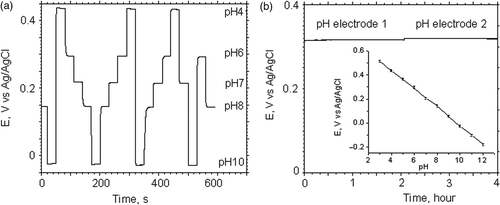
Immediately after deposition, the pH sensitive IrOx films were rinsed with distilled water and dried under a stream of nitrogen. The fresh iridium oxide pH electrodes were soaked in a pH 7 universal buffer solution for two days to stabilise the electrodes, which reduces the potential drifts. To achieve long-term stability, IrOx pH sensitive electrodes were stored in pH 7 buffer solution at room temperature. pH electrodes fabricated in accordance of the above described protocol can be used for a period of six month. Our anodically grown iridium oxide films typically show a Nernstain response with a sensitivity between 65 and 75 mV/pH at 22°C and a linear responses in the pH range of 3–12 ( (insert)). The response time of freshly deposited electrodes was 5–10 s and baseline drift was 2–3 mV/month.
Figure 3. (a) Open circuit potential of a IrOx pH sensitive electrode during periodic cycling of 5 different standard pH calibration solutions with 30 s measurement intervals. (b) Long-term stability measurement of the open circuit potential between iridium oxide electrodes (pH electrode 1 and 2) versus a standard reference electrode in Tyrode's solution. Insert–average potentiometric response of thin film iridium oxide pH electrode in buffer solutions with a pH in the range from 3–12.
4. Results and discussion
4.1. Properties of iridium oxide films
The main advantages of IrOx in comparison with other pH-sensitive oxides are a wide pH range with linear response, fast response time, high pH sensitivity, low potential drift, and low sensitivity to redox pair interference Citation23. An additional technological advantage is the ability to deposit IrOx layers by means of different chemical and physical methods, which can match application-specific requirements in chemistry, biology and medicine.
As described in Citation24, Citation25 the response of anhydrous IrO2 films to pH changes with a slope of approximately 59 mV/pH (Nernstian response) can be explained using the following redox reaction
4.2. Accidification rate measurements of single cardiac myocytes
We designed a novel microfluidic device which allows us to trap single myocytes and a new configuration of pH electrodes to quantify pH changes from single cardiomyocytes in a 160 pL volume. Furthermore, this electrode configuration allows us to electrically stimulate the cell along and perpendicular to the longitudinal axis of the single cardiac cell ( (inserts (c), (d))). The microfluidic device fabrication consist of the three main steps: replica molding of the microfluidic channel network using PDMS, incorporate the mechanical valves to control the fluid flow above the microfluidic channels and sealing the PDMS device to a glass substrate with iridium oxide pH sensitive thin films deposited onto the surface Pt microelectrodes. A mechanical clamp was used to press the PDMS devices against the glass substrate to increase the mechanical stability and improve the seal. Glass capillaries with plastic microtubing were inserted into the output and control ports () and connected to syringes for manual trapping of single cells in the trapping volume Citation26. The 5 µl input port was used as a cell reservoir. A concentrated cell suspension (2–3 µl) was added to the input port using a syringe with a plastic needle. The input port (1) is connected to the 160 pl cell trap volume through the cell loading channel (). By applying a pressure gradient to the output and control ports, the cardiac cell moves from the reservoir along the loading channel toward the cell trap volume. The trapping of the cell in the volume with the pH sensitive electrodes takes 1–5 min after loading cell suspension into the input port and depends mainly on cell viability. We closed the mechanical valves blocking the output, control and toxin channels () in order to suppress residual flow after successfully trapping a single cell. Under our conditions cardiomyocytes are viable in the microfluidic device for 2–3 hours, but we aimed to complete our experiments within 1–2 hours after isolation.
The protocol, we developed to investigate the pH behaviour of single cardiac cells in a confined extracellular space consists of the following steps: assemble the microfluidic device; calibrate the iridium oxide electrodes using two standard buffer solutions (usually pH 7 and 8) and evaluate the potentional drift in cell media for 30 min; purge the microfluidic channels with DI water; load cell suspension into the input port; trap cardiac cell; close the channels with the mechanical valves; and measure the potential between the pH and the reference electrode (Dri–Ref 450) in the input channel in the OCP-mode; open the valves; remove the cell by applying negative pressure to the output channel and load a fresh cell.
The metabolic activity and the physiological state of living cells can be characterised by the rate at which cells generate acidic byproducts. show a typical time course of the open circuit potential of the iridium oxide pH microelectrode during the acidification rate measurement from a single cardiac myocyte trapped above the pH electrode in the cell trapping volume. The curve in can be separated in three regions in which the acidification rates are different. After closing the valves, typically a large drift in the open circuit potential is observed for durations of 20–100 seconds. This drift is speculated to be associated with a residual flow in the microfluidic device after closing the mechanical valves. The second region (3–90 min) is characterised by an increase in the potential at constant rate. In the third region, the potential increases at a lower rate, indicating a decrease in metabolic activity, which is most likely a consequence of the lower pH in the extracellular environment.
Figure 4. (a) Open circuit potential between IrOx pH sensing and DriRef-450 reference electrode in the input channel during a acidification rate measurements on single cardiac myocytes. The inset shows a detailed view of cardiac myocyte cell in the cell trap volume in the initial and the final stage of experiment. (b) Acidification rate measurement of single cardiac myocytes in standard Tyrode's solution at different Ca2+ concentrations. For Cardiac myocytes we measured an average acidification rate 6.45 ± 0.4 mpH/min (t-test p < 0.00003, n = 8) in 0.8 mM Ca2+ and 11.96 ± 1.3 mpH/min (t-test p < 0.00004, n = 9) in 1.8 mM Ca2+.
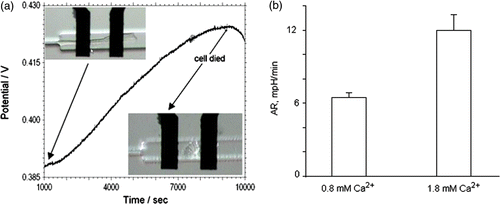
To avoid these large deviations from homeostasis, we computed the acidification rates (based on the potential changes and the sensitivity of pH electrode) in the region between 5–30 min. We conducted and analyzed more than twenty experiments on single cardiac myocytes. In those experiments, we monitored the pH changes of quiescent cardiac cells in the Tyrode solution with a Ca2+ concentration of 0.8 mM and 1.8 mM (). The estimated average acidification rate (AR) for the cardiomyocytes was 6.45 ± 0.4 mpH\min for 0.8 mM Ca2+ (n = 8) and 11.96 ± 1.3 mpH\min for 1.8 mM Ca2+ (n = 9). The larger acidification rate at higher Ca2+ levels is consistent with observations of a higher metabolic activity at higher extracellular Ca2+ concentrations measured in whole heart preparations Citation27. However, these whole heart observations are currently extensively discussed in the literature Citation28.
4.3. Electrical stimulation of cardiac cells
Throughout the measurements spontaneous contractions of CM cells were observed. The arrows () show when these contractions take place in the time course of the measurement. The frequency of contraction varied for different cells and typically exhibited contractions of 0.2–1 Hz or single contractions with a periodicity of 1–2 contractions per minute. We did not find any correlation in the pH signal of CM cells during these spontaneous contractions, which is consistent with the intracellular buffer capability and the second's time constant of our IrOx electrodes.
Figure 5. (a) Time course of the open circuit potential of the IrOx pH microelectrode during an acidification rate measurement on single cardiac myocytes in a 160 pL volume in normal Tyrode's solution with 1.8 mM Ca2+. The arrows indicate when spontaneous contraction takes place. The inset shows a detail view of the two configurations used for electrical stimulation of single cardiomyocytes, (c) Electrical simulation is parallel (d) and perpendicular to the longitudinal direction of the cardiac myocytes. 1, 2, 6–iridium oxide pH sensitive electrodes; 3, 4, 5, 7–stimulation electrodes. (b) Time course of open circuit potential of pH measurement of cardiac myocyte single cell during short bursts of electrical stimulation (10 pulses, amplitude 1.5 V; duration 10 ms; frequency 1 Hz).
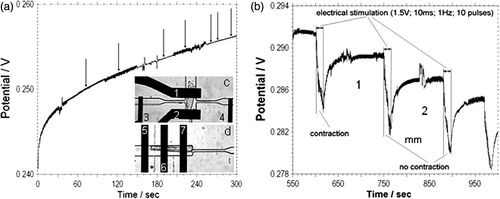
The second goal of our research was to explore the effects of electrical stimulation on acidification rates of cardiac myocytes. One of the serious problems in these measurements is that the electrical impulse causes a shift in the sensing electrode potential that in turn complicates the interpretation of the results. shows the potential difference between the pH and the reference electrode during a train of 10 electrical pulses, 1.5 V in amplitude and 10 ms long at a frequency of 1 Hz. In region 1 we observed contractions initiated by the field potential generated by the stimulation electrodes. In region 2 the cell did not contract when exposed to the electric field pulses. Analyzing and superimposing the data showed that the regions were identical. Furthermore, changing the polarity of the stimulation pulses as well as implementing a biphasic stimulation protocol or changing the direction of the stimulation field relative to the pH sensing electrodes did not change the measured potentials. Therefore, we hypothesise that electrical stimulation and contraction does not directly affect acidification rates after short stimulation bursts. This hypothesis is consistent with results by Cheng et al. Citation29 using fluorescent techniques to measure the extracellular pH.
4.4. Acidification rate measurement of cardiac cells in microliter volume
In order to validate our single cell measurements we investigated the pH behaviour of the CM cells in the small volumes and compared these results with the pH measurement on single cell. For this purpose, we used a standard needle type pH electrode (MI-413 combination pH electrode from Microelectrodes Inc) with a diameter of 1.4 mm as a pH sensor. The reference electrode was included in the pH electrode. We used the input port of our PDMS microdevice with a diameter of 1.4 mm (height 10 mm) as the reservoir for the CM cells (). Based on the geometrical average size of a CM cell (60–100 µm in length and 22–40 µm in width) ∼1000 cells could potentially occupy the bottom of the reservoir. However, in reality we can only assume a 50% cell density packing and a viability of 50% therefore we estimate that about ∼200–300 cells contribute to the acidification process ().
Figure 6. (a) Acidification rate measurements (MI-413 combination pH electrode) on the freshly isolated (b1, c1) and 3 hour post isolation (b2, c2) cardiac myocytes suspended into 0.7 mm3 (curve c1 and c2) and 12 mm3 (curve b1 and b2) volume respectively. Period a–calibration of pH electrode in three different buffer solutions. (b) Cross-sectional schematic view of the MI-413 electrode during pH measurements in 12 mm3 (b) and 0.7 mm3 (c) volumes. (c) Optical image of cardiac myocyte cells and MI-413 electrode during pH measurements in a 0.7 mm3 volume.
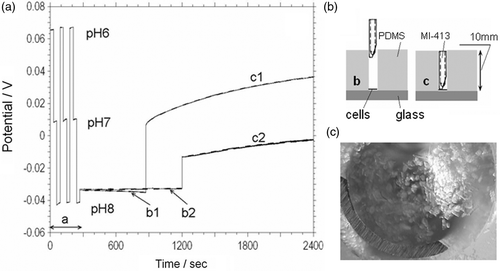
Our experiments were made according to the following protocol: (i) calibration of the pH electrode in three different buffer solutions (, segment a); (ii) adding the CM cell suspension to the reservoir; (iii) measuring the acidification rate of the CM cells using a pH electrode situated at on the top of the reservoir (, segment b1, b2; ); (iv) reducing the head space and measuring the acidification rate with the pH electrode situated at the bottom of the reservoir (, segment c1, c2; ). shows the results of two such experiments, using freshly isolated cardiomyocytes (b1, c1) and 3 hours post isolation (b2, c2). Curve c1, c2 corresponds to the measurements when the distance between the bottom of the reservoir and the top of the pH electrode was 0.5 mm (volume ∼0.7 mm3) and curve b1, b2 was obtained for the distance of 8 mm (volume ∼12 mm3). The acidification rate (AR) values were estimated, based an electrode pH sensitivity of 55 mV/pH.
The AR measurements on cells which were isolated 3 hours prior the experiment were 9.6 mpH/min compared to 24 mpH/min for fresh cells in Tyrode's with 1.8 mM Ca2+ (). The higher AR measurements on the fresh cells can certainly be attributed to a higher viability of CM in these experiments. We practically did not observe changes during pH measurement in 12 mm3 volumes (). These data validate the acidification rate measurements performed on single cardiac cells.
5. Conclusion
We combined electrochemical potentiometric pH sensing and microfluidic technologies to fabricate a nanophysiometer, which can be utilised to measure the acidification rate of single cells confined in a restricted extracellular space. Accidification rate measurements from single cardiac myocytes trapped and confined in a 160 pL extracellular space depend on the Ca2+ concentration in the media. The device is optically transparent and it is straight forward to integrate fluorescence imaging techniques with electrochemical sensing in order to monitor complex dynamic cellular processes on the single cell level. We plan to use the nanophysiometer to investigate the coupling between excitability and metabolism in isolated cardiac cells under conditions similar to ischemia. However, we expect the largest commercial potential for nanophysiometer arrays in high-content, high throughput drug screening efforts.
Acknowledgements
We would like to thank I.A. Dzhura for helpful discussions and the isolation of the cardiomyocytes. This work was supported in part by the Vanderbilt Institute for Integrative Biosystems Research and Education (VIIBRE) and NIH grant 5U01AI061223-03.
References
- Sims , CE and Allbritton , NL . 2007 . Analysis of single mammalian cells on-chip . Lab on Chip , 7 : 423 – 440 .
- Demaurex , N . 2005 . Calcium measurements in organelles with Ca2+-sensitive fluorescent proteins . Cell Calc. , 38 : 213 – 222 .
- Tsien , RY . 1997 . Ab. Papers Am. Chem. Soc. , 213 : 474 – 475 .
- Giepmans , BNG . 2006 . The fluorescent toolbox for assessing protein location and function . Science , 312 : 217 – 224 .
- Edwards , MA . 2006 . Scanning electrochemical microscopy: principles and applications to biophysical systems . Physiol. Meas. , 27 : R63 – R108 .
- Wightman , RM . 2006 . Probing cellular chemistry in biological systems with microelectrodes science . Science , 311 : 1570 – 1574 .
- Bruns , D . 2004 . Detection of transmitter release with carbon fiber electrodes . Methods , 33 : 312 – 321 .
- Pearce , TM and Williams , JC . 2007 . Microtechnology: meet neurobiology . Lab on Chip , 7 : 30 – 40 .
- Haque , AU . 2007 . Biochips and other microtechnologies for physiomics . Expert Rev. Proteomics , 4 : 553 – 563 .
- Laschi , S and Mascini , M . 2006 . Planar electrochemical sensors for biomedical applications . Med. Eng. Phys. , 28 : 934 – 943 .
- Ricci , F . 2005 . Novel planar glucose biosensors for continuous monitoring use . Biosens Bioelect. , 20 : 1993 – 2000 .
- Ges , IA . 2005 . Thin-film IrOx pH microelectrode for microfluidic-based microsystems . Biosens Bioelect. , 21 : 248 – 256 .
- Cosofret , VV . 1996 . Calcium selective polymeric membranes for microfabricated sensor arrays . Anal. Lett. , 29 : 725 – 743 .
- Tymecki , L , Glab , S and Koncki , R . 2006 . Miniaturized, planar ion-selective electrodes fabricated by means of thick-film technology . Sensors , 6 : 390 – 396 .
- Bratten , CDT , Cobbold , PH and Copper , JM . 1998 . Single-cell measurements of purine release using a micromachined electroanalytical sensor . Anal. Chem. , 70 : 1164 – 1170 .
- Cai , XX . 2002 . Ultra-low-volume, real-time measurements of lactate from the single heart cell using microsystems technology . Anal. Chem. , 74 : 908 – 914 .
- Owicki , JC . 1994 . The light-addressable potentiometric sensor: principles and biological applications . Ann. Rev. Biophys. Biomol. Struct. , 23 : 87 – 113 .
- Wille , K , Paige , LA and Higgins , AJ . 2003 . Application of the Cytosensor™ microphysiometer to drug discovery . Receptors & Channels , 9 : 125 – 131 .
- Weibel , DB . 2005 . Torque-actuated valves for microfluidics . Anal. Chem. , 77 : 4726 – 4733 .
- Marzouk , SAM . 1998 . Electrodeposited iridium oxide pH electrode for measurement of extracellular myocardial acidosis during acute ischemia . Anal. Chem. , 70 : 5054 – 5061 .
- Yamanaka , K . 1989 . Anodically electrodeposited iridium oxide films (AEIROF) from alkaline solutions for electrochromic display devices . Jap. J. App. Phys. Part 1 , 28 : 632 – 637 .
- Yamanaka , K . 1991 . The electrochemical behavior of anodically electrodeposited iridium oxide films and the reliability of transmittance variable cells . Jap. J. App. Phys. Part 1 , 30 : 1285 – 1289 .
- Marzouk , SAM . 2003 . Improved electrodeposited iridium oxide pH sensor fabricated on etched titanium substrates . Anal. Chem. , 75 : 1258 – 1266 .
- Bezbaruah , AN and Zhang , TC . 2002 . Fabrication of anodically electrodeposited iridium oxide film pH microelectrodes for microenvironmental studies . Anal. Chem. , 74 : 5726 – 5733 .
- Vanhoudt , P , Lewandowski , Z and Little , B . 1992 . Iridium oxide pH microelectrode . Biotech. Bioeng. , 40 : 601 – 608 .
- Werdich , AA . 2004 . A microfluidic device to confine a single cardiac myocyte in a sub-nanoliter volume on planar microelectrodes for extracellular potential recordings . Lab on Chip , 4 : 357 – 362 .
- Marquez , MT . 1997 . The energetics of the quiescent heart muscle: high potassium cardioplegic solution and the influence of calcium and hypoxia on the rat heart . Acta Physiol. Scand. , 160 : 229 – 233 .
- Anelli , LC . 2004 . Effects of temperature and calcium availability on ventricular myocardium from the neotropical teleost Piaractus mesopotamicus (Holmberg 1887-Teleostei, Serrasalmidae) . J. Thermal. Biol. , 29 : 103 – 113 .
- Cheng , W . 2006 . Metabolic monitoring of the electrically stimulated single heart cell within a microfluidic platform . Lab on Chip , 6 : 1424 – 1434 .