
 ?Mathematical formulae have been encoded as MathML and are displayed in this HTML version using MathJax in order to improve their display. Uncheck the box to turn MathJax off. This feature requires Javascript. Click on a formula to zoom.
Abstract
The study of inter-annotator agreement in musical pattern annotations has gained increased attention over the past few years. While expert annotations are often taken as the reference for evaluating pattern discovery algorithms, relying on just one reference is not usually sufficient to capture the complex musical relations between patterns. In this paper, we address the potential of digital annotation tools to enable large-scale annotations of musical patterns, by comparing datasets gathered with two recently developed digital tools. We investigate the influence of the tools and different annotator backgrounds on the annotation process by performing inter-annotator agreement analysis and feature-based analysis on the annotated patterns. We discuss implications for further adaptation of annotation tools, and the potential for deriving reference data from such rich annotation datasets for the evaluation of automatic pattern discovery algorithms in the future.
1. Introduction
A significant number of topics currently researched in the field of Music Information Retrieval (MIR) rely heavily on using reference or “ground truth” data, often derived from human annotations, for the evaluation of algorithms. The comparison of state-of-the-art algorithms on the different tasks in the yearly rounds of the MIREX (The Music Information Retrieval Evaluation eXchange) framework has uncovered the issue of ambiguity of musical structures for evaluating algorithms, most notably by uncovering differences in annotations. For instance, CitationFlexer and Grill (2016) discovered a rather low inter-annotator agreement for the MIREX music similarity task, unveiling the problem of using a single-reference annotation for evaluating similarity algorithms. CitationKoops et al. (2019) reached similar conclusions for the chord estimation task, showing low inter-annotator agreement for chord annotations between musical experts. Furthermore, CitationBalke et al. (2016) showed how the evaluation of automatic melody finding algorithms depends heavily on the choice of the human annotator for providing the ground truth.
The automatic discovery of musical patterns has been a long standing research topic in computational music analysis (CitationJanssen et al. 2013), evolving into the MIREX task termed Discovery of Repeated Themes & Sections (CitationCollins 2011, Citation2019; CitationRen, Volk, et al. 2018). In this task, the evaluation of newly-proposed algorithms is carried out with reference annotations based on music-theoretic analyses by three experts. However, the ambiguity of musical structures and the different conceptualisations of the notion of patterns make the use of reference data relying on only a very small number of experts rather problematic: there is no clear single comprehensive definition of what constitutes a pattern, or even repetition (CitationTaube 1995; CitationMargulis 2014; CitationCollins 2019; CitationMelkonian et al. 2019; CitationSears and Widmer 2020). For example, a musical pattern can be described as “a salient recurring figure or short musical idea of special importance” (CitationNieto and Farbood 2012), while the MIREX task defines patterns as a “set of ontime-pitch pairs that occur at least twice (i.e. is repeated at least once) in a piece of music” (CitationCollins 2019). Moreover, not all recurring sequences are perceived as patterns by the listener, as this depends on the structural position of the pattern (CitationMargulis 2014), the listener's moment-to-moment perception, and other influencing factors such as the listener's musical background or music theoretic education. Automatically discovered patterns do not have to be perceivable, if they are useful in other contexts, such as for supporting automatic composition (CitationHerremans and Chew 2017) or classification (CitationBoot, Volk, and de Haas 2016). However, in other contexts it is important that automatically detected patterns are perceivable for listeners, such as in music education (CitationBamberger 2000).
Gathering annotations from different listeners on the same pieces therefore allows the study of differences and commonalities between listeners regarding their conceptualisation of patterns. Such a study can pave the way for a more valid evaluation of algorithms, based on the consideration of commonalities and differences between listeners or groups of listeners, instead of a very small number of annotators. The issue of inter-annotator agreement in pattern discovery was previously addressed by CitationNieto and Farbood (2012) through gathering multiple annotations for a single dataset from fourteen annotators on six music excerpts using pen and paper. This dataset was later digitised as the HEMAN (Human Estimations of Musically Agreeing Notes) dataset in CitationRen, Koops, et al. (2018). In analysing the patterns, considerable disagreement between the annotators was discovered. This disagreement could be reduced by considering the relevance/confidence scores of patterns marked by the annotators and by lowering the time resolution to allow for more tolerance towards differences in start and end times of annotations.
While pen-and-paper annotation has been most commonly used for music-theoretical analysis in the past, the digitisation process afterwards is labour-intensive and error-prone. Accordingly, for carrying out larger annotation experiments on musical patterns, digital tools supporting these annotations need to be developed. This paper analyses the pattern datasets gathered with two recently developed digital annotation tools, ANOMIC (CitationWells et al. 2019) and PAF (CitationPesek et al. 2019), using the same musical pieces as in the HEMAN dataset. While these tools overcome the problems of handwritten annotations, they can influence the annotation process in different ways, such as through different music visualisations. We explore the influence of different annotation interfaces and instructions on the discovered patterns, and study differences and commonalities between patterns discovered by annotators of different musical expertise and from different music theoretic schools. We first explore the gathered annotation datasets by performing inter-annotator agreement analysis (Section 4.1), and then employ in a second step a feature analysis of the patterns (Section 4.2) by looking into differences between feature distributions of musical patterns in both datasets. This feature analysis allows more detailed insight into the differences between the pattern datasets. Finally, we discuss the implications of the tools and annotators' backgrounds on the annotation process, and the implications regarding future evaluation methods of pattern discovery algorithms based on rich annotation datasets.
2. Materials and procedure
In this section, we review two digital pattern annotation tools that were developed concurrently – ANOMIC and PAF – and two annotation experiments conducted separately using these tools. While both tools allow for easier digital annotation of patterns, they differ in their implementation, functionality, interface, and music representation.
2.1. Tools
The ANOMIC (AnNOtate MusIC) tool for pattern annotation was developed as a standalone application for the Windows operating system (CitationWells et al. 2019). The main view of the tool visualises the MIDI representation of a music piece as a piano roll by plotting the musical notes as rectangles on a two-dimensional onset-time – pitch canvas. This approach is also commonly used in music editing software, as it allows for easy interaction with MIDI elements (most commonly musical notes). Figure (a) shows ANOMIC's interface, where the piano roll representation is visible.
Figure 1. Examples of annotation sessions in the ANOMIC and PAF tools. ANOMIC uses a piano roll representation, PAF uses sheet music representation.
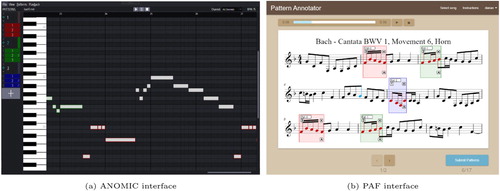
The PAF (Pattern Annotation Framework) toolFootnote1 was developed as an online application (CitationPesek et al. 2019) and it visualises the sheet music of a selected piece of music, as seen in Figure (b). Thus, it is designed to be used mainly by individuals with musical expertise in order to acquire insightful annotations that are based on musical knowledge. By open-sourcing the tool,Footnote2 the authors hope to aid other researchers in the MIR field who are dealing with pattern-related data gathering and to invite them to contribute additional features to the tool.
Differences between the tools: The most glaring difference between the tools concerns the different visualisations of music they employ: piano roll or sheet music. These different visualisations can influence the users' annotation process. For example, the sheet music representation of PAF is more compact, since notes take up less space than bars. Thus, it is possible to fit larger sections of a music piece onto the screen.
The tools also differ in how they enable the selection of patterns and the annotation of their occurrences. ANOMIC offers click-and-drag actions to select patterns, while annotating with the PAF tool is done by clicking on the starting and then ending note of a pattern. The click-and-drag approach could be perceived as more intuitive, especially considering the left-to-right piano roll visualisation. When the annotation starts, for both tools, a default pattern number (ID) is given at first, and if the users proceed to a different group of pattern occurrences, they must use a new number to signify this new group.
ANOMIC also enables users to automatically annotate exact repetitions and chromatic transpositions of already annotated patterns, as implemented by an automatic occurrence matching function (CitationWells et al. 2019). This function may ease the labour-intensive search necessary in order to annotate all occurrences of a pattern, which is non-trivial for annotators (see CitationVolk and Van Kranenburg 2012). While PAF was later updated to include such an automatic annotation feature, it was not available in the version used for gathering the data for the current analysis.
The tools take different data gathering approaches. ANOMIC is a standalone tool and can be used offline. The gathered patterns must then be submitted via external means, which can affect the number of gathered submissions. Meanwhile, PAF is implemented as an online tool, which automatically saves the annotated patterns in a database. In addition, users must first register and provide their background information to access the tool. In comparison, the ANOMIC tool does not come with built-in registration or user information gathering functionality, so researchers must resort to online surveys. The tools also differ in the overall annotation process: PAF does not allow re-annotation of music pieces and only allows annotation of the provided music pieces, while ANOMIC allows annotation of any music piece the user provides. We summarise the main differences between these two tools in Table .
Table 1. Summary of main differences between the ANOMIC and PAF annotation tools and user backgrounds.
2.2. Data
Both tools were used to conduct separate pattern gathering experiments on six monophonic music excerpts from the experiment in CitationNieto and Farbood (2012), which have previously been used for gathering the HEMAN dataset by CitationRen, Koops, et al. (2018):
Bach–Cantata BWV 1, Mv. 6, Horn (20 bars)
Bach–Cantata BWV 2, Mv. 6, Soprano (15 bars)
Beethoven–Sq., Op.18, No.1, Violin I (60 bars)
Haydn–Sq., Op.74, No.1, Violin I (30 bars)
Mozart–Sq., K.155, Violin I (28 bars)
Mozart–Sq., K.458, Violin I (54 bars)
These pieces have been selected by CitationNieto and Farbood (2012) for pattern annotation experiments due to their differing musical characteristics. For example, the Bach chorale is short and has very little rhythmic variation, while the Beethoven string quartet is long, and has clear repetitions varied in pitch. For long pieces, we use roughly the first page of sheet music (precise bar numbers are included in the listing).
2.3. Procedure: instructions
For the PAF tool, the instructions for the participants closely followed the ones used in CitationNieto and Farbood (2012) for musical experts:
“A musical pattern or motive is defined as a short musical idea, a salient recurring figure, musical fragment, or succession of notes that has some special importance in or is characteristic of a composition. It should not be longer than a musical phrase. If you find a motive that is similar to another (or multiple versions of a motive), choose the one that you think is the most representative.”
For ANOMIC, a demo video for the experiment was provided and the instructions on the pattern annotation, accessible to users with little musical training, were as follows:
“Patterns are distinct, short musical segments or phrases that are considered to be characteristic to a given piece of music and appear multiple times throughout the piece. Be sure to listen to the music and annotate these patterns and their occurrences using the tool. The occurrences don't need to be exact matches, but they should be closely related (compare this to finding occurrences of a leitmotif in a film soundtrack, for example).”
The description of a musical pattern is similar across the two experiments. There are two marked differences between the instructions: whether participants were asked to listen to the music, and how to annotate occurrences of a pattern. While the instructions of ANOMIC explicitly mentioned the importance of occurrences, PAF users were instructed to choose a representative pattern when they see multiple similar ones. ANOMIC users were explicitly asked to listen to the music, whereas PAF users were not. In our analysis in Section 4, we will treat these differences in parallel with the differences of the tools. To be clear about our terminology, henceforth, by “annotations,” we mean the data entries created by the annotators; by “occurrences,” we mean the repetitions of patterns.
2.4. Procedure: data collection experiments and participants
Throughout the two experiments, 1155 pattern annotations were gathered from 39 annotators. 26 of the annotators were involved in the ANOMIC experiment and 13 in the PAF experiment. General information about the annotators (e.g. background surveys regarding musical expertise) was also gathered, thus enabling analysis of relations between the users' backgrounds and the annotations.
In the ANOMIC experiment, users installed the tool on their computers and were then asked to submit their annotations via email, along with a completed survey about their background. In total, 788 patternsFootnote3 were gathered, annotated by 26 participants with diverse backgrounds. The participants' levels of musical expertise were assessed through a survey including 10 questions (e.g. ability to read sheet music, proficiency in playing an instrument, academic degree in music), leading to a score between 1 and 10. The annotators were then split into two groups with the cutoff at 5, termed the musicians (14 participants) and the non-musicians group (12 participants), as a rough approximation of their musical expertise (see CitationWells et al. 2019 for all details). The average scores are 6.71 with a standard deviation of 1.98 for the musicians and 2.42 with standard deviation of 1.31 for the non-musicians group. In future experiments, more sophisticated musical expertise indexes could be used, following CitationMüllensiefen et al. (2014).
The PAF tool was used by experts only, namely 13 students attending three faculty study programmes: 4 students from the musicology masters programme at the Faculty of Arts, University of Ljubljana (in the following termed as MU), 3 students of the Music Academy, including music theory and composition at the University of Ljubljana (termed as TC), and 6 students from the music pedagogy programme at the Faculty of Education, University of Maribor (termed as PE). The registration process collected the above information regarding the users' musical backgrounds. Once logged in users were presented with a description of the tool and a summary of its features. In total, 367 annotations were gathered. The majority of participants had between 5–10 years of instrument experience and between 8–15 years of music theory experience.
3. Methods
There are two main exploratory aspects of our analysis: differences between annotators with different backgrounds and differences between annotations gathered with two different tools. Both will be explored by analysing inter-annotator agreement and by analysing the distributions of various pattern features, for gaining deeper insight as to why annotators might have disagreed. In the following, we describe these methods in more detail.
3.1. Inter-annotator agreement
We adopt the methodology for computing inter-annotator agreement from CitationRen, Koops, et al. (2018) and provide a summary below. An important concept for computing agreement is that of “matched” annotations. Given two pattern occurrences and
, with beginnings and endings denoted as
,
and
,
, were considered to be matched when
, where T denotes a threshold value. The vertical bar notation indicates “taking absolute value” to disambiguate from taking cardinality of sets.
Given two sets of pattern occurrences R and C from two annotators, we call one set the reference (R). It does not matter which set is taken as the reference, because we will eventually consider the other set as the reference as well. Using as “the number of” sign, we then calculate the commonly used measures, namely, precision (
), recall (
), and
score (the harmonic mean of recall and precision) for all possible pairings of annotators. Each individual annotator is compared to every other annotator.
With a number of annotations in a piece, we can expect the precision, recall, and score to give us a summary of the agreed patterns between any pairs of annotators. These measures will fit the intuition that the more far apart the different annotated pattern boundaries are, the more they disagree; the greater the number of patterns the annotators disagreed upon, the more two annotators disagree. For example, if annotator A noted that the second bar of a musical piece is a pattern, while annotator B included the last quaver of the first bar and the second bar as a pattern, we have the same pattern ending, but a slightly different beginning. The threshold value gives us the flexibility to configure whether the two annotators should be considered to be in agreement (matched) or not. In the example above, if the two patterns are the only annotations in the piece, we have an
score of 0 if T<1 quaver, 1 otherwise. In this way, we can see how much disagreement there is on different scales of time resolution. The reason that we focus on the beginnings and endings of patterns is that, within the same piece of music, once the beginnings and endings are determined, the content of the excerpt is the same for monophonic melodies.
In the following analysis the starts and ends were measured in crotchets and the threshold was set to 5 crotchets as default for this paper, following CitationRen, Koops, et al. (2018). We will also see that a threshold of 1 crotchet was used for comparison later on. In future work, other threshold values or dynamic thresholds should be investigated.
We will not make a comprehensive cross-comparison between ANOMIC and PAF using this measure, because of the single- or multiple-occurrence difference in the instructions of the tools. The concept of “matching annotations” is a complicated one if we compare the most representative occurrence annotation of a pattern with all the occurrences annotated for a pattern. In addition, “the most representative” and “all occurrences” are not guaranteed as the annotators can only do the best they can. We will, therefore, leave this to be explored in future work.
3.2. Feature-based annotation comparison
In order to further explore the differences between annotations of the two digital tools, we compared both annotation datasets on 33 different pattern features, of which we report 7 here, for simplicity, while all 33 musical features are described in detail online. Footnote4 Most of the features were inspired by the work of CitationCollins (2011), in which musical patterns were rated based on a myriad of musical features from past research, including CitationMeredith, Lemström, and Wiggins (2002), CitationPearce and Wiggins (2007), CitationConklin and Bergeron (2008), CitationForth and Wiggins (2009), as well as CitationCambouropoulos (2006) and others. Several features were also inspired by the research of CitationVan Kranenburg, Volk, and Wiering (2013), in which global and local features of folk song melodies were compared.
To compare features of the patterns, we take the first occurrence of each pattern annotated in ANOMIC, as PAF annotators only annotated the most representative occurrence of each pattern. We take the first occurrence because the first occurrence of a pattern in a musical piece tends to have a more significant role according to CitationSchoenberg (1967). This taking-the-first-occurrence approach has an exception for one feature, the Occurrence feature, where we use all occurrences from ANOMIC to see whether the annotators actually followed the instructions closely regarding annotating single or multiple occurrences.
We then computed musical features of each pattern, thus forming feature distributions for both datasets. Next, the distributions of each feature were normalised by taking the minimum and maximum values across both distributions and performing min-max scaling. The computation process of each feature is described in detail in the supplemental online material,4 which also includes the Python source code used for the analysis.
In Table , we list the 7 features included in this paper, namely those which we considered to be most intuitively related to pattern characteristics perceivable by users (such as the duration of the last note or the note range). Notice that the Occurrence feature is what we mentioned as an exception to the taking-the-first-occurrence approach above. Furthermore, following the comparison of local and global features in CitationVan Kranenburg, Volk, and Wiering (2013), we focussed on local features, which are more likely to be assessed by humans when annotating patterns. We further reduced the number of important features by analysing the Spearman's and Pearson correlation coefficients between pairs of features. The highest Pearson correlation value appeared between the feature pattern duration and note range, which has a correlation of 0.64 and 0.65 for ANOMIC and PAF. Tables of the most correlated features for each dataset can be accessed online.4
Table 2. Descriptions of pattern features analysed in this paper.
Our last step to analyse pattern features is based on independent two-sample Student tests (t-tests), two sample Kolmogorov-Smirnov tests (KS-tests) and boxplot visualisations of distributions. Given our null hypothesis that the samples are drawn from the same distribution, and that we are unsure whether our data is normally distributed, we use both parametric and nonparametric tests for verifying how likely it is that the distributions actually differ. The differences are represented by high t and D statistic values in combination with low p values of the performed tests. We also considered boxplot visualisations of the distributions to better understand the shapes of the distributions and the differences between them.
4. Results
4.1. Inter-annotator agreement
In order to analyse inter-annotator agreement we computed the scores of all annotator pairs across all music pieces. We gathered these values in
score matrices, which allow for a concise presentation of results. Figure shows these matrices, in which annotators are grouped based on the annotation tool used and their backgrounds. The analysed groups include the TC, MU and PE groups of PAF as well as the musician and the non-musician groups of ANOMIC (see Section 2.4). Based on the obtained inter-annotator agreement values, we refer to the values above 0.95 (yellow matrix values) as indicators for a strong agreement in this paper. It should be noted that the number of annotations was not split equally among music excerpts, as some annotators of the PAF tool did not annotate the last three excerpts. This was likely due to the fixed order of music excerpts and the significant time investment in the annotation process. Once this issue of the PAF tool was identified, it was reported and addressed by the developers who randomised the ordering to improve the tool for future use.
Figure 2. score matrices, representing pairwise agreement between annotators, with the time threshold set to 5 crotchets. Each matrix showcases results for a different music excerpt. Matrix columns and rows denote different annotators, grouped based on the annotation tool used (PAF or ANOMIC) and their musical background. Matrix cell colours (These figures are best viewed in an online version of the paper.) correspond to the obtained pairwise agreement values, where yellow denotes high agreement and blue indicates low. Some annotators did not provide annotations for all excerpts, which can be seen along the diagonals as low agreement.
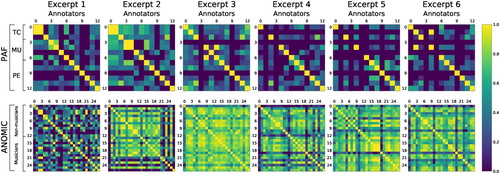
The TC and MU groups show strong agreement on the first three music excerpts. Meanwhile, the results of the PE group show many weaker agreements, despite a larger number of annotators. Contrary to the TC and MU groups, the annotators of the PE group did somewhat agree in the annotations for excerpt 4. There is only one strong agreement between annotators belonging to different groups (excerpt 6, annotators 1 and 4). Since there are several strong agreements between the annotators within individual groups, the lack of agreement between different groups could indicate the potential influence of different study programmes on the annotators' perception of the most representative musical patterns.
For ANOMIC, the agreement values for the two subgroups are similar: the average inter-annotator agreement for the musician group is 0.61, and 0.63 for non-musicians. While some agreement does exist between the ANOMIC and PAF annotators, we only observe one strong agreement between two PAF annotators and one non-musician annotator of ANOMIC in excerpt 1. We do not make further comparisons between PAF and ANOMIC disagreements, as a range of factors could have contributed to their differences, such as differences in instructions and the threshold value.
Next, we lower the threshold for agreement computation from 5 crotchets to 1 to see what changes may be brought on to our results by a different threshold value. The agreement values become much smaller among the ANOMIC non-musicians (0.38) and the musicians (0.47), for the crotchet threshold of 1. For the same threshold the average agreement between all ANOMIC participants was 0.40.
We have an additional note for these comparisons. In taking averages, we can compare between groups while marginalising the effects of individual differences between musical pieces. We are aware that this is not always valid because there is a varying degree of difficulty in finding patterns across different musical pieces. It is possible that a group of annotators disagree strongly on one single piece and agree perfectly with each other on the rest, which would be obscured in the average, with the music being a confounding factor. However, in Figure , we see a range of disagreement and agreement. Admittedly, excerpt 1 is more disagreed upon than others, so we also calculated the values by only using the other five excerpts, and the results and conclusions did not change. Furthermore, the computation of the average was based on the whole matrices, thus including values where users did not provide any annotations. These values were simply set to 0 and were included in the computation. We also analysed the average values if these values were ignored. Despite affecting the average values of the comparison, the changes in values were not significant since the values, based on PAF users, simply increased by around 0.01. Thus, we decided to only report the original values, which included missing annotations.
4.2. Feature-based comparison of annotation datasets
As introduced in Section 3, we analysed, for each pattern feature, the annotations of ANOMIC annotators with musical and non-musical backgrounds and compared them to the PAF dataset, whose annotators all had a musical background. We investigated whether the difference between datasets was also present in these background subgroups to identify if the observed difference between the PAF and the ANOMIC dataset was influenced primarily by the tools or the musical backgrounds of the annotators.
The results of the analysis revealed 23 out of the 33 features, where significant differences were seen between the annotations of the PAF and the ANOMIC tool. We then eliminated several features, based on how intuitive they are and their correlations, and narrowed the list down to 7 features: pattern duration, occurrences, last note duration, note range, pitch direction changes, intervallic leaps and root notes. These features are also listed in Table , along with their descriptions. Plotted distributions of these features can be seen in Figure . The calculated t and p values of the t-tests between the selected features are shown in Table . A list of all analysed features, all t-test and KS-test results as well as all boxplot visualisations are available online.4
Figure 3. Boxplots showcasing the distributions (These figures are best viewed in an online version of the paper.) of the analysed pattern features of the PAF and the ANOMIC datasets. For each feature the two distributions were normalised.
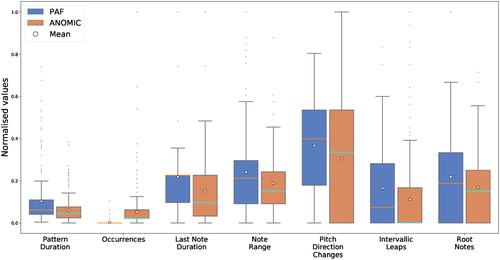
Table 3. Table showing t and p values of t-tests between the PAF and the ANOMIC (Mus. and Non-Mus.) datasets on the features of the first column.
4.2.1. Duration and occurrence features
The first of the features we analysed was the Pattern Duration feature, which measures the length of a pattern in crotchets (quarter notes). We observed that the ANOMIC distribution had much smaller overall and interquartile ranges than the PAF distribution. The mean and median values of the distribution were also much smaller.
Next was the Occurrences feature, which refers to the number of times that a pattern occurs in a music excerpt, as defined by CitationCollins (2011). From the boxplots in Figure it is evident that the PAF distribution differs drastically from the ANOMIC distribution, which is expected due to the difference in instructions give about whether to annotate all occurrences or not. This result confirms that the annotators followed the instructions closely in this respect.
Differences between the two datasets were also seen for the Last Note Duration feature, which describes the duration of the last note of a pattern. Here the ANOMIC distribution had larger interquartile and overall ranges than the PAF distribution, while its mean and median values were lower.
Results of the t-tests in Table and the KS-tests (available online)4 confirmed that the above mentioned differences between distribution pairs were statistically significant. Furthermore, they revealed that the differences between the PAF dataset and the two subgroups of the ANOMIC dataset, based on musical backgrounds, were also statistically significant. Thus, we may conclude that the differences between feature distributions of pattern datasets were caused by varying musical background but also possibly by the interfaces or the instructions of the annotation tools.
4.2.2. Pitch-based features
The two annotation datasets also differed on the Note Range feature, which describes the number of semitones between the lowest and highest note of a pattern. Figure shows that the PAF distribution has a much larger overall and interquartile range than the ANOMIC distribution. Its median and mean values are also higher.
Similar differences were also seen for the Pitch Direction Changes feature, which is defined as the number of melodic arcs in a pattern (inspired by various melodic arc features in CitationVan Kranenburg, Volk, and Wiering 2013). Our analysis showed that the ANOMIC distribution had a much larger overall and interquartile range. Furthermore, the distribution lacks the bottom whisker, thus being more positively skewed. The ANOMIC distribution also had significantly lower mean and median values.
We observed comparable differences among the Intervallic Leaps feature distributions. The feature describes the fraction of all melodic intervals of a pattern whose note range is larger than two semitones, as defined by CitationCollins (2011). Considering the analysis results, we see that the PAF distribution has much larger overall and interquartile ranges. Its median and mean values are also significantly higher.
Finally, differences were seen for the Root Notes feature, which describes the fraction of notes in a pattern that are root notes or octaves of roots of the music piece. From the distributions present in Figure , we can discern that the distributions mainly differ in the overall and interquartile ranges, with the PAF distribution having much larger ranges than the ANOMIC distribution. We also note that the mean value as well as the standard deviation of the PAF distribution are slightly higher that those of ANOMIC.
By analysing the t-test results from Table and the KS-test results (available online),4 we confirm that the distribution differences of the first three pitch-based features between the two datasets are statistically significant. We notice that these three features pertain to the relationships between notes in the patterns and are therefore melodically relevant. We can also discern that the differences are not statistically significant between the PAF group and the musician group of ANOMIC. However, the difference between musicians, both PAF and ANOMIC, and non-musicians of ANOMIC, is statistically significant.
For the Root Notes feature, the analysis shows that the difference between the two ANOMIC subgroup distributions is not statistically significant. Thus, they are considered to be similar. Meanwhile, the difference between the PAF distribution and both subgroup distributions is statistically significant.
5. Discussion
The analysis of the inter-annotator agreement and the feature-based comparison of the annotation datasets have revealed differences in the annotated patterns between user groups and between annotation tools and their instructions. The agreement results show that musical background has an influence on the annotations; annotators attending the same programme tend to agree more than others.
Several differences observed in the feature-based comparison of the annotation datasets point towards discrepancies in annotations caused by design differences in the tools and experiments. The PAF interface displays sheet music allowing a compact representation, with large sections of the music piece being presented to the user within a single view. By contrast, ANOMIC's piano roll representation generally displays fewer elements at once to the user in order to preserve element clarity. The difference in music visualisation might have caused users to perceive and annotate patterns with durations relative to the view window size. The notes in the sheet music representation of PAF remained roughly the same size, while the piano roll elements of ANOMIC varied in their size based on the durations. Since the last note durations of the PAF dataset are on average significantly longer, differently sized elements of the ANOMIC tool could have discouraged users from picking longer notes as pattern endings. The drastic difference between the occurrences feature distributions was likely caused by the lack of an automatic occurrence matching functionality in the PAF tool and by the difference in the instructions given to the users.
Moreover, we observed differences in note range, intervallic leaps, and pitch direction changes between ANOMIC non-musicians versus ANOMIC musicians and PAF annotators. The t-test analysis showed that the differences were not statistically significant between the PAF group and the musician group of ANOMIC. However, the difference between musicians, both PAF and ANOMIC, and non-musicians of ANOMIC, was statistically significant. We therefore conclude the varying musical background of the ANOMIC annotators as the underlying cause, and exclude the potential influence of the annotation tools. Finally, for the root notes feature we are unsure what might have caused the difference in distributions, though we believe it is not caused by the musical background based on the lack of difference between feature distributions of the ANOMIC musicians and non-musicians.
In this first explorative study of comparing annotation tools, we did not streamline instructions for musical experts (PAF) with instructions also addressing non-musicians (ANOMIC). Including more specific instructions in the future may enable more controlled conditions when comparing different tools. For instance, an instruction to first listen to the music without consulting the visualisation before starting with the annotation process, might decrease an otherwise perhaps strong tendency of users to annotate patterns they can visually identify. Nevertheless, each music visualisation will have an influence on the annotation process to a certain extent. Musical experts may be most familiar with sheet music, but piano roll visualisations may be more accessible for annotators with less musical expertise. As our results indicate that the size of the musical excerpt that can be displayed in a single view to the user seems to influence the length of patterns annotated, this should be specifically considered when longer patterns are expected to be important for a specific corpus.
Moreover, the influence of the automatic occurrence matching functionality needs to be investigated in more depth in the future. If the goal of the annotation is to find all occurrences of a given pattern, as was the case in the ANOMIC experiment, it can alleviate the finding of the pattern occurrences for users, but might have the side effect of pointing users to occurrences they would not have deemed important otherwise. If only the most representative pattern should be annotated, as in the PAF experiment, such a tool can assist in highlighting all occurrences from which the user can then choose the most representative one for the annotation. More inexact repetition matching functions may be added so that the found pattern occurrences are not biased towards exact repetitions or chromatic transpositions. Either way, this calls for a systematic investigation of using tools with and without such functionality.
6. Conclusion
In this study, we compared two digital pattern annotation tools, PAF and ANOMIC, and analysed two pattern datasets collected with these tools on the same musical pieces, employing inter-annotator agreement analysis and feature-based analysis of musical patterns. Comparing the annotations collected with the PAF tool enabled us to study three groups of annotators from different musical study programmes. We observed higher agreement between annotators of the same group when compared to annotators of different groups, indicating a potential influence of study programmes on the understanding and perception of patterns in music. Comparing the annotations of the ANOMIC annotation set gave a similar result.
Our findings point to a major influence of the annotation tools, instructions, and the musical background of participants on the annotated patterns. As a next step, the influence of the tools should be studied in more detail using stricter controlled comparisons, including a clarification on how users should include their listening experience into the annotation process, and a controlled use of the automatic pattern matching functionality. Moreover, the analysis of the pattern datasets can be enriched by further investigations as to where annotators tend to agree, for instance by exploring dynamic thresholds for calculating inter-annotator agreement depending on the size of the patterns. Determining in more detail different levels of granularity as to when two pattern annotations can be considered as agreeing, even if the exact beginning and ending points are not identical, can further help to identify different layers of commonality betweenannotators.
We believe that the widespread use of digital tools in gathering pattern annotations is inevitable in the near future. Our findings point to several directions for improvements of large-scale data collection and analysis of musical patterns. The observed differences in annotations gathered with different tools call for further experiments and analyses for deriving technical design choices that fit the purpose of pattern annotations in an optimal way for a given context and annotator group. Establishing reference data for evaluating automatic pattern discovery algorithms from such rich annotation datasets can follow different directions. For instance, identifying subgroups of annotators that highly agree with each other can assist in establishing single-reference data based on a larger group of annotators. Establishing evaluation methods that take into account multiple reference annotations expressing different subjective interpretations of the same musical piece, can pave the way for a more adequate consideration of ambiguity and subjectivity in the evaluation of pattern discovery algorithms.
Supplemental online material
Supplemental data for this article can be accessed online at https://zenodo.org/record/4544002#.YO7bOD3iuUk.
Acknowledgement
We would like to thank the editors Darrell Conklin and Jason Yust, as well as the anonymous reviewers, for their constructive and helpful comments during the revision process.
Disclosure statement
No potential conflict of interest was reported by the author(s).
Notes
1 Tool available at http://framework.musiclab.si
2 Source code available at https://bitbucket.org/ul-fri-lgm/patternannotationframework
3 Available at https://github.com/StephanWells/ANOMIC-dataset
4 Results available at https://bitbucket.org/dariant1/agreement-in-musical-patterns
References
- Balke, S., J. Driedger, J. Abeßer, C. Dittmar, and M. Müller. 2016. “Towards Evaluating Multiple Predominant Melody Annotations in Jazz Recordings.” In Proceedings of the International Conference on Music Information Retrieval (ISMIR), 246–252. New York City, United States of America.
- Bamberger, J. S. 2000. Developing Musical Intuitions: A Project-Based Introduction to Making and Understanding Music. New York City, United States of America: Oxford University Press.
- Boot, P., A. Volk, and W. B. de Haas. 2016. “Evaluating the Role of Repeated Patterns in Folk Song Classification and Compression.” Journal of New Music Research 45 (3): 223–238.
- Cambouropoulos, E. 2006. “Musical Parallelism and Melodic Segmentation: a Computational Approach.” Music Perception 23 (3): 249–268.
- Collins, T. 2019. “Discovery of Repeated Themes & Sections – MIREX Wiki.” https://www.music-ir.org/mirex/wiki/2019:Discovery_of_Repeated_Themes_%26_Sections.
- Collins, T. E. 2011. “Improved Methods for Pattern Discovery in Music, with Applications in Automated Stylistic Composition.” PhD thesis, The Open University.
- Conklin, D., and M. Bergeron. 2008. “Feature Set Patterns in Music.” Computer Music Journal 32 (1): 60–70.
- Flexer, A., and T. Grill. 2016. “The Problem of Limited Inter-Rater Agreement in Modelling Music Similarity.” Journal of New Music Research 45 (3): 239–251.
- Forth, J., and G. A. Wiggins. 2009. “An Approach for Identifying Salient Repetition in Multidimensional Representations of Polyphonic Music.” In London Algorithmics 2008: Theory and practice, Texts in Algorithmics, 44–58. London, United Kingdom: College Publications.
- Herremans, D., and E. Chew. 2017. “MorpheuS: Generating Structured Music with Constrained Patterns and Tension.” IEEE Transactions on Affective Computing 10 (4): 510–523.
- Janssen, B., W. B. De Haas, A. Volk, and P. Van Kranenburg. 2013. “Finding Repeated Patterns in Music: State of Knowledge, Challenges, Perspectives.” In International Symposium on Computer Music Multidisciplinary Research, 277–297. Springer.
- Koops, H. V., W. B. de Haas, J. A. Burgoyne, J. Bransen, A. Kent-Muller, and A. Volk. 2019. “Annotator Subjectivity in Harmony Annotations of Popular Music.” Journal of New Music Research 48 (3): 232–252.
- Margulis, E. H. 2014. On Repeat: How Music Plays the Mind. New York City, United States of America: Oxford University Press.
- Melkonian, O., I. Y. Ren, W. Swierstra, and A. Volk. 2019. “What Constitutes a Musical Pattern?” In Proceedings of the 7th ACM SIGPLAN International Workshop on Functional Art, Music, Modeling, and Design, 95–105. Berlin, Germany.
- Meredith, D., K. Lemström, and G. A. Wiggins. 2002. “Algorithms for Discovering Repeated Patterns in Multidimensional Representations of Polyphonic Music.” Journal of New Music Research 31 (4): 321–345.
- Müllensiefen, D., B. Gingras, J. Musil, and L. Stewart. 2014. “The Musicality of Non-Musicians: An Index for Assessing Musical Sophistication in the General Population.” PLOS One 9 (2): e89642.
- Nieto, O., and M. M. Farbood. 2012. “Perceptual Evaluation of Automatically Extracted Musical Motives.” In Proceedings of the 12th International Conference on Music Perception and Cognition, 723–727. Thessaloniki, Greece.
- Pearce, M. T., and G. A. Wiggins. 2007. “Evaluating Cognitive Models of Musical Composition.” In Proceedings of the 4th International Joint Workshop on Computational Creativity, 73–80. London, United Kingdom.
- Pesek, M., D. Tomašević, I. Y. Ren, and M. Marolt. 2019. “An Opensource Web-Based Pattern Annotation Framework – PAF.” In Proceedings of the International Conference on Music Information Retrieval (ISMIR), 1–2. Delft, The Netherlands.
- Ren, I. Y., H. V. Koops, A. Volk, and W. Swierstra. 2018. “Investigating Musical Pattern Ambiguity in a Human Annotated Dataset.” In Proceedings of the 15th International Conference on Music Perception and Cognition and the 10th triennial conference of the European Society for the Cognitive Sciences of Music, 361–367. Graz, Austria.
- Ren, I. Y., A. Volk, W. Swierstra, and R. C. Veltkamp. 2018. “Analysis by Classification: A Comparative Study of Annotated and Algorithmically Extracted Patterns in Symbolic Music Data.” In Proceedings of the International Conference on Music Information Retrieval (ISMIR), 539–546. Paris, France.
- Schoenberg, A. 1967. Fundamentals of Musical Composition. London: Faber and Faber.
- Sears, D. R. W., and Gerhard Widmer. 2020. “Beneath (Or Beyond) the Surface: Discovering Voice-Leading Patterns with Skip-Grams.” Journal of Mathematics and Music 1–26. https://www.tandfonline.com/doi/full/10.1080/17459737.2020.1785568
- Taube, H. 1995. “An Object-Oriented Representation for Musical Pattern Definition.” Journal of New Music Research 24 (2): 121–129. https://doi.org/10.1080/09298219508570678.
- Van Kranenburg, P., A. Volk, and F. Wiering. 2013. “A Comparison Between Global and Local Features for Computational Classification of Folk Song Melodies.” Journal of New Music Research 42 (1): 1–18.
- Volk, A., and P. Van Kranenburg. 2012. “Melodic Similarity Among Folk Songs: An Annotation Study on Similarity-Based Categorization in Music.” Musicae Scientiae 16 (3): 317–339.
- Wells, S., A. Volk, J. Masthoff, and I. Y. Ren. 2019. “Creating a Tool for Facilitating and Researching Human Annotation of Musical Patterns.” Master's thesis, Universiteit Utrecht.