
 ?Mathematical formulae have been encoded as MathML and are displayed in this HTML version using MathJax in order to improve their display. Uncheck the box to turn MathJax off. This feature requires Javascript. Click on a formula to zoom.
Abstract
In this study, we determine the fundamental role of the line of fifths for the organization of tonal material by applying dimensionality reduction to a large historical corpus of pitch-class counts (ca. 1360–1940). We observe a historically growing trend in the exploitation of the fifths range, i.e. the size of segments that pitch-class distributions cover on the line of fifths. Moreover, we introduce the novel concept of pitch-class (co-)evolution, which traces the changing co-occurrence of pitch classes over time and likewise reaffirms the centrality of this linear tonal space from a historical angle, allowing us also to distinguish between historical periods in terms of the usage of pitch classes.
1. Introduction
There are various models of pitch space, comprising music-theoretical (CitationVogler 1802; CitationWeber 1851; CitationHauptmann 1853; Citationvon Oettingen 1866; CitationHostinský 1879; CitationLerdahl 2001) as well as algebraic and geometrical approaches (CitationMazzola 1985; CitationLewin 1987; CitationChew 2000; CitationTymoczko 2011; CitationHarasim, Schmidt, and Rohrmeier 2016). Virtually all assume octave equivalence and most grant the perfect fifth a fundamental role. In particular, this interval has been extensively studied in the context of well-formed scales (CitationClough and Myerson 1985, Citation1986; CitationCarey and Clampitt 1989; CitationClough, Engebretsen, and Kochavi 1999; CitationNoll 2010; CitationHarasim, Schmidt, and Rohrmeier 2020). The simplest pitch-space models are thus the circle and the line of fifths, the former taking enharmonic equivalence into account (CitationTemperley 2000). While the circle of fifths and several more complex models of pitch or interval spaces have been studied using quantitative and computational methods (CitationBigo and Andreatta 2016; CitationHuang et al. 2017; CitationHerremans and Chew 2019; CitationYust 2019; CitationLieck, Moss, and Rohrmeier 2020; CitationNavarro-Cáceres et al. 2020; CitationHarasim et al. 2021), the fundamental line-of-fifths space has not yet been sufficiently examined in its own right with data-driven corpus methods.
The goal of this study is to address this gap and examine the descriptive and explanatory power of the line of fifths regarding pitch organization in the light of empirical data. More concretely, our main question is: Can the central role of the perfect fifth for tonal organization be inferred directly from a corpus of musical pieces? Since the tonal organization and the relations between notes it implies are subject to historical changes (CitationDamschroder 2008; CitationBrower 2008), we consider the implications of historically contingent data, an issue that is rarely addressed in previous approaches.
Our interpretation of the organization of tones in any conception of tonal space does not entail in any way that these relations are physically or logically necessary – as CitationFétis (1844) assumed, for example – but rather that they reflect underlying, possibly unconscious cognitive models of composers, performers, or listeners (CitationBenjamin 1982; CitationMorgan 2003; CitationLarson 2012). To illustrate this point, consider a composition that contains an enharmonic reinterpretation of an augmented-sixth chord as a dominant-seventh chord, e.g. (A♭, C, E♭, F♯) ⇒ (A♭, C, E♭, G♭). The mere occurrence of this reinterpretation attests to the fact that the composer's mental model of tonality generally allows for the option of enharmonic equivalence, whereas it does not necessarily imply that the same composition never distinguishes between F♯ and G♭. As another example, the appearance of a chromatic passing tone in an otherwise diatonic composition reveals that – at least in principle – chromaticism is a device that the composer may, but does not need to, employ. It is thus reasonable not to assume that a single one of these mental models is the only, authoritative conception of tonal relations. In other words, composers, performers, or listeners may have several concurrent conceptions of how to combine notes to write music, or to express and appreciate it. A piece of music can invoke any number of these mental models, one of which is the topic of this study: the line of fifths.
In the following, we set up the theoretical and methodological framework for this study by first presenting the corpus used for our investigation, and describing the sources from which it is drawn. We then present a brief discussion of the concept of pitch classes and introduce the notion of musical pieces as pitch-class distributions. Addressing our main research question defined at the outset, we demonstrate that the line of fifths, our central object of interest, can be shown to be a fundamental organization principle for musical pieces using dimensionality reduction methods as commonly employed in machine learning. We subsequently exploit some implications of this finding and trace the growing extent to which composers explore the line of fifths on a historical scale. Based on this observation, we introduce the concept of pitch-class co-evolution and demonstrate that the systematic co-occurrence of pitch classes reveal substantial historical changes that allow us to draw important distinctions in the usage of pitch classes in different historical periods.
2. The corpus
To address our research questions, we analyze the Tonal Pitch-Class Counts Corpus (TP3C; CitationMoss, Neuwirth, and Rohrmeier 2020),Footnote1 a large resource that consists of note counts in musical pieces. It contains 2,012 pieces (2,707,112 notes) by 75 composers, and was assembled from various resources. Many files have been taken from previously published research data sets such as Renaissance scores from the Electronic Locator of Vertical Interval Successions (ELVIS) project,Footnote2 and the Humdrum **kern scores of the Center for Computer Assisted Research in the Humanities (CCARH).Footnote3 Other scores have been added from public repositories such as the Choral Public Domain Library (CPDL),Footnote4 or the community web page of the music notation software MuseScore,Footnote5 while others have been transcribed at the Digital and Cognitive Musicology Lab (DCML).Footnote6 A full list of the pieces and sources used is given in CitationMoss (2019).
In order to be useful for a historical study, each piece in the corpus must have a designated date, but assigning a date to a composition can be difficult. Sometimes there lie many years between the finalization of a composition and its publication which makes it difficult to decide which year to choose to represent the piece; sometimes one of them (or even both) are uncertain or unknown. We opted for the following procedure: For each piece in the corpus, the dates of composition or publication were collected along with the scores as given in the respective sources. In doubtful cases they were manually cross-checked with the metadata given by the International Music Score Library Project (IMSLP).Footnote7 If the year of composition of a piece was given, this year determined the date of the piece; otherwise, the publication date was used. In the rare cases where both were unknown, the median of the composer's life was taken as an estimate of the year. This procedure provides a date value for each piece in the corpus. However, this leads to only 173 unique years for the whole range of 582 years from 1361 to 1942.
Figure shows the distribution of the pieces over time, and Table 1 shows the five most frequent composers per century with the number of pieces they contribute in parentheses. It can be seen that there are gaps in the historical timeline for which the corpus contains no pieces, and that some epochs are represented more strongly than others, in particular the Renaissance (ca. 1450–1550), the Baroque (ca. 1680–1730), and the Romantic periods (ca. 1800–1900). The largest gaps in the data are 1377–1436 (59 years) between pieces composed by Machaut and Binchois, 1517–1555 (38 years) between pieces by Isaac and Palestrina, 1648–1681 (33 years) between pieces by Schütz and Corelli, and 1740–1774 (34 years) between pieces by Bach and Mozart.
Figure 1. Chronological distribution of pieces in the TP3C corpus.
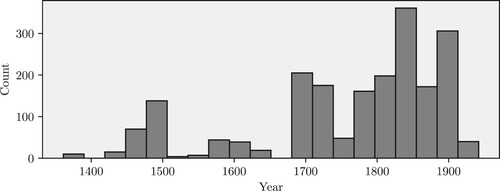
Table 1. Five most frequent composers and numbers of pieces per century in the corpus.
As it is common in observational studies (CitationRosenbaum 2010), caution is thus warranted when one attempts to generalize any findings derived on the basis of this data set to the entire population of polyphonic Western compositions too readily. The corpus is best suited for “macroscopic” observations of general trends. While a complete coverage of the historical scope relevant to this study is currently out of sight, mostly due to the lack of available digital resources, the agglomeration of pieces from different sources renders this data set one of the largest corpora used for empirical studies on music history.
3. Notes as pitch classes
A note can be conceptualized as an event in a musical piece that has a certain pitch, a duration, and specific location in that piece.Footnote8 It is moreover common to consider notes to be equivalent if their respective pitches are related by one or multiple octaves, and thus to speak of pitch classes. However, pitch classes come in two varieties. The first, most commonly used representation in mathematical music theory, computational musicology, and music information retrieval distinguishes twelve different pitch classes, assuming the enharmonic equivalence of certain notes, e.g. F♯ and G♭, C♭ and B, etc. In empirical studies, the assumption of enharmonic equivalence is often a consequence of music encoding formats such as MIDI, in which enharmonically equivalent notes are indistinguishable. The two assumptions of octave and enharmonic equivalence allow for a representation of pitch classes as residuals in and to represent them on a circle. This arrangement is shown in Figure and called the circle of fifths. The numbers represent pitch classes in the order of fifths that can be transformed to chromatic ordering, the chromatic circle, by the mapping
.
The second variant of pitch classes does not assume enharmonic equivalence but only that octave-related notes are equivalent, and is hence more general. This representation allows one to arrange pitch classes linearly (CitationWeber 1851; CitationRiemann 1900; CitationTemperley 2000) on the line of fifths, which is shown in Figure . One can associate each tonal pitch-class with an integer such that this integer represents the number of flats (negative integers) or sharps (positive integers) of the signature of the key in which a given tonal pitch-class is the centre in fifths ordering. For example, D is mapped to 0 because it lies in the middle of the scale of C major/A minor in fifth ordering (no key signature); A♭ is mapped to
because it is the centre of G♭ major/E♭ minor (6 flats); and its enharmonically equivalent tonal pitch class G♯ is mapped to 6 because it lies at the centre of F♯ major/D♯ minor (6 sharps). Yet another benefit of this representation is that we can associate each tonal pitch-class with a colour. We chose a colour mapping in which positive integers (“sharper” or “harder” tonal pitch-classes) are associated with increasingly darker shades of red, negative integers are associated with increasingly darker shades of blue (“flatter” or “softer” tonal pitch-classes), and D is associated with white as the centre of the line of fifths. Following CitationTemperley (2000), we call the first, circular representation neutral pitch-classes and the second, linear one tonal pitch-classes.Footnote9
The line of fifths does not only contain all tonal pitch-classes but also a number of common musical scale types as contiguous sub-segments. For example, pentatonic scales are segments of length 4 (containing five pitch classes), e.g. from G♭ to B♭; diatonic scales are defined by segments of length 6, e.g. from F to B; the early extensions of the natural diatonic scale by B♭ and F♯ correspond to a span of eight fifths; and the two whole-tone scales correspond to the odd and even numbers, respectively, since a whole tone consists of two consecutive perfect fifths (see Figure ). Theoretically, the line of fifths extends to infinity in both directions but in actual compositions only a small segment of it is used. In the present study, we consider only the segment from F to B
(35 tonal pitch-classes) because no piece in the corpus contains tonal pitch-classes outside this range. We can say that the tonal pitch-class vocabulary of the corpus has size 35, consisting of the seven natural pitch-classes F, C, G, D, A, E, B, with zero, one, or two sharps or flats, respectively.
Figure 2. Schematic depiction of the twelve neutral pitch-classes in on the circle of fifths. One representative of each neutral pitch-class is shown as a tonal pitch-class label next to the node. The colouring of the nodes corresponds to the colours of the keys on the piano.
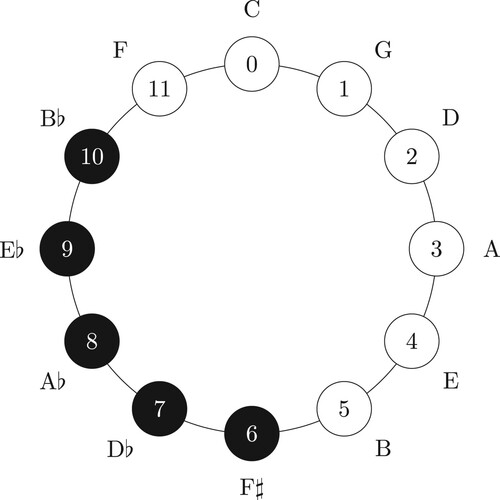
Figure 3. Schematic depiction of the tonal pitch-classes on the line of fifths mapped to integers in .
The distinction between the two types of pitch classes is not only relevant for the encoding and representation of music but also implies certain conceptualizations of the relations of tones to one another. More specifically, neutral pitch-classes assume enharmonic equivalence which is the basis for a range of musical styles, for instance the compositions based on twelve-tone rows by the composers of the second Viennese school (CitationSchoenberg 1975; CitationStraus 2005). It is also widely employed in jazz, and the basis for harmonic phenomena such as the tritone substitution (CitationBiamonte 2008; CitationRohrmeier 2020; CitationLevine 1989, Citation1995). Enharmonic equivalence lies at the heart of compositions by post-tonal composers who use scales that are based on symmetric divisions of the octave, e.g. Stravinsky (CitationTymoczko 2002; CitationVan Den Toorn 2003), Debussy (CitationForte 1991), Bartók (CitationLendvai 1971), and Messiaen (CitationMessiaen 1944). On the other hand, the representation of tonal pitch-classes with its distinction between enharmonically equivalent notes is more closely related to a diatonic conception of tonal space and may potentially entail tuning systems other than equal temperament (CitationSethares 2005). Moreover, the two pitch-class representations also relate to music notation and its orthography. The Western notation system has mainly evolved to accommodate diatonic music (including modulations) where the tonal material is confined to relatively small regions on the line of fifths. Music that is highly chromatic or constructed from symmetrical scales can not always be notated correctly: a composer has to chose a diatonic spelling, e.g. choose between F♯ and G♭, even if the composition is meant to be atonal. It is telling that musical orthography and its relation to tonality is largely discussed in the context of 19th-century composers, e.g. Mendelssohn, Schumann, Chopin, or Liszt (CitationAtlas 1990), Mussorgsky (CitationPerry 1995, Citation1998), Schubert (CitationCohn 1999; CitationNoll 2009), or composers at the turn to the 20th century, such as Scriabin (CitationPerle 1984; CitationWai-Ling 1993) and Bartók (CitationGillies 1983).
4. Pieces as tonal pitch-class distributions
In natural language processing (NLP; CitationManning and Schütze 2003), the so-called bag-of-words model is a widely used representation for texts. It describes a document by simply counting all the words that it contains. We adopt this model and represent pieces as bags of notes.Footnote10 Accordingly, we count for each piece how many of the V = 35 tonal pitch-classes it contains. In order to compare pieces of substantially different length, we normalize them and consider only the proportions of pitch classes in a piece. That is, in our corpus with D = 2, 012 pieces in total, each piece is represented by the relative frequencies of its tonal pitch-classes, a vector in 35-dimensional space that contains positive real numbers and sums up to 1. In this high-dimensional space, pieces with very different tonal pitch-class distributions are very distant, whereas pieces that have similar tonal pitch-class distributions are relatively close to one another and potentially form clusters.
The fact that all tonal pitch-classes can be arranged on the line of fifths (Section 3) will inform our understanding of the pitch-class distributions in the corpus. Figure shows the distributions of all tonal pitch classes in the corpus.Footnote11 As can be seen, pitch classes have been sorted and coloured according to the line-of-fifths mapping shown in Figure . The average pitch-class frequencies across all pieces are indicated by black dots and a 95% bootstrapped confidence interval (10,000 samples) is shown by white error bands. The distribution of averages (black dots) is approximately unimodal and symmetric but not Gaussian due to its heavy tails. This distribution of averages represents the vector pointing to the “center of mass” in the high-dimensional pitch-class space. On average, and perhaps not surprisingly, the natural tonal pitch-classes (from F to B) are most common, while altered tonal pitch-classes (with sharps or flats) are much less frequent in the corpus. Moreover, they are centered around D, the exact middle of the natural tonal pitch-classes in fifths order, and consequently the entire line of fifths. A similar result has recently been obtained for Mozart's piano sonatas (CitationHentschel, Neuwirth, and Rohrmeier 2021). The distinctiveness of this shape is remarkable, being unimodal and almost symmetric, and is a first indicator of the centrality of the line of fifths. However, this pattern only occurs on the corpus, or population, level; individual pieces often have heavily skewed or even multimodal tonal pitch-class distributions on the line of fifths. Note that this average distribution is based on the “raw” relative frequencies of tonal pitch-classes in the pieces of the corpus; they were not transposed to a common key which would have obfuscated this pattern.Footnote12
Figure 4. Relative frequencies of pitch classes per piece in the corpus (colored dots). The average frequency of pitch classes is shown by black dots, and the white bands around the averages correspond to 95% confidence intervals based on 10,000 bootstrapped samples.
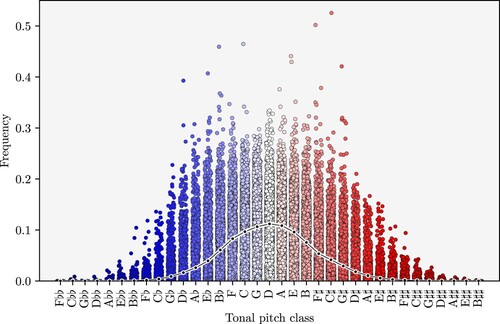
The distribution in Figure shows that the tonal pitch-class distributions of the pieces in the corpus are concentrated around the natural tonal pitch-classes. This means that, on average, most pieces contain only few tonal pitch-classes with accidentals. While this does not tell us, for instance, whether the distributions of pieces in different keys are very similar or not, it does show that not all keys are used in the same way. Rather, compositions are in general located around the centre of the line of fifths, which may simply be related to the fact that this facilitates the notation of the music.
In the next section, we address our main research question, showing that the relevance of the line of fifths for the organization of tonal material in pitch-class space can be inferred directly from the data in our corpus.
5. Recovering the line of fifths from data
A number of recent studies have used the geometrical interpretation of note distributions in pieces as points in a high-dimensional space, based on large corpora of MIDI-encoded data (CitationHuang et al. 2017; CitationWeiß, Mauch, and Dixon 2018; CitationHarasim et al. 2021). As mentioned above, this encoding enforces the assumption of enharmonic equivalence and thus limits the extent to which tonal relationships can be extracted from a corpus, since musical pieces are represented by only twelve neutral pitch-classes. This is not the case here, where the corpus contains the exact spelling of the pitches, and we only make the assumption of octave-related notes being equivalent. Since the space we consider here has 35 dimensions, it is impossible to visualize this space and the pieces contained in it in order to see whether their arrangement provides any meaningful and interpretable information. We address this problem by using a well-established method for dimensionality reduction called Principal Components Analysis (PCA; CitationBishop 2006) that transforms the data into a lower-dimensional space, while at the same time maintaining characteristic properties of the original, high-dimensional space. PCA thus can aid us to achieve a better understanding of the global structure of the relative positions of data points (musical pieces, in our case). In order to perform PCA, the data is represented as a matrix
(1)
(1)
where the rows are given by D data points (the pieces in the corpus), and the columns are given by V features (the number of distinct tonal pitch-classes in the vocabulary). All entries in X range from 0 to 1. PCA determines the
largest directions and magnitudes of the variance in the data in X by first calculating the covariance matrix
(2)
(2)
where
denotes the expected value. The main directions of the variance in the data and their magnitude are given by the eigenvectors
and eigenvalues
of
, which are calculated by solving the equation
(3)
(3)
The projection into the lower-dimensional space is then achieved by selecting the M largest eigenvalues and their corresponding eigenvectors, and transforming the data to
, the dimensionality reduction of X, by
(4)
(4)
where each row of
corresponds to the data points in the reduced space. The sum of all eigenvalues
is the total amount of variance in the data and the variance explained by each principal component is given by
. In the present context, X was transformed to have zero mean before applying PCA, but the variance was not standardized to 1. This is justified by the fact that all features are on the same scale, and because the differences in the variance between the respective tonal pitch-classes is of particular interest here.
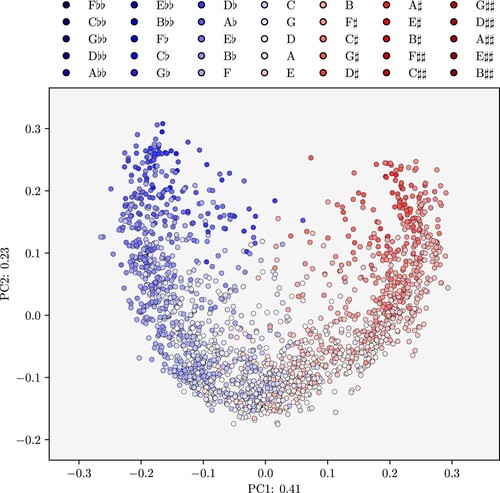
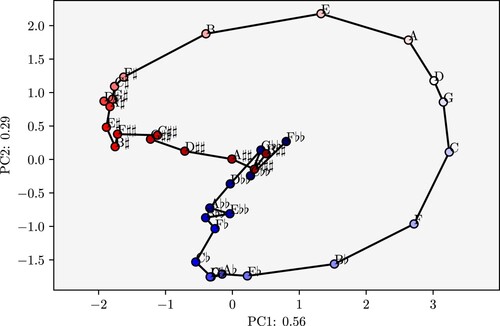
Figure shows the data reduced to the two-dimensional Euclidean plane . Each dot represents a piece and the colour of each piece corresponds to the line-of-fifths position of its tonal centre, which we operationalize as the most frequent tonal pitch-class in that piece.Footnote13 The dimensionality reduction shows that pieces with similar colouring are close together and additionally shows that the colours are largely ordered along the line of fifths. This means that musical pieces that have tonal centres which are close to one another on the line of fifths also have similar tonal pitch-class distributions. This result is to be expected since neighbouring keys along the line of fifths share all tones but one of their respective scales, corroborating the adequacy of our method. However, this result also shows that the expected adjacency of keys generally extends from their scales to distributions of pitch-classes, largely due to the fact the most frequent tones in tonal pieces commonly are the tonic and the dominant, which are, of course, related by a perfect fifth.
Figure 5. Dimensionality reduction via PCA. Points represent pieces and the colouring corresponds to the position of the tonal centre of each piece on the line of fifths.
One of the advantages of PCA is that the dimensions in the reduced space, called the principal components, can be well interpreted since they express how much of data variance in the original space is retained in the reduced space. While PCA is one of the most commonly used methods for dimensionality reduction, there are many others (each of which relies on particular assumptions about the distribution of the data). In a qualitative comparison, Locally Linear Embeddings (LLE; CitationRoweis and Saul 2000) achieved a similar result by also largely arranging the data along the line of fifths. By contrast, t-distributed Stochastic Neighbor Embeddings (t-SNE), which emphasizes the local over the global structure of the data (CitationVan Der Maaten and Hinton 2008), found multiple sub-clusters that were relatively homogeneous with respect to the tonal centres, thus emphasizing more strongly the local similarities between pieces than the global structure of the space. These results are reported in CitationMoss (2019). In the present context, we opted for PCA because it preserves most of the global structure, and the interpretation of the results is straight-forward. The first two components are shown separately in Figure .
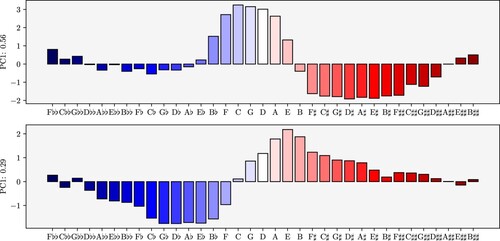
Figure 6. First two principal components for the tonal pitch-class distributions.
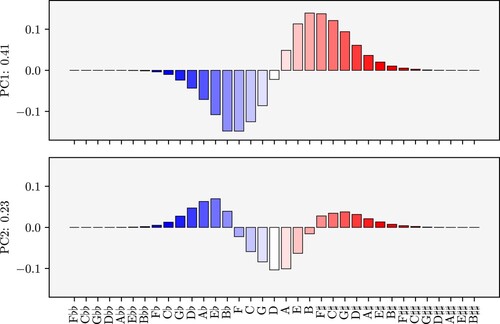
The first principal component (PC1, top panel) distinguishes the two directions, ascending vs. descending (red vs. blue colouring), of the line of fifths departing from D, the most frequent tonal pitch-class in the corpus. This dimension accounts for 41 percent of the total data variance. This is evidently related to the tonality of pieces because keys that are closer to one another on the line of fifths have a larger intersection of tonal pitch-classes. For example, the scale of the F major key shares all but one tonal pitch-class with that of B♭ major, which is its direct neighbour on the line of fifths, but it does not share any tonal pitch-classes with the scale of F♯ major, which is seven fifths apart from F major. Of course, pieces rarely use only the tonal pitch-classes of their main key. They can employ many out-of-key notes, e.g. in modulations to more distant keys, in chromatic passages, or when using altered chords. The first principle component is thus not directly related to the concept of keys (as expressed, for instance by their diatonic scale content or their tone profiles) but rather to a more general conception of the global tonal organization of a piece and the position of its tonal centre on the line of fifths. However, it is also important to note that the distance to D cannot be the only factor underlying the distribution in this component. If that were the case, we would observe monotonically increasing bars towards the extremes of the line of fifths. The fact that the bars first grow and than progressively shrink (in both directions) means that distance on the line of fifths is a very important factor for the distribution of pitch classes around the centre of the line of fifths, but that this factor is not as strong (but still observable) for more extreme pitch classes.
The second principal component (PC2, bottom panel) represents the distance to the centre of the line of fifths – regardless of the direction – and distinguishes pieces with natural tonal centres (from F to B; white or very light colours) from more altered tonal pitch-classes (darker shades of blue and red). This distinction accounts for 23 percent of the variance in the data. The first two principal components represent the direction (shown by the colour hue) and the distance (shown by the colour intensity) on the line of fifths. They together account for a total of 64 percent of the variance in the data but greatly simplify the space from 35 dimensions to just two. The dimensionality reduction of tonal pitch-class distributions thus captures two important aspects of accounting for tonal organization in terms of the line of fifths, namely direction and proximity.
6. Historical expansion along the line of fifths
Based on the centrality of the line of fifths for the organization of tonal material in the corpus as a whole, we now turn to the question whether historical changes in pitch-class distributions can be observed as well. The tonal pitch-class distribution in each piece does not only occupy a position on the line of fifths through its tonal centre, it also defines a range, the smallest line-of-fifths segment that contains all of its tonal pitch-classes. The length of this segment, in turn, determines which intervals can potentially be used in this piece, thus also imposing certain restrictions on the harmonic makeup. For example, a piece containing only the pitch classes D and A can only contain the intervals of the unison and the fifth as well as their complements, the octave and the fourth (and octave multiples thereof). A piece that contains only natural tonal pitch-classes can, by definition, not contain any chromatic notes so its interval content only allows for the diatonic but not the chromatic semitone.
We call the length of a line-of-fifths segment containing all tonal pitch-classes in a piece the fifths range of that piece (CitationGárdonyi and Nordhoff 2002; CitationWeiß, Mauch, and Dixon 2018). Note that this measure is invariant under transposition, i.e. transposing the piece to a different key will not change its interval content and hence not its fifths range. As explained above, the fifths range of strictly diatonic pieces is at most 6, while pieces with larger fifths ranges contain chromatic notes; pieces with a fifths range larger than 12 potentially contain enharmonically equivalent notes. It is thus reasonable to expect that the fifths range of pieces increases over time since, for example, Renaissance pieces rarely contain chromaticism,Footnote14 while that feature becomes much more frequent in Classical and in particular in Romantic compositions. The simple measure of the fifths range enables us to compare all pieces in the corpus and to trace the historical changes regarding the spread of musical pieces on the line of fifths, and their potential interval content.
The fifths range of all pieces in the corpus is shown in Figure . The two horizontal lines (gray, dashed) separate the diatonic (bottom) from the chromatic (middle) and enharmonic (top) segments. In order to arrive at a better view of the macroscopic historical trend in this distribution of pieces, we employ a method called Locally Weighted Scatterplot Smoothing (LOWESS; CitationCleveland and Devlin 1988). This procedure returns a trend line that takes local variations into account. LOWESS fits a local polynomial regression not to the entire data set but to a neighbourhood of each data point that is determined by a fraction parameter δ defining what percentage of the whole data is taken into account when calculating the regressions. The larger this fraction is the smoother the resulting LOWESS curve will be. Here, this parameter was set to , taking a rather large proportion of the data into account to reflect the overall macroscopic perspective of our study. Note that the range of years covered by the neighbourhood can vary, depending on how the data is distributed over time. In periods with fewer pieces, a larger time range will be taken into account and vice versa. This is why the lines are much smoother before ca. 1700 and show much more variability in later decades and centuries. The weights for this regression are chosen so that they give less weight to data points further away from
. A commonly used weighting function is the so-called tricube function,
(5)
(5)
Moreover, in order to obtain an estimate of the variance in the data, we apply so-called bootstrap resampling (CitationEfron and Tibshirani 1993), where one repeatedly samples with replacement new data sets from the original distribution of pieces. The bundle of red lines in Figure shows 500 bootstrapped LOWESS regression lines.Footnote15
Figure 7. Diachronic changes in the fifth-range of tonal pitch-class distributions of musical pieces, shown as LOWESS trend lines. Selected pieces with minimal (Desprez, Satie) and maximal (Chopin) fifths range are marked with a cross. A slight jitter has been added to the scatter plot to avoid overlapping points (not affecting the LOWESS curves).
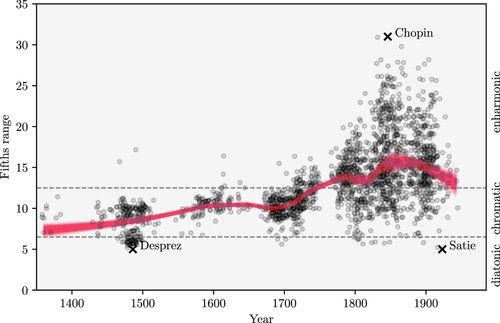
One can see that, over the course of the historical time span under consideration, there is a substantial increase in the fifth range of musical pieces. While there are very few entirely diatonic pieces (pieces that do not contain a chromatic semitone or enharmonically equivalent notes), the fifths range grows continuously, supporting a historiography of tonality that proceeds from diatonicism through chromaticism to enharmonicism (CitationFétis 1844; CitationGárdonyi and Nordhoff 2002) – at least from the distant view of the pieces in our corpus. It bears mentioning that these results strongly depend on both the corpus as well as on the specific parameters used for calculating the trendlines. While, generally, corpora are aimed at approximating to some degree the sources available for some historical period (CitationPiotrowski 2019), concrete parameter settings may be regarded as representing a certain perspective or granularity with which one looks at the data. It could, for instance, be objected that the highly chromatic music of late madrigalists such as Gesualdo apparently does not substantially influence the historical trendline in Figure . While Gesualdo is, in fact, the second most prominent composer in the corpus for the 17th century (27 pieces; Table 1), Corelli outweighs him by a factor of about 7 (186 pieces). We believe that this is appropriate. While Gesualdo's chromatic style is certainly remarkable, it does – because of its uniqueness – not represent the general style of this period, which, in turn, is better represented by Corelli's works.
The variance in the bootstrapped trend lines is relatively large before 1400, a consequence of the sparsity of data in that period. The variance is largest, however, in the 19th century where the data is least sparse. Hence, it is plausible to assume that the variance can be mainly attributed to the actual variability in the compositions. While the corpus does contain composers such as Chopin, Alkan, and Liszt who are known for their highly chromatic style and usage of enharmonicism, leading to a generally higher fifths range of their compositions, the corpus also contains composers such as Josephine Lang, Robert Franz, and Peter Cornelius, whose works often exhibit a more conservative style. However, the peak and subsequent decline of the trend line around the 1880's should not be over-interpreted since this might be a consequence of the relatively few pieces from the early 20th century. The variance observed in the bootstrapped trend lines points to the fact that, while there is a generally growing trend towards chromaticism and enharmonicism, the diversity in the usage of musical styles – as manifested in the fifths range of compositions – increases too.
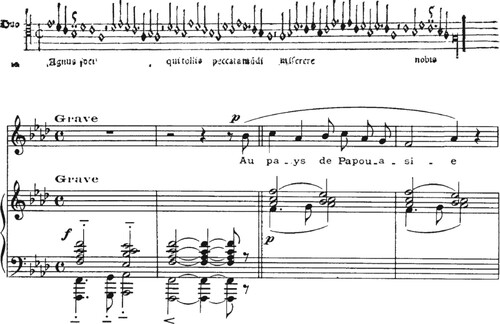
This is illustrated by three compositions that stand out in particular with respect to their fifths range and have been marked by a cross in Figure . The two compositions in the corpus with the smallest fifths range draw their pitch classes from a hexachord (with a fifths range of 5): Josquin Deprez's Agnus Dei II from the Missa sine nomine (1514), a duo in the form of a canon (“Canon in diapason”) and Erik Satie's “Air du poète,” no. 4 of his song cycle Ludions (1923). Despite being separated by more than 400 years, both compositions are characterized by their limited intervallic possibilities, in particular the absence of the leading tone (Figure ). On the other end of the spectrum, Frédéric Chopin's Polonaise-Fantaisie, op. 61 (1846), is the piece with the largest fifths range in the corpus, extending from D to B
(31 fifths, but lacking A
, D
, A
, and E
). Chopin's Polonaise thus exemplifies the drastic increase of the tonal vocabulary during the 19th century (CitationSamson 1989), whereas Satie's employment of the rather modest hexachordal tone material attests to the simultaneously growing diversity in fifths ranges of compositions.
Figure 8. Two distinct ways of composing out a hexachord. Top: Josquin Desprez, Missa sine nomine, Agnus Dei II (1514); bottom: Erik Satie, Ludions, no. 4 “Air du poète” (1923).16
7. Tonal pitch-class evolution
In the discussion above, the line of fifths emerges as the central organizing space for tonal pitch-class distributions through the application of PCA. We obtain this result without taking the temporal distribution of pieces into account. We could moreover observe a historical trend, reflecting that compositions tend to occupy ever larger segments on the line of fifths, while at the same time the diversity in fifths range increases as well (Section 6). We now turn our attention away from the rather simple measure of fifths range to the study of historical developments in the usage of tonal pitch-classes. Recall that we model a piece as a distribution over the V = 35 tonal pitch-classes. Moreover, each piece is associated with a year of composition or publication. Recall also that the data set is not uniformly distributed over time (Figure ). On the one hand, there are some large gaps between periods, whereas on the other hand some years contain many pieces at the same time. In order to trace the historical usage of tonal pitch-classes, i.e. the tonal pitch-class evolution, we calculate the average tonal pitch-class distribution for a given year, analogously to the overall average tonal pitch-class distribution in the corpus (Figure ). The corresponding tonal pitch-class evolution plot is shown in Figure . It shows, on the left-hand side as stacked bands coloured according to Figure , the relative frequencies of tonal pitch-classes for the years where the corpus contains pieces. Periods with missing data are clearly visible by the straight lines (e.g. around 1400). The heatmap on the right-hand side of Figure will be discussed in Section 8.
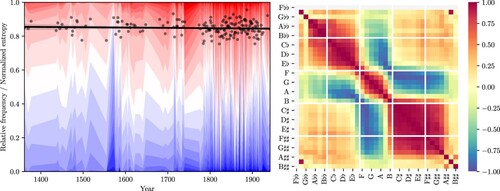
Figure 9. The evolution of tonal pitch-classes for those years where the corpus contains pieces. The coloured bands show the relative frequencies of tonal pitch-classes in the corpus for any given year. The black dots show the normalized entropy over the pitch-class distributions in each year, and the black line shows a linear regression. The heatmap shows correlations between relative pitch-class frequencies.
What is the interpretation of a per-year tonal pitch-class distribution? If a corpus of musical pieces is seen to represent an approximation of the entire musical material produced within the chosen historical range, then the per-year distributions can be interpreted as temporal slices of the entire range. In a way, they approximate the music that was present in a given historical year and show the average relative frequency of each tonal pitch-class for each year and piece in the corpus.
Black points on the left-hand side of Figure show the normalized entropy (CitationCover and Thomas 2006) of the pitch-class distributions for the years given in the corpus, along with a regression line with 95% confidence intervals. Normalized entropy is an adequate measure for the randomness in these distributions for a given year since it is calculated with respect to the number n of non-zero tonal pitch-classes in that year. It is normalized by its maximal value which is given by . If the tonal pitch-class distribution for some year were uniform, the normalized entropy would be maximal at 1. Note that unnormalized entropy would increase historically since more and more pitch-classes are available (Section 6) and thus uncertainty would increase. The almost constant regression line expresses the fact that, although the number of used tonal pitch-classes increases over time, their distribution at a given historical moment has a similar normalized entropy, i.e. the randomness in these distributions remains largely similar. Until into the 16th century, pieces in the corpus consist almost exlusively of natural tonal pitch-classes plus B♭, F♯, and C♯. The historically increasing fifths range (Figure ) is reflected in a larger number of pitch classes towards the end of our time line. Their number increases in particular after 1700 where composers begin to use more flat as well as more sharp tonal pitch-classes. For some tonal pitch-classes, it seems to be the case that their evolution curves are almost parallel, at least within some periods for which data is available.
Recall that the bag-of-notes representation of the corpus implies that tonal pitch-classes are regarded as independent from one another. The strong similarities between some of the evolution curves as well as music-theoretical intuition suggest, however, that this is not a sensible assumption because their mutual distances in tonal space introduce dependencies regarding their likelihood of occurrence. For the entire corpus from a synchronic perspective this has already been shown in Section 5. The preceding result strongly indicates that proximity on the line of fifths is also an important factor for the relative rate of change of pitch-class co-occurrence from a diachronic angle.
8. Tonal pitch-class co-evolution
How are the evolution curves for the individual tonal pitch-classes related to each other? In other words, what can be inferred from the co-evolution of tonal pitch-classes? Answering this question may provide further insight into the organization and mutual dependency of pitches. Since every tonal pitch-class is associated with a vector that contains the probability of this pitch class for each year, we define the co-evolution of two tonal pitch-classes as the pairwise correlation ρ of their evolution vectors.Footnote16 The correlations between all tonal pitch-classes are shown on the right-hand side of Figure .
This correlation matrix exhibits a number of interesting regularities. First, its block structure almost perfectly coincides with segments on the line of fifths that are determined by the number of accidentals. These segments are here emphasized by the white lines. The three blocks along the main diagonal of the matrix with relatively strong correlation values correspond to the co-evolution of tonal pitch-classes with flat, sharp, and no accidentals, respectively (top left to bottom right). The two blocks in the lower left and upper right corners of the matrix with moderate but positive tonal pitch-class co-evolution values correspond to the correlations of flat with sharp and, per symmetry, sharp with flat tonal pitch-classes. Note that the diagonals in this matrix describe interval classes between tonal pitch-classes. The main diagonal describes the unison, the diagonal above the perfect fifth, the one above that the major second, etc. Since the strongest correlations are found on intervals close to the diagonal, we can conclude that tonal pitch-classes that are close on the line of fifths, in particular those that come from the same diatonic set, also correlate highly in their historical evolution, or in other words, they co-occur more frequently if there is proximity on the line of fifths.
The blocks with negative correlations are equally interesting. The weakest correlations overall can be seen in the parallel diagonals depicting the interval classes of the chromatic semitone and the tritone, e.g. between A and A♭/E♭, between E and E♭/B♭, etc., albeit not through the entire space but rather only for the central segment of the line of fifths. One can infer that the role of these intervals, the chromatic semitone and the tritone, is very distinct in white-key music based on the natural tonal pitch-classes but that they are less pronounced in keys that are further apart from C on the line of fifths. It seems to be the case that pieces in keys with more accidentals as key signatures are also more chromatic in general. This calls into question the wide-spread assumption of transpositional equivalence of keys (for related arguments, see CitationRom 2011; CitationQuinn and White 2017). However, this can not be concluded decidedly since the distribution of keys in the corpus is not part of the data set and hence not taken into consideration here.
Recall that finding the directions of the largest variance in a data set via PCA involves the calculation of a covariance matrix. Accordingly we can apply PCA to the correlation matrix shown in Figure (right-hand side) in order to find the principal components that account for most of the variation in the tonal pitch-class co-evolution and to quantify some of the earlier qualitative observations.Footnote17 Figure shows the reduction of the co-evolution matrix to two dimensions via PCA. Tonal pitch-classes that have high correlations appear close together (e.g. C and G), while those having low correlations are more distant (e.g. C and F♯). The black line connecting the tonal pitch-classes was added post hoc to emphasize that the co-evolution of tonal pitch-classes also reveals the line of fifths, at least for tonal pitch-classes close to its centre.
Figure 10. Two-dimensional PCA reduction of tonal pitch-class co-evolution. The black line connecting pitch classes along the line of fifths has been added post hoc.
These first two principal components of the tonal pitch-class co-evolution are shown separately in Figure . As before, they correspond to projections to one of the axes in Figure , and the variance explained by each of the components can be interpreted as the importance of these dimensions for the data. The first principal component (PC1) accounts for 56 percent of the variance in the tonal pitch-class co-evolution and confirms the observation that tonal pitch-class co-evolution is largely determined by regions of the line of fifths where the tonal pitch-classes have the same number of accidentals. The wave-like pattern in the first principal component switches from positive to negative values and back almost exactly at the boundaries between tonal pitch-classes with two flats (), one flat (♭), no accidentals, one sharp (♯), and two sharps (
), although this is not as clear between the single and double sharps. The second principal component (PC2) accounts for 29 percent of the variance in the data and corresponds to the direction of the line of fifths (flat- or sharp-ward), viewed from C. Apparently, while D emerged as the central tonal pitch-class under a synchronic perspective (Sections 4 and 5), it is C that lies at the centre from a diachronic vantage point. While more extreme flat pitch-classes, such as C
and sharp pitch-classes such as B
are positively correlated, the low and negative correlations between more central tonal pitch-classes such as B and B♭ pulls them apart in the reduced space. A positive correlation between extreme tonal pitch-classes from opposite sides of the line of fifths spectrum may be surprising at first. The following section will shed light on the historical contingency of this finding.
Figure 11. Separate plots of the first two principal components jointly accounting for 85% of the variance in the data.
Together, the first two principal components account for 85 percent of the variance in pitch-class co-evolution, whereas this amounted to only 64 percent in the case of pitch-class occurrence (Figure ). The line of fifths appears to have a stronger bearing on the co-evolution of tonal pitch-classes than on co-occurrence. We can also observe that the interpretations of the first two principal components for co-occurrence and co-evolution is reversed to some extent: for the former, direction on the line of fifths was the strongest factor and number of accidentals only secondary; for the latter, the opposite is the case. To summarize, the principal components of the dimensionality reduction for the tonal pitch-class co-evolution matrix is astonishingly similar to the principal components of the reduction of the distributions of tonal pitch-classes. In both cases, the distance on the line of fifths, as well as the distinction between flat, natural, and sharp tonal pitch-classes accounts for the largest proportions in the variance of the data.
9. Tonal pitch-class co-evolution per historical period
As the previous sections have shown, the fundamental structure underlying tonal pitch-class co-occurrence as well as the co-evolution of tonal pitch-classes is the line of fifths. We have seen that the fifth range of tonal pitch-class distributions largely increases over the historical time span under consideration here. In order to conclude this study, we finally turn to the question of whether the concept of tonal pitch-class co-evolution introduced above is useful in order to reveal differences in usage between different historical periods. To that end, we divide the corpus into centuries and calculate the tonal pitch-class co-evolution values separately for each period. Since the whole corpus covers a range of approximately 600 years, this results in seven periods with a duration of 100 years each, except for the first and last periods, which are somewhat shorter since the years of the earliest and the latest piece in the corpus do not coincide with the boundaries of the centuries.
An obstacle in directly applying this methodology to shorter periods is that the distribution of pieces is far from uniform (Figure ). For this reason, we apply random sampling in order to achieve better balance for the respective periods. For each of the centuries from the 15th to the 20th,Footnote18 we initialize a Dirichlet distribution with concentration parameter , V = 35, and add to it the pitch-class distributions of the pieces of the respective period. We add the distributions and not the counts in order not to favour longer pieces. For periods for which more pieces are available, this results in an overall lower variance of the Dirichlet distribution. Conversely, the uncertainty about pitch-class distributions in periods with fewer pieces in the corpus is captured by a higher variance of the Dirichlet distribution. We then sample 1000 pieces for each period from the Dirichlet distribution with the updated concentration parameter. This entails, that a priori all pitch classes are possible in each period, due to the flat prior, but that those pitch classes that actually occur will be more likely. For each of these sampled pieces we uniformly sample a year within the range defined by the historical period. Since years are sampled at random, having very large sample sizes leads to stationary pitch-class distributions within a period and we therefore chose to only sample 1000 pieces each. In order to reinforce those years for which we do have data, we add the pieces from the corpus to the collection of samples. This finally allows us to calculate the average pitch-class distribution for each year in a given century. Figures and show the results for the six centuries. The left-hand sides show the tonal pitch-class distributions of sampled and actual pieces, as described above, and the right-hand side shows the co-evolution heatmaps.
Figure 12. The co-evolution of tonal pitch-classes for the 15th, 16th, and 17th centuries.
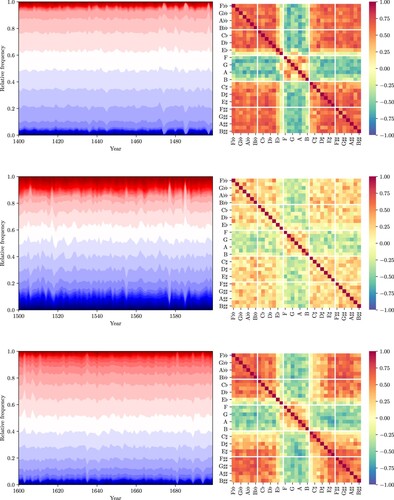
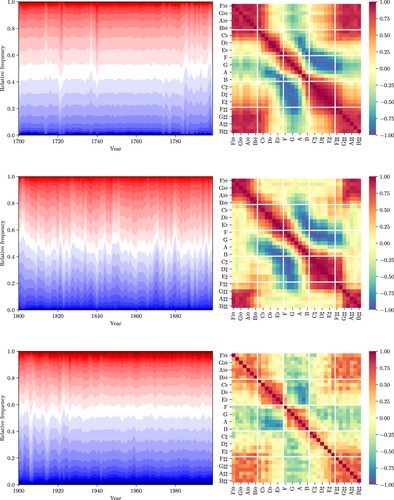
Figure 13. The co-evolution of tonal pitch-classes for the 18th, 19th, and 20th centuries.
As explained above, we start with a flat prior over all tonal pitch-classes for each century, to the effect that all tonal pitch-classes are possible but only those that the corpus contains are likely. The years in which the evolution curves substantially deviate from stationary distributions are precisely those for which pieces are in the corpus. The 15th, 16th, and 17th centuries contain 218, 60, and 214 pieces, respectively, but those pieces are composed or published in only 12, 11, and 13 distinct years within these periods because most pieces in the corpus from these periods are published in collections and their individual dates of composition are not known. Nonetheless, we can observe that the co-evolution heatmaps of all three centuries are largely similar to one another and show more or less clear block structure that divides the natural from the flat and sharp tonal pitch-classes.
The situation is quite different for later periods. Not only is the number of pieces in these periods larger than in most of the earlier ones, but the number of unique years of composition or publication increases as well. For the 18th century, the corpus contains 412 pieces in 25 unique years, and for the 19th and 20th centuries we have 865 and 172 pieces in 85 and 21 years, respectively. The largest difference between the respective heatmaps occurs between the 17th (Figure ) and 18th (Figure ) centuries. For the earlier centuries, the flat, the natural, and the sharp tonal pitch-classes correlate strongly and positively with themselves but strongly and negatively with one another. Already in the 18th century, but most strongly in the 19th century, one can observe that the previous block structure of the co-evolution matrices gives way to a stronger emphasis of the main diagonal. The tonal pitch-class co-evolution thus provides data-based evidence for a stark shift in compositional practice between the 17th and the 19th centuries, and one may interpret this as reflecting a gradual transition from common-practice to extended tonality. With some warranted caution, this observation may reflect the historical fact that different keys were often conceived to have unique characteristics (CitationMattheson 1739; CitationSchubart 1806) that became less pronounced or even indistinguishable with the rise of equal temperament (CitationSteblin 1983).
This entails also that the assumption of transpositional invariance between keys – whether the distribution of tonal pitch-classes in a piece is independent of the key – is dependent on the historical context, and can not be universally assumed (see also CitationRom 2011; CitationQuinn and White 2017). The tonal pitch-class co-evolution in the early 20th century shows resemblance to both the block structure of the 17th century as well as to the broad band along the main diagonal in the 19th century and thus somewhat represents a consolidation of these two extremes.
10. Conclusion
The main goal of this study was to investigate whether we can draw conclusions about fundamental tonal relations in musical compositions with a corpus-based approach. To that end, we analyzed the Tonal Pitch-Class Counts Corpus (TP3C; CitationMoss, Neuwirth, and Rohrmeier 2020) corpus, a large historical collection of tonal pitch-class counts in pieces of music. Without making any prior assumptions about the relations between these tonal pitch-classes we have shown that they can be most powerfully explained by invoking the concept of the line of fifths. We first noted that the corpus-level distribution of tonal pitch-classes exhibits a unimodal symmetric shape when ordered along the line of fifths. Building on this observation, we have demonstrated that, over the course of time, composers explore ever wider regions in this tonal space (Section 6). Furthermore, we introduced the concept of tonal pitch-class co-evolution and applied it to the entire corpus, as well as to historical subsegments, and provide an empirical justification for the primacy of the line of fifths also from a diachronic perspective (Sections 7–9).
Our study suggests several directions for future work, for instance the extension of the data base to a broader range of Western and potentially non-Western repertoires, the inclusion of intra-musical temporal information such as onsets and durations, as well as the development of more powerful methods to infer underlying tonal spaces, such as Bayesian modelling (CitationTemperley 2004; CitationAbdallah, Gold, and Marsden 2016). Our analyses here are based on the orthographic actualities in our corpus, i.e. in the scores and their digital encodings (see Sections 2 and 3). To what extent pitch-class spellings reflect notational preferences and conventions of certain composers rather than characteristics of their harmonic idiom is a subject to be pursued in future research.
The central role of the line of fifths for the organization of tonal material revealed in our study relates to and extends earlier empirical findings that have shown the importance of the perfect fifth, its constituent interval, for other musical aspects not considered here, for instance root and chord progressions (CitationHedges and Rohrmeier 2011; CitationMoss et al. 2019; CitationMoss, Fernandes Souza, and Rohrmeier 2020), tonal tension (CitationLerdahl and Krumhansl 2007; CitationNavarro-Cáceres et al. 2020), as well as for the historical development of Western tonality (CitationHuang et al. 2017; CitationYust 2019; CitationLieck, Moss, and Rohrmeier 2020; CitationHarasim et al. 2021). However, some of these approaches found the circle of fifths rather than the line of fifths, simply due to the fact that their studies were based on MIDI files, thus incorporating enharmonic equivalence. This exemplifies how assumptions encoded in the data may influence and potentially bias results. While in this case the divergence between the discovery of the circle of fifths on one hand and the line of fifths on the other may be seen as marginal, the general lesson from this for empirical music analysis is to pay attention to unspoken premises and make them explicit whenever possible.
Supplemental online material
Supplemental online material for this article can be accessed at http://doi.org/10.1080/17459737.2022.2044927. In the Online Supplement, we provide the code to reproduce the results and figures in this paper.
Supplemental Material
Download Zip (46 KB)Acknowledgments
The authors thank Daniel Harasim and Steffen Herff for constructive comments on previous versions of this paper. We would like to thank the two anonymous reviewers and editors Jason Yust and Emanuel Amiot.
Disclosure statement
No potential conflict of interest was reported by the author(s).
Additional information
Funding
Notes
1 The corpus can be accessed at https://github.com/DCMLab/TP3C.
8 Notes also have many other attributes: physical ones such as timbre or volume, and structural ones such as the voice or formal unit in which they occur. Here, we consider only the pitch dimension.
9 While the transformation of tonal into neutral pitch-classes is achieved by deterministically mapping a tonal pitch-class to a neutral pitch-class
(in fifths ordering), the reverse direction involves some kind of inference and is called the problem of pitch spelling (CitationTemperley 2001; CitationStoddard, Raphael, and Utgoff 2004; CitationChew and Chen 2005; CitationCambouropoulos 2003; CitationMeredith 2006; CitationFoscarin, Audebert, and Fournier-S'niehotta 2021).
10 The representation of musical pieces as bags of notes is used in several recent computational studies on music, e.g. CitationLieck, Moss, and Rohrmeier (2020); CitationHarasim et al. (2021).
11 It is important to note that the bag-of-notes representation relies on the assumption that the V dimensions are independent, meaning that this model does not a priori assume any particular order or dependencies between the tonal pitch-classes.
12 Transposing pieces to a common key, potentially distinguishing between the major and minor mode, leads to so-called tone profiles, commonly used in computational music research for key finding and related applications (CitationKrumhansl 1990; CitationAlbrecht and Shanahan 2013; CitationHuron 2006; CitationHarasim et al. 2021)
13 This definition follows CitationTymoczko (2011, 4) who defines “centricity” – which can be established by the most frequent note – as one of the core components of tonality. See also CitationMoss et al. (2019) who employ a similar concept for the centricity of chords.
14 The encodings of pieces in the corpus may contain ficta that have been added by an editor, which may explain why most Renaissance pieces fall in the chromatic rather than the diatonic segment.
15 One general remark has to be made with respect to historical data. In order to infer a historical trend from data, more distant data points have lesser influence on a current estimate than close ones, regardless whether they lie in the past or in the future with respect to the data point under consideration. Taking future values into account to model present ones might seem like a methodologically inappropriate choice. One could easily amend this issue by choosing a neighbourhood, in fact a past window, of that only contains data points
where
.
16 Recordings can be found at https://youtu.be/hk2EPDbTAvM and https://youtu.be/8jDSAxw5Bnc.
16 The correlation of two vectors p and q is defined as where
is the covariance and σ the standard deviation.
17 The difference in using the correlation instead of the covariance matrix is that the latter is expressed in terms of the data that has been standardized to have unit variance.
18 Since the period before 1400 contains only ten pieces in three distinct years, we ignore it in the following considerations.
References
- Abdallah, Samer, Nicolas Gold, and Alan Marsden. 2016. “Analysing Symbolic Music with Probabilistic Grammars.” In Computational Music Analysis, edited by David Meredith, 157–189. Springer.
- Albrecht, Joshua, and Daniel Shanahan. 2013. “The Use of Large Corpora to Train a New Type of Key-finding Algorithm: An Improved Treatment of the Minor Mode.” Music Perception: An Interdisciplinary Journal 31 (1): 59–67.
- Atlas, Raphael. 1990. “Spelling in Early 19th-century Piano Music: A Guide to Performance.” Journal of Musicological Research 10 (3–4): 199–237.
- Benjamin, William E. 1982. “Models of Underlying Tonal Structure: How Can They Be Abstract, and How Should They Be Abstract?.” Music Theory Spectrum 4: 28–50.
- Biamonte, Nicole. 2008. “Augmented-Sixth Chords Vs. Tritone Substitutes.” Music Theory Online 14 (2). http://www.mtosmt.org/issues/mto.08.14.2/mto.08.14.2.biamonte.html
- Bigo, Louis, and Andreatta Moreno. 2016. “Topological Structures in Computer-Aided Music Analysis.” Chap. 3 in Computational Music Analysis, edited by David Meredith, 57–80. Berlin: Springer.
- Bishop, Christopher M. 2006. Pattern Recognition and Machine Learning. Berlin: Springer.
- Brower, Candace. 2008. “Paradoxes of Pitch Space.” Music Analysis 27 (1): 51–106.
- Cambouropoulos, Emilios. 2003. “Pitch Spelling: A Computational Model.” Music Perception: An Interdisciplinary Journal 20 (4): 411–429.
- Carey, Norman, and David Clampitt. 1989. “Aspects of Well-Formed Scales.” Music Theory Spectrum 11 (2): 187–206.
- Chew, Elaine. 2000. “Towards a Mathematical Model of Tonality.” Doctoral diss., Massachussets Institute of Technology, Cambridge, MA.
- Chew, Elaine, and Yun-Ching Chen. 2005. “Real-Time Pitch Spelling Using the Spiral Array.” Computer Music Journal 29 (2): 61–76.
- Cleveland, William S., and Susan J. Devlin. 1988. “Locally Weighted Regression: An Approach to Regression Analysis by Local Fitting.” Journal of the American Statistical Association 83 (403): 596–610.
- Clough, John, Nora Engebretsen, and Jonathan Kochavi. 1999. “Scales, Sets and Interval Cycles: A Taxonomy.” Music Theory Spectrum 21 (1):74–104.
- Clough, John, and Gerald Myerson. 1985. “Variety and Multiplicity in Diatonic Systems.” Journal of Music Theory 29 (2): 249–270.
- Clough, John, and Gerald Myerson. 1986. “Musical Scales and the Generalized Circle of Fifths.” The American Mathematical Monthly 93 (9): 695–701.
- Cohn, Richard. 1999. “As Wonderful As Star Clusters: Instruments for Gazing At Tonality in Schubert.” 19th-Century Music 22 (3): 213–232.
- Cover, Thomas M., and Joy A. Thomas. 2006. Elements of Information Theory. 2nd ed. Hoboken, NJ: Wiley.
- Damschroder, David. 2008. Thinking About Harmony: Historical Perspectives on Analysis. Cambridge: Cambridge University Press.
- Efron, Bradley, and Robert J. Tibshirani. 1993. An Introduction to the Bootstrap. London: Chapman and Hall/CRC.
- Fétis, François-Joseph. 1844. Traité complet de la théorie et de la pratique de l'harmonie. 2nd ed. Paris: Maurice Schlesinger.
- Forte, Allen. 1991. “Debussy and the Octatonic.” Music Analysis 10 (1/2): 125–169.
- Foscarin, Francesco, Nicolas Audebert, and Raphaël Fournier-S'niehotta. 2021. “PKSpell: Data-Driven Pitch Spelling and Key Signature Estimation.” In International Society for Music Information Retrieval Conference (ISMIR), Online, India.
- Gárdonyi, Zsolt, and Hubert Nordhoff. 2002. Harmonik. Wolfenbüttel: Möseler Verlag.
- Gillies, Malcolm. 1983. “Bartók's Notation: Tonality and Modality.” Tempo 145: 4–9.
- Harasim, Daniel, Fabian C. Moss, Matthias Ramirez, and Martin Rohrmeier. 2021. “Exploring the Foundations of Tonality: Statistical Cognitive Modeling of Modes in the History of Western Classical Music.” Humanities and Social Sciences Communications 8 (5): 1–11.
- Harasim, Daniel, Stefan E Schmidt, and Martin Rohrmeier. 2016. “Bridging Scale Theory and Geometrical Approaches to Harmony: The Voice-leading Duality Between Complementary Chords.” Journal of Mathematics and Music 10 (3): 193–209.
- Harasim, Daniel, Stefan E Schmidt, and Martin Rohrmeier. 2020. “Axiomatic Scale Theory.” Journal of Mathematics and Music 14 (3): 223–244.
- Hauptmann, Moritz. 1853. Die Natur der Harmonik und der Metrik. Leipzig: Breitkopf und Härtel.
- Hedges, Thomas, and Martin Rohrmeier. 2011. “Exploring Rameau and Beyond: A Corpus Study of Root Progression Theories.” In Mathematics and Computation in Music, edited by Carlos Agon, Moreno Andreatta, Gérard Assayag, Emmanuel Amiot, Jean Bresson, and John Mandereau, 334–337. Berlin: Springer.
- Hentschel, Johannes, Markus Neuwirth, and Martin Rohrmeier. 2021. “The Annotated Mozart Sonatas: Score, Harmony, and Cadence.” Transactions of the International Society for Music Information Retrieval 4 (1): 67–80.
- Herremans, Dorien, and Elaine Chew. 2019. “MorpheuS: Generating Structured Music with Constrained Patterns and Tension.” IEEE Transactions on Affective Computing 10 (4): 510–523.
- Hostinský, Otakar. 1879. Die Lehre von den musikalischen Klängen: ein Beitrag zur aesthetischen Begründung der Harmonielehre. Prague: H. Dominicus.
- Huang, Pu, Mark Wilson, Dustin Mayfield-Jones, Viktoriya Coneva, and Margaret Frank. 2017. “The Evolution of Western Tonality: A Corpus Analysis of 24,000 Songs from 190 Composers Over Six Centuries.” SocArXiv.
- Huron, David. 2006. Sweet Anticipation: Music and the Psychology of Expectation. Cambridge, MA: The MIT Press.
- Krumhansl, Carol L. 1990. Cognitive Foundations of Musical Pitch. New York, NY: Oxford University Press.
- Larson, Steve. 2012. Musical Forces: Motion, Metaphor, and Meaning in Music. Indiana University Press.
- Lendvai, Ern. 1971. Béla Bartók: An Analysis of His Music. London, UK: Kahn & Averill.
- Lerdahl, Fred. 2001. Tonal Pitch Space. Oxford: Oxford University Press.
- Lerdahl, Fred, and Carol L. Krumhansl. 2007. “Modeling Tonal Tension.” Music Perception: An Interdisciplinary Journal 24 (4): 329–366.
- Levine, Mark. 1989. The Jazz Piano Book. Petaluma, CA: Sher Music.
- Levine, Mark. 1995. The Jazz Theory Book. Sebastopol, CA: Sher Music.
- Lewin, David. 1987. Generalized Musical Intervals and Transformations. Oxford: Oxford University Press.
- Lieck, Robert, Fabian C. Moss, and Martin Rohrmeier. 2020. “The Tonal Diffusion Model.” Transactions of the International Society for Music Information Retrieval 3 (1): 153–164.
- Manning, C. D., and H Schütze. 2003. Foundations of Statistical Natural Language Processing. 6th ed. Cambridge, MA: The MIT Press.
- Mattheson, Johann. 1739. Der Vollkommene Capellmeister. Hamburg: Christian Herold.
- Mazzola, Guerino. 1985. Geometrie der Töne: Elemente der Mathematischen Musiktheorie. Basel: Birkhäuser.
- Meredith, David. 2006. “The Ps13 Pitch Spelling Algorithm.” Journal of New Music Research 35 (2): 121–159.
- Messiaen, Olivier. 1944. Technique De Mon Langage Musical. Vol. 1. Paris: Alphonse Leduc.
- Morgan, Robert P. 2003. “The Concept of Unity and Musical Analysis.” Music Analysis 22 (1/2): 7–50.
- Moss, Fabian C. 2019. “Transitions of Tonality: A Model-Based Corpus Study.” Doctoral Diss., École Polytechnique Fédérale de Lausanne, Lausanne, Switzerland.
- Moss, Fabian C., Markus Neuwirth, Daniel Harasim, and Martin Rohrmeier. 2019. “Statistical Characteristics of Tonal Harmony: A Corpus Study of Beethoven's String Quartets.” PLOS ONE 14 (6): e0217242.
- Moss, Fabian C., Markus Neuwirth, and Martin Rohrmeier. 2020. “Tonal Pitch-Class Counts Corpus (TP3C).” https://doi.org/10.5281/zenodo.3600088.
- Moss, Fabian C., Willian Fernandes Souza, and Martin Rohrmeier. 2020. “Harmony and Form in Brazilian Choro: A Corpus-Driven Approach to Musical Style Analysis.” Journal of New Music Research 49 (5): 416–437.
- Navarro-Cáceres, María, Marcelo Caetano, Gilberto Bernardes, Mercedes Sánchez-Barba, and Javier Merchán Sánchez-Jara. 2020. “A Computational Model of Tonal Tension Profile of Chord Progressions in the Tonal Interval Space.” Entropy 22 (11): 1291.
- Noll, Thomas. 2009. “Der Halbton im Zwielicht von Leitton- und Moduswechsel: Zum Stellenwert von Enharmonik in Schuberts B-Dur Sonate (D 960).” In Musiktheorie an ihren Grenzen: Neue und Alte Musik: 3. Internationaler Kongress für Musiktheorie, 10.-12. Oktober 2003, Musik-Akademie der Stadt Basel., edited by Angelika Moths, 335–347. Peter Lang Verlag.
- Noll, Thomas. 2010. “Two Notions of Well-Formedness in the Organization of Musical Pitch.” Musicae Scientiae 14 (1_suppl): 95–113.
- Perle, George. 1984. “Scriabin's Self-Analyses.” Music Analysis 3 (2): 101–122.
- Perry, Simon. 1995. “Rummaging Through the 'Catacombs': Clues in Musorgsky's Pitch Notations.” Music Analysis 14 (2/3): 221–255.
- Perry, Simon. 1998. “Musorgsky's 'Gnomus:' Composer's Score As Analytical Text.” Context: Journal of Music Research (15/16): 5.
- Piotrowski, Michael. 2019. “Historical Models and Serial Sources.” Journal of European Periodical Studies 4 (1): 8–18.
- Quinn, Ian, and Christopher Wm. White. 2017. “Corpus-derived Key Profiles are Not Transpositionally Equivalent.” Music Perception: An Interdisciplinary Journal 34 (5): 531–540.
- Riemann, Hugo. 1900. Musik-Lexikon. 5th ed. Leipzig: Max Hesse.
- Rohrmeier, Martin. 2020. “The Syntax of Jazz Harmony: Diatonic Tonality, Phrase Structure, and Form.” Music Theory and Analysis (MTA) 7 (1): 1–63.
- Rom, Uri B. 2011. “Tonartbezogenes Denken in Mozarts Werken unter besonderer Berücksichtigung des Instrumentalwerks.” Doctoral diss., Technische Universität Berlin, Berlin, Germany.
- Rosenbaum, Paul R. 2010. Design of Observational Studies. Berlin: Springer.
- Roweis, S. T., and L. K. Saul. 2000. “Nonlinear Dimensionality Reduction by Locally Linear Embedding.” Science 290 (5500): 2323–2326.
- Samson, Jim. 1989. “Chopin and Genre.” Music Analysis 8 (3): 213–231.
- Schoenberg, Arnold. 1975. “Opinion or Insight.” In Style and Idea, edited by Leonard Stein, 258–264. London, UK: Faber and Faber.
- Schubart, Christian Friedrich Daniel. 1806. Ideen zu einer Ästhetik der Tonkunst. Vienna: J. V. Degen.
- Sethares, William A. 2005. Tuning, Timbre, Spectrum, Scale. 2nd ed. London: Springer.
- Steblin, Rita. 1983. A History of Key Characteristics in the 18th and Early 19th Centuries. Ann Arbor: UMI Research Press.
- Stoddard, Joshua, Christopher Raphael, and Paul E. Utgoff. 2004. “Well-Tempered Spelling: A Key-Invariant Pitch Spelling Algorithm.” In Proceedings of the 5th International Conference on Music Information Retrieval (ISMIR 2004).
- Straus, Joseph Nathan. 2005. Introduction to Post-Tonal Theory. 3rd ed. New York: Pearson Prentice Hall.
- Temperley, David. 2000. “The Line of Fifths.” Music Analysis 19 (3): 289–319.
- Temperley, David. 2001. The Cognition of Basic Musical Structures. Cambridge, MA: The MIT Press.
- Temperley, David. 2004. “Bayesian Models of Musical Structure and Cognition.” Musicae Scientiae 8 (2): 175–205.
- Tymoczko, Dmitri. 2002. “Stravinsky and the Octatonic: A Reconsideration.” Music Theory Spectrum 24 (1): 68–102.
- Tymoczko, Dmitri. 2011. A Geometry of Music: Harmony and Counterpoint in the Extended Common Practice. Oxford: Oxford University Press.
- Van Den Toorn, Pieter C. 2003. “Stravinsky and the Octatonic: The Sounds of Stravinsky.” Music Theory Spectrum 25 (1): 167–202.
- Van Der Maaten, Laurens, and Geoffrey Hinton. 2008. “Visualizing Data Using T-SNE.” Journal of Machine Learning Research 9: 2579–2605.
- Vogler, Georg Joseph. 1802. Handbuch Zur Harmonielehre Und Für Den Generalbaß. Prag: Barth.
- von Oettingen, Arthur. 1866. Harmoniesystem in dualer Entwicklung. Dorpat und Leipzig: W. Gläser.
- Wai-Ling, Cheong. 1993. “Orthography in Scriabin's Late Works.” Music Analysis 12 (1): 47–69.
- Weber, Gottfried. 1851. The Theory of Musical Composition, Treated with a View to a Naturally Consecutive Arrangement of Topics. London, UK: Messrs. Robert Cocks and Co.
- Weiß, Christof, M. Mauch, and Simon Dixon. 2018. “Investigating Style Evolution of Western Classical Music: A Computational Approach.” Musicae Scientiae 23 (4): 486–507.
- Yust, Jason. 2019. “Stylistic Information in Pitch-class Distributions.” Journal of New Music Research 48 (3): 217–231.