
1. Introduction
Activity cliffs (ACs) consist of structurally similar active compounds having large differences in potency [Citation1–Citation3]. In other words, they encode structural relationships in which small chemical modifications lead to large potency variations. Accordingly, ACs – if encountered during compound optimization – reveal substitution sites and chemical changes that determine structure–activity relationships (SARs) in compound series. As such, ACs are principal indicators of SAR discontinuity [Citation1,Citation2]. Identifying discontinuous SARs helps to navigate out of ‘SAR flatlands’ during early stages of compound optimization when potency improvement is a primary focal point. At the same time, the presence of SAR discontinuity is often problematic during late stages of lead optimization when multiple parameters must be balanced including – among others – solubility, metabolic stability, or pharmacokinetics. Then, chemical modifications must be considered to further improve such properties while retaining sufficiently high potency. Hence, ACs are not always desired by medicinal chemists. However, knowledge of ACs usually helps to focus chemical optimization efforts on regions in molecules that are critical for biological activity and to identify SAR determinants. Furthermore, in computational chemistry, ACs are of interest from several points of view. Importantly, the presence of ACs and SAR discontinuity principally limits quantitative SAR (QSAR) analysis and potency predictions for newly designed compounds [Citation1]. On the other hand, ACs provide important test cases for calibrating nonlinear activity prediction methods. In addition, ACs aid in structure-based drug design, especially when they are studied in three dimensions, as further discussed below.
For ACs, different molecular representations can be used. Importantly, the representation and identification of ACs cannot be separated from each other, which is often not sufficiently taken into consideration. In the following, it is discussed how ACs can be conceptualized and identified on a large scale, going beyond individual compound series. Initially, the question is addressed how ACs should best be defined, an important prerequisite for their analysis.
2. Definition of activity cliffs
The definition of ACs depends on two key criteria. First, when are compounds sufficiently ‘similar’ to form a cliff? Secondly, when are potency differences ‘large enough’?
2.1. Potency difference criterion
In the study of ACs, potency differences can either be considered as a continuum or as discrete states. The significance of potency differences in compound data sets can only be evaluated on the basis of systematic pairwise compound comparison and statistical analysis of potency difference distributions. While absolute potency differences are difficult to generalize as an AC criterion for different compound classes and targets, an at least 100-fold difference in potency between AC partners is statistically significant in many cases and has been used to define ACs [Citation3].
2.2. Similarity criterion
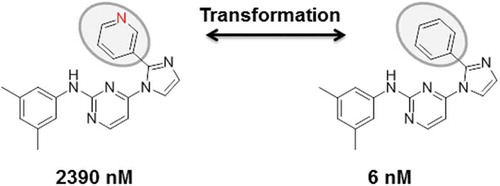
While potency differences result from experimental measurements, similarity between active compounds can be assessed in a variety of ways. The standard approach to quantify similarity for AC assessment has been the calculation of the Tanimoto coefficient on the basis of fingerprint descriptors [Citation2]. By definition, this numerical similarity metric assesses whole-molecule similarity in ‘fingerprint space’ and requires the definition of threshold values. From a medicinal chemistry perspective, numerical Tanimoto similarity is sometimes difficult to interpret. Accordingly, substructure-based similarity measures have also been applied for AC definition [Citation3]. For example, substructure-based similarity criteria might include the presence of the same scaffold in compounds or the formation of matched molecular pairs (MMPs) [Citation4,Citation5]. Thus, in contrast to numerical measures, the application of substructure-based criteria leads to a binary ‘yes/no’ similarity assessment. MMPs are particularly attractive for AC analysis. They are defined as pairs of compounds that are only distinguished by a chemical modification at a single site [Citation4], i.e. an exchange of two substructures, often termed a ‘transformation’ [Citation5]. For AC definition, transformation size-restricted MMPs have been introduced that limit the formation of MMPs to structural analogs [Citation6], as illustrated in showing an exemplary MMP-based AC (‘MMP-cliff’).
Figure 1. MMPs and ACs. Shown is a pair of kinase inhibitors forming a transformation size-restricted MMP and AC. The large potency difference is due to a single heteroatom replacement.
2.3. Compound pairs or groups?
In addition to evaluating alternative similarity and potency difference criteria, a third key issue in defining ACs is whether they should be considered at the level of ‘isolated’ pairs of active compounds following their original definition [Citation1] or by taking larger numbers of molecules into account. In compound data sets, the vast majority of ACs were found to be formed in a ‘coordinated’ manner, i.e. by groups of highly and weakly potent compounds, yielding multiple and overlapping ACs [Citation7]. Coordinated ACs contain more SAR information than individual ACs considered separately, as further discussed below. Therefore, ACs are best analyzed taking multiple compounds and their relationships into account.
2.4. Preferred definition
In light of the above considerations, the author prefers the following AC definition:
Potency difference criterion: at least 100-fold (at least one compound with potency in the sub-micromolar range); similarity criterion: formation of a transformation site-restricted MMP; basic AC unit: coordinated cliffs (with variable numbers of participating compounds).
3. Representation of activity cliffs
When individual analog series are investigated, compound relationships might be assessed intuitively through a ‘chemist’s eye.’ However, for systematic search calculations, a consistently applied definition and representation of ACs is required.
3.1. Molecular graphs
A standard way of representing ACs is the use of molecular graphs and two-dimensional (2D) numerical or substructure-based similarity measures, leading to ‘2D-ACs.’ This representation makes search calculations straightforward.
3.2. Three-dimensional cliffs
ACs can also be evaluated and represented in three dimensions by comparing experimental (or even hypothetical) compound binding modes, yielding ‘3D-ACs’ [Citation8]. The assessment of 3D-ACs requires the availability of multiple complex X-ray structures of given targets with different ligands and their careful superposition. In addition, reliable potency data must be available for bound ligands. Then, 3D ligand (binding mode) similarity is quantified using computational methods taking both conformational and positional differences into account [Citation8]. So derived 3D-ACs make it possible to explore ligand–target interaction differences at the atomic level of detail that might be critical for compound potency and SARs at and provide guidance for structure-based drug design. In addition, 3D-ACs are excellent test cases for computational approaches to predict binding (free) energy differences. Exemplary 3D-ACs are shown in .
Figure 2. 3D-ACs and 2D extensions. Shown is a 3D-AC formed by thrombin inhibitors (top). Crystallographic inhibitors were aligned by superposing the thrombin structures from their complexes and their 3D similarity was quantified. Molecular graphs of the 3D-AC inhibitors are shown below the X-ray structure (boxed). In addition, for each inhibitor, two structurally analogous thrombin inhibitors are displayed (bottom) that were identified by 2D-MMP searching (structural modifications are highlighted in red). For all inhibitors, pKi values are reported.
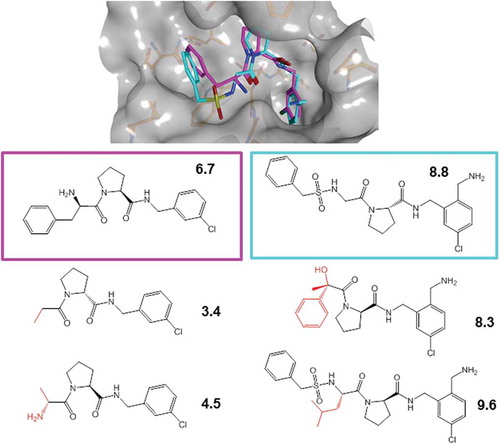
Although 2D and 3D representations of ACs are distinct, their use is not mutually exclusive. As further discussed below, analogs of 3D-AC partners with varying potency can be identified for which no structural information is available and assigned to these cliffs, thereby generating 2D extensions of 3D-ACs [Citation9], as illustrated in .
3.3. Networks
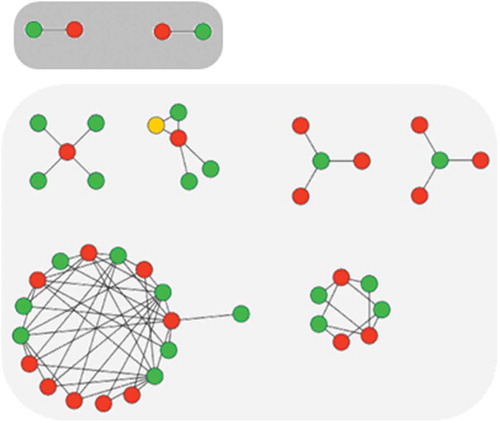
Coordinated ACs are best viewed and analyzed in networks in which nodes represent compounds and edges pairwise ACs [Citation10]. In such network representations, coordinated ACs give rise to the formation of separate clusters that consist of sets of structural analogs with large potency variations (). AC clusters contain much more SAR information than ACs considered in isolation. However, subjective one-by-one analysis of larger AC clusters can quickly become cumbersome. Therefore, first computational methods have been introduced to organize AC clusters on the basis of their composition and extract SAR information from them [Citation11–Citation13]. For example, pathways of analogs following potency gradients scan be systematically extracted from AC clusters [Citation12,Citation13].
Figure 3. AC network and clusters. Shown is a prototypic AC network for a small set of 46 serotonin receptor ligands (nodes) forming 69 ACs (edges) including two isolated (top; dark gray background) and 67 coordinated cliffs (bottom; light gray background). Green and red nodes indicate highly and weakly potent compounds, respectively, and yellow nodes compounds that are highly or weakly potent partners in different cliffs. Coordinated ACs form clusters of varying size and topology.
4. Identification of activity cliffs
To search for ACs, public compound repositories have become indispensable resources, in particular the ChEMBL database [Citation14], the major source of compounds and activity data from the medicinal chemistry literature including patents. Although other databases are available that contain quantitative activity data, most ACs originate from chemical optimization efforts, for which ChEMBL is the primary resource. Access to hit-to-lead and lead optimization data is essential for AC analysis.
4.1. Compound data mining
Computational searching for ACs goes beyond analog series and compares compounds in large and heterogeneous data sets, regardless of their origins. Therefore, pairwise similarity relationships must be exhaustively explored and potency differences determined. This also requires careful curation of activity data to avoid artifacts and focus the analysis on high-confidence ACs.
4.2. Chemical context
An important aspect of computational analysis is that systematically identified ACs do not necessarily originate from the same optimization efforts. Rather, these ACs might often combine compounds from different chemistry projects and publications. Thus, medicinal chemists are unable to associate such ACs with a specific optimization context. Moreover, through compound data mining, chemists might be presented with many more ACs than they would typically encounter when evolving individual compound series. Studying ACs outside specific optimization contexts does not reduce their value for SAR analysis, but might cause reluctance of chemists to consider these ACs in their practical optimization efforts. This is an important issue that might at least partly be responsible for the still limited utilization of external AC information in the practice of medicinal chemistry.
4.3. Search calculations
Searching for similar compounds formally qualifying as ACs is straightforward when 2D molecular representations are employed such as fingerprint descriptors or MMPs, both of which are computationally efficient representations. However, a thorough assessment of AC coordination requires projecting similarity relationship between cliff partners into AC networks, as mentioned above (). By contrast, the search for 3D-ACs is a multi-step procedure involving structural superpositions and quantitative binding mode comparisons [Citation8]. 3D-ACs can be further extended by carrying out 2D-MMP searches for cliff partners in compound databases to identify qualifying analogs [Citation9] (). Such ‘3D-2D-ACs’ provide additional opportunities to conformationally map analogs onto 3D-cliffs and thus further increase their utility for SAR analysis and structure-based design.
4.4. Frequency of activity cliffs
On the basis of systematic computational AC exploration of ChEMBL (release 20), our most recent in-house survey, more than 17,000 high-confidence ACs (transformation size-restricted MMPs; at least 100-fold difference in potency between cliff partners) were identified for compounds with activity against more than 300 targets. More than 60% of these ACs were formed by compounds with micromolar vs. nanomolar potency – and thus covered the optimization-relevant range – and more than 95% of these cliffs were coordinated. For fingerprint similarity, the number of ACs was larger and exceeded 30,000, indicating that the assessment of substructure-based similarity is more conservative than whole-molecule similarity calculations. However, only 20% of ACs detected on the basis of fingerprint similarity were also identified on the basis of MMP relationships, hence reflecting a strong representation dependence of ACs, which is often not sufficiently considered. Furthermore, on the basis of high-resolution X-ray structures of ligand-target complexes, more than 600 3D-ACs were identified for more than 60 targets [Citation9]. More than 400 of these 3D-ACs were further extended with a total of nearly 2000 analogs identified via 2D-MMP searching in ChEMBL.
Thus, taken together, public domain compounds, X-ray structures, and curated activity data yield a large knowledgebase of high-confidence ACs for SAR exploration and compound design.
5. Conclusions
Herein, it has been discussed how to rationalize, represent, and systematically identify ACs, which reveal strong SAR discontinuity and encode SAR determinants. ACs can be defined and represented in two or three dimensions, yielding 2D- or 3D-ACs, respectively. Although ACs are frequently observed during chemical optimization, most AC information has been obtained by computational analysis of compounds and their activity data. Currently, many thousands of high-confidence 2D-ACs are available for hundreds of therapeutic targets. Importantly, the vast majority of ACs are formed in a coordinated manner by series of analogs, giving rise to the formation of clusters in AC networks. Such AC clusters have high SAR information content, which can be extracted and made available through recently developed computational methods.
6. Expert opinion
Although ACs have experienced increasing interest in the field over the past years, the key issues how to represent and identify ACs are often overlooked. Importantly, these tasks cannot be separated from each other, given the strong representation dependence of ACs on the one hand and their equally important dependence on activity data confidence criteria on the other. ACs provide a large knowledgebase for SAR analysis and compound design. Given rapidly increasing volumes of publicly available compounds and activity data, continuing growth in AC information is expected. The way in which similarity is assessed is a major variable in AC analysis and the representation dependence requires careful consideration. The number of available 2D-ACs is much larger than of 3D-ACs, given that high-resolution X-ray structure are required for determining the latter. However, 2D extension of 3D-ACs through analog searching is a scientifically interesting exercise that bridges between 2D and 3D representations and further increases the utility of structure-based ACs for SAR exploration. For example, in many instances, it is possible to explore SARs and generate hypotheses for compound design by superposing 2D analogs on 3D-ACs. Another interesting and highly relevant research topic is the characterization and systematic analysis of AC clusters, which have high SAR information content. For this purpose, the development of additional computational methods is desirable. For example, the practice of medicinal chemistry would greatly benefit from approaches to automatically and consistently extract SAR information from AC clusters of any composition, topology, and size. Although first steps in this direction have been made recently, there remains much room for new developments. Moreover, another challenge remains. AC information is currently still underutilized in practical medicinal chemistry, despite the large number of ACs that have become available through computational analysis and their extensive target coverage. A likely reason for this conundrum is the fact that AC collections are not directly associated with specific chemical optimization efforts. This is the case because most AC information is obtained by analyzing large compound sets that originate from many different projects. By contrast, medicinal chemists operate on sequences of compounds belonging to individual series. This discrepancy may at least in part rationalize reluctance of medicinal chemists to consider public domain SAR information in their projects. An important task for future AC research will be focusing retrospective analysis on individual series, in addition to determining global AC populations. Within specific optimization contexts, AC information may vary and it will be interesting to analyze how ACs encountered during sequential optimization efforts may or may not be utilized to decide which compounds to make next. However, this will require careful tracking of optimization efforts and including practicing medicinal chemists directly in systematic AC analysis. This is important from several points of view. Going forward, AC information must be made readily accessible to medicinal chemistry. Thus, computational chemists will be challenged to represent and communicate AC information in a way that is chemically intuitive and enables the inclusion of ACs in practical applications. To these ends, close collaboration between computational and medicinal chemists in assessing ACs within given optimization contexts will provide an excellent basis for the increasing consideration and utilization of AC information in the practice of medicinal chemistry. Last but not least, it is emphasized that ACs continue to present important test cases for computational analysis and design. Although first successful predictions of ACs have been reported, both in two and three dimensions [Citation15–Citation17], the development of new computational concepts for AC prediction will also be of high interest.
Declaration of interest
The author has no relevant affiliations or financial involvement with any organization or entity with a financial interest in or financial conflict with the subject matter or materials discussed in the manuscript. This includes employment, consultancies, honoraria, stock ownership or options, expert testimony, grants or patents received or pending, or royalties.
Acknowledgment
The author is grateful to Dilyana Dimova and Dagmar Stumpfe for help with illustrations.
Additional information
Funding
References
- Maggiora GM. On outliers and activity cliffs – why QSAR often disappoints. J Chem Inf Model. 2006;46:1535–1535.
- Stumpfe D, Bajorath J. Exploring activity cliffs in medicinal chemistry. J Med Chem. 2012;55:2932–2942.
- Stumpfe D, Hu Y, Dimova D, et al. Recent progress in understanding activity cliffs and their utility in medicinal chemistry. J Med Chem. 2014;57:18–28.
- Kenny PW, Sadowski J. Structure modification in chemical databases. In: Oprea TI, editor. Chemoinformatics in drug discovery. Weinheim: Wiley-VCH; 2005. p. 271–285.
- Hussain J, Rea C. Computationally efficient algorithm to identify matched molecular pairs (MMPs) in large data sets. J Chem Inf Model. 2010;50:339–348.
- Hu X, Hu Y, Vogt M, et al. MMP-cliffs: systematic identification of activity cliffs on the basis of matched molecular pairs. J Chem Inf Model. 2012;52:1138–1145.
- Hu Y, Stumpfe D, Bajorath J. Advancing the activity cliff concept. F1000Res. 2013;2:199.
- Furtmann N, Hu Y, Gütschow M, et al. Identification and analysis of currently available high-confidence three-dimensional activity cliffs. RSC Adv. 2015;5:43660–43668.
- Hu Y, Furtmann N, Bajorath J. Extension of three-dimensional activity cliff information through systematic mapping of active analogs. RSC Adv. 2015;5:43006–43015.
- Stumpfe D, Dimova D, Bajorath J. Composition and topology of activity cliff clusters formed by bioactive compounds. J Chem Inf Model. 2014;54:451–461.
- Dimova D, Stumpfe D, Bajorath. J. A method for the evaluation of structure-activity relationship information associated with coordinated activity cliffs. J Med Chem. 2014;57:6553–6563.
- Dimova D, Bajorath J. Extraction of structure-activity relationship information from activity cliff clusters via matching molecular series. Eur J Med Chem. 2014;87:454–460.
- Dimova D, Stumpfe D, Hu Y, et al. Activity cliff clusters as a source of structure-activity relationship information. Expert Opin Drug Discov. 2015;10:441–447.
- Gaulton A, Bellis LJ, Bento AP, et al. ChEMBL: a large-scale bioactivity database for drug discovery. Nucleic Acids Res. 2011;40:D1100–D1107.
- Heikamp K, Hu X, Yan A, et al. Prediction of activity cliffs using support vector machines. J Chem Inf Model. 2012;52:2354–2365.
- Horvath D, Marcou G, Varnek A, et al. Prediction of activity cliffs using condensed graphs of reaction representations, descriptor recombination, support vector machine classification, and support vector regression. J Chem Inf Model. 2016;56:1631–1640.
- Husby J, Bottegoni G, Kufareva I, et al. Structure-based predictions of activity cliffs. J Chem Inf Model. 2015;55:1062–1076.