
 ?Mathematical formulae have been encoded as MathML and are displayed in this HTML version using MathJax in order to improve their display. Uncheck the box to turn MathJax off. This feature requires Javascript. Click on a formula to zoom.
Abstract
This is the first study investigating preferred (self-selected) step frequency (PSF) in relation to optimal step frequency (OSF) during running at different speeds outside the laboratory. OSF was defined as the SF at which heartrate (HR) showed a minimum during running at a constant speed. We aimed for a high ecological validity, which prohibits the direct measurement of oxygen consumption. HR was used as a proxy of energy cost, as has previously been validated. After a practice session, 21 experienced recreational runners (12 female) ran in an out-and-back manner on a straight flat tarmac lane in three main sessions: (1) 27 min at fixed comfortable speed with PSF, (2) at the same speed but with different imposed SFs (range 140–200 steps min−1) and at PSF and (3) similarly but at 15% higher speed. Runners were paced by a cyclist. Second order polynomials fitted the individual SF-HR relations well. At comfortable speed (3.04 ± 0.28 m s−1) mean r2 was 0.81 (range: 0.40–0.99) and PSF and OSF respectively were 165 ± 8 and 171 ± 8 steps min−1 (p < .05). Both increased (p < .05) by 3 steps min−1 at the 15% higher speed. SFs were negatively (−0.66 < r < −0.49, p < .05) related to body height. From the individual SF-HR relations we deduced that changing PSF to OSF would decrease median HR only by 0.5 beats min−1, but for two participants meaningful reductions (1–3 beats min−1) were predicted. Outdoors, experienced recreational runners ran at a PSF slightly below OSF, but for most of them, there was little to gain in terms of HR reductions by increasing their SF to OSF.
Highlights
During treadmill running most well-trained runners run at step frequencies that minimize their energy expenditure. However, outdoor running, with air resistance and wind, is different from treadmill running.
Head or tailwinds had only minimal effects on the chosen step frequencies of experienced recreational runners that ran outdoors at a constant speed below anaerobic threshold and a 15% higher speed.
The present findings further suggest that experienced recreational runners prefer a step frequency slightly below the step frequency where energy consumption would be minimal, but for most of them, the energy sparing effect of a slight increase in step frequency was negligible.
Introduction
Running performance is, to an important extent, determined by the energy costs (Conley & Krahenbuhl, Citation1980; Larsen, Citation2003; Morgan, Martin, & Krahenbuhl, Citation1989; Saunders, Pyne, Telford, & Hawley, Citation2004). The energy cost of running at intensities below the anaerobic threshold can be obtained by measuring oxygen consumption. There is a well-established U-shaped relation between step frequency (SF) and oxygen consumption during treadmill running at a fixed submaximal speed (Cavanagh & Williams, Citation1982; de Ruiter, Verdijk, Werker, Zuidema, & de Haan, Citation2014; Hunter & Smith, Citation2007; Morgan et al., Citation1994; Snyder & Farley, Citation2011). Under these laboratory conditions, most (but not all) well trained runners apparently run at SFs which minimize their oxygen consumption (de Ruiter et al., Citation2014; Hunter & Smith, Citation2007; Morgan et al., Citation1994; Snyder & Farley, Citation2011). Novice runners appear to run at lower than optimal SFs (de Ruiter et al., Citation2014; van Oeveren, de Ruiter, Beek, & van Dieen, Citation2017). Collectively, these findings suggest that many runners could save some energy by increasing their SF, which at fixed running speed will result in reduced step lengths. Besides minimizing energy costs, SF may also be important in relation to injury risk management (Heiderscheit, Chumanov, Michalski, Wille, & Ryan, Citation2011; Luedke, Heiderscheit, Williams, & Rauh, Citation2018).
Thus far, preferred and optimal step frequencies (PSF and OSF) have been compared for treadmill running. The absence of optical flow, the specific stiffness of the running surface and especially the absence of air resistance and wind, make treadmill running different from outdoor running. PSF on a treadmill may not accurately reflect PSF in running over ground (Lieberman, Warrener, Wang, & Castillo, Citation2015). To the best of our knowledge, the relation between SF and energy costs has not yet been determined during free outdoor running. Consequently, it remains to be confirmed whether recreational runners prefer to run at an SF at or slightly below OSF when running outdoors. Moreover, the effects of wind and speed on PSF and OSF during outdoor running have not yet been established. Although we have no indications that wind would change PSF relative to OSF, in general, runners will testify that they increase their SF when running into a headwind. As such, in addition to the effects that wind has on HR (Davies, Citation1980; Jones & Doust, Citation1996; Pugh, Citation1971), wind likely affects PSF and may also affect OSF. Therefore, when studying the relationship between SF, HR and speed during outdoor over-ground running, it is important to consider the effects of wind.
Treadmill running studies strongly suggest that for most recreational runners OSF is lower than 170 steps min−1 (de Ruiter et al., Citation2014; Lieberman et al., Citation2015; van Oeveren et al., Citation2017). Nevertheless, in practice 180 steps min−1, a number that stems from observations in elite athletes (Daniels, Citation2005), is still often advocated as a desirable objective. Many (recreational) runners use some kind of running technology application or sports watch, that provides them with feedback on parameters like heart rate (HR) and SF. It would be a substantial improvement if feedback on SF could be personalized to inform runners whether they run at an SF which minimizes their energy costs. Therefore, the first goal of the present study was to investigate PSF in relation to the OSF in experienced recreational runners during outdoor runs executed within their habitual speed range. The second goal was, to do this in a manner that makes it possible for individual runners to determine their own OSF.
It is important to emphasize that the present study was not designed to quantify the exact energy costs. We used HR to establish the SF at which energy cost is minimal (de Ruiter et al., Citation2014; van Oeveren et al., Citation2017). Direct measurement of oxygen consumption using portable devices and respiration masks is unwanted when striving for a high ecological validity (first study aim) and such equipment is neither simple to handle nor accessible for the general public (second aim). We have previously shown that OSF determined based on HR is very similar to that derived from the direct measurement of oxygen consumption (de Ruiter et al., Citation2014).
We hypothesized that (i) individual OSF can be determined from the recorded HR and SF under ecologically valid but experimentally challenging conditions, (ii) during outdoor over-ground running trained recreational runners would run at a PSF slightly lower than their OSF (de Ruiter et al., Citation2014; Lieberman et al., Citation2015; van Oeveren et al., Citation2017), (iii) HR and SF are higher when running with headwind than with tailwind and that (iv) both PSF and OSF increase with speed (Cavanagh & Kram, Citation1989; Elliott & Blanksby, Citation1979; van Oeveren et al., Citation2017; Weyand, Sternlight, Bellizzi, & Wright, Citation2000).
Materials and methods
Participants
Twenty-one recreational runners (9 men, 12 women) with more than four years of running experience participated after providing written informed consent. They were recruited via social media and by word of mouth within the local running community. Only experienced runners who had not done any deliberate SF practice in the past, were free of injury, ran at least two times per week and were able to run 30 min consecutively, were included. Men and women respectively ran 3.7 ± 1.4 and 2.6 ± 1.4 times per week in the previous year and covered weekly distances of 44.4 ± 25.9 km and 22.7 ± 11.4 km. Their age, height and body mass (means ± SD) were: 25.9 ± 5.3 years, 1.76 ± 0.07 m and 65.9 ± 8.1 kg. All but one man and one woman participated in organized road runs (10–21 km in general). Their self-reported average speed during 5 km runs executed at maximal effort were 4.4 ± 0.9 m s−1 (men) and 3.4 ± 0.5 m s−1 (women). The study was conducted in accordance with the declaration of Helsinki and has been approved by the local ethics committee (VCWE-2016-181).
Test procedures
All runs were made on a flat 2 km tarmac lane along the border of the Amsterdam 2014 World Championships rowing venue, where GPS reception is optimal. The data were collected with a sports watch with GPS function (Garmin Forerunner 620, software version 3.30.0.0, Garmin Ltd., USA) the participants wore the HR belt (1 Hz sample rate) on the chest, the accompanying cyclist held the watch. During all tests, the participants were paced by the same cyclist who strived to maintain a constant speed. To this end the cyclist used a calibrated speedometer on the bike and rode 1 m and down-wind to the side of the runner, taking care not to shield the participant from the wind. Participants were injury free and had not done any deliberate SF-practice or -training in the past. There were four test sessions each separated by at least 48 h. The day before each session the participants did not do any exercise, otherwise, they maintained their usual activities and diet during the study period. During the sessions, the participants did not drink or eat.
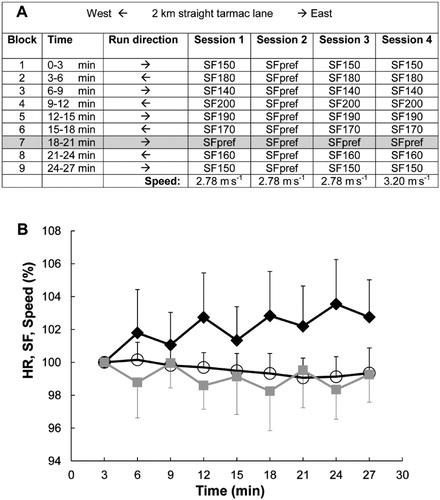
Participants started each of the four sessions with a 5-min warm up, which involved jogging at a freely chosen speed to the start location. In all four sessions, the warm up was followed by an out-and-back course of nine blocks of 3 min each, without rest between blocks ((A)). Speed was constant during the 27 min sessions. The out and back running ensured that the wind (head or tail) alternated and was similar for the first and last (ninth) block. The first and ninth block were run at the same SF, which enabled us to correct of the expected increase in HR, commonly known as cardiovascular drift (Kalis et al., Citation1988; Nassis & Geladas, Citation2002; Sproule, Citation1998). Sessions two, three and four were executed in random order.
Figure 1. A. Schematic overview of the experimental setup. This is an example of a single participant. Note that this participant ran at preferred SF (SFpref) between 18 and 21 min (block 7) in all sessions. B Mean (±SD) HR (black squares), SF (open circles) and running speed (grey squares) as a function of time. Values are normalized to the average values of the third minute (100%). The out-and-back runs in combination with the orientation of the running lane and the dominating Western winds (A), caused 18 of the 21 participants to experience a tailwind during the first 3 min and a head wind during the next block, etc. These wind effects (p < .05) are clearly visible in HR and speed and also slightly affected SF. HR increased, while SF and speed both slightly (p < .05) decreased over time.
The first session was a habituation session. During an extended warm up, a comfortable running speed below the ventilatory threshold was established by asking the participants to run at a speed that they felt able to maintain with ease for 30 min. This was verified by letting the participants talk while running.
During session two, the participants ran at their own comfortable speed and PSF. This session was included to investigate possible changes in PSF over time and the effects of running with a head- or tailwind on HR and PSF. Importantly, PSF in this session could not be influenced by running at imposed SF in any adjacent blocks. Session two also aimed to investigate whether HR would increase over time and whether this would occur in a linear manner to corroborate the corrections for cardiovascular drift in sessions three and four.
During sessions, one (habituation), three and four, seven blocks of 3 min duration each were run with different imposed SFs (140, 150, 160, 170, 180, 190 and 200 steps min−1). An additional block of running at PSF was included and the order of blocks was randomized, except that the first block was repeated at the end of the session (block nine), to be able to correct for cardiovascular-drift. The SF-order was randomized between participants but kept the same for each participant across sessions. Finally, participants ran at their own comfortable speed in sessions one, two and three, while running speed was increased by 15% in session four ((A)).
The SFs were imposed by pre-programmed metronome beat-sequences played via loud speakers on the accompanying bike. In this manner, the cyclist (pacer) could encourage the runner to adopt/stay at the correct SF. When participants had difficulties to adapt certain (usually low) SF, trials were added to practice running at these specific SFs during the habituation session.
Wind
Air temperature (7.3 ± 4.0°C), wind speed (4.3 ± 2.3 m s−1) and direction recorded by a nearby weather station (Schiphol airport, obtained via www.garminconnect.com) were used in the analysis. Note that all officially reported wind speeds are recorded at 10 m above ground level. At 1.5 m above ground level wind speed is about 50% of the officially reported wind speed (Chen, Bundy, & Hoff, Citation1998). This was confirmed by our own measurements of the wind speed. However, these measurements only lasted 30 s and the exact wind direction was difficult to reliably establish with our handheld (Vavuud) wind speed metre. Therefore, we used 50% of the officially reported wind speeds to calculate apparent (or relative) wind speed (Vapp) and direction. Vapp is the resultant vector of the actual wind and the wind that the runner creates by running at a given speed in still air. Vapp has an angle (β) with the running direction. The force that the runner has to deliver to overcome air drag (F) is a function of air density (ρ = 1.293.Pb.760−1.273.(273 + T)−1) with Pb being the barometric pressure (in Torr) and T the temperature (in °C). To calculate air drag force (Faero) in the running direction the following equation was used:with A the effective area 0.266 ((0.2025.height0.725.bodymass0.425) (Arsac & Locatelli, Citation2002)), Cd the drag coefficient (Cd = 0.9 (van Ingen Schenau, Jacobs, & de Koning, Citation1991)).
Note that even during the tailwind blocks, in the majority of cases Faero will have a negative sign (opposite to the running direction) because, as was already pointed out by Hill in 1928 (Hill, Citation1928), apparent (relative) velocity is the resultant vector of the actual wind speed (usually at an angle to the running direction) and running speed.
Data analysis
Running speed, SF and HR were obtained from the sports watch and the signals were processed with custom made MATLAB (version R2018a, The MathWorks. Inc., USA) scripts. This included the calculation of Vapp and Faero. The mean values of the last minute of all blocks were used for further analysis.
The results of session two confirmed that when an increase in HR occurred, this increase was indeed linear ((B)). Therefore, measured HR in sessions three and four was corrected for cardiovascular drift using a linear correction factor. This factor was defined as the difference in measured HR between the last (ninth) block and the first block divided by eight. Note that blocks one and nine were run at the same SF (and speed) and under similar wind conditions. Subsequently, measured HR in block two was diminished by the correction factor times one, measured HR in block three was diminished by the correction factor times two, etc. The corrected HR values were fitted (least squares) by a second order polynomial function. When mean running speed during a block deviated more than 5% from median total session running speed, data from that block were not included in this fitting procedure. Correcting HR for cardiovascular drift was expected (and confirmed) to increase the explained variance (r2) of the individually fitted second order polynomial SF-HR-functions. The minimum in the polynomial was used to determine OSF and HR at optimum (de Ruiter et al., Citation2014; Hunter & Smith, Citation2007; van Oeveren et al., Citation2017).
Statistical analysis
Unless otherwise indicated the data are presented as means ± standard deviation (SD). Statistical analysis was done in SPSS (version 23, IBM, Chicago). Normal distribution of the data was confirmed with the Kolmogorov–Smirnov test, visual inspection of the histograms, Q–Q plots, and box plots. To test for significant (p < .05) differences in the mean values of SF, HR and speed between sessions, paired t-test or ANOVA for repeated measures were used, followed by post-hoc Bonferroni corrected tests. Partial effect sizes are reported as ηp2. Pearson’s correlation coefficient was used to establish significance (p < .05) of correlation.
Linear mixed models were applied to quantify the contribution of different predictor variables to the changes in repeated measures of HR and/or SF within a session. The β-coefficients of the different effects with their 95% confidence intervals [lower limit; upper limit] are reported. Variables were included in the model if their effects were significant and if the fit of the model significantly (p < .05) improved. The latter was tested with Chi-square tests on the changes in Log Likelihood.
Results
Running for 27 min at PSF
The participants’ comfortable running speeds ranged from 2.76 to 3.62 m s−1. shows that there were small but significant differences in speed (p = .002, ηp2 = 0.39), SF (p = .02, ηp2 = 0.24) and HR (p < .001, ηp2 = 0.52) between the headwind and tailwind blocks.
Table I. Step frequencies and heart rates at two different running speeds
Despite the windy conditions, the cyclist almost succeeded in keeping the speed perfectly constant ((B)). However, with each minute of running, speed decreased by 0.00097 m s−1 ([0.0016;0.0004], p = .002), leading to a very small (∼0.8%) total decrease of speed within sessions. Moreover, speed decreased by 0.005 m s−1 ([0.003;0.006], p < .001) for every Newton increase in Faero, leading to small (∼1%, p < .05) speed fluctuations between head and tailwind blocks ((B)).
As expected, there was some cardiovascular drift ((B)). HR increased by 0.156 beats min−1 ([0.092;0.221] with each minute of running, p < .001). Wind had a significant effect on HR. For every Newton increase in Faero, HR increased by 0.387 beats min−1 ([0.253;0.510], p < .001). Furthermore, with each minute of running, SF decreased by 0.071 steps min−1 ([0.044;0.098 95% CI], p < .001) and for every Newton increase in Faero, SF increased by 0.095 steps min−1 ([0.033;0.157], p = .003).
Running for 3 min at PSF in between blocks ran at imposed SFs
In session 3 (and 4) one of the blocks was run at PSF (block 7 in the example shown in (A)). In contrast to session 2, the PSF-block in session 3 was surrounded by blocks during which different SFs were imposed. This had small, but significant effects: PSF in session three was slightly (p = .04, ηp2 = 0.20) lower (165 ± 8 steps min−1) than PSF recorded at the same point in time (block 7 in the example of (A)) in session two (167 ± 8 steps min−1, , third row). In addition, although speed should have been exactly the same, average speed at PSF tended to be somewhat (1.1 ± 2.5%) lower (p = .09, ηp2 = 0.14) in session three compared to the equivalent time-block in session two. However, these differences between sessions 2 and 3 were small and did not lead to a significant difference in HR at preferred SF between those sessions ().
OSF at a comfortable speed
For all participants, it was possible to fit a second order polynomial to the HR data (mean r2 = 0.81, range: 0.40–0.99) obtained at preferred running speed. OSF was 171 ± 8 steps min−1 (n = 21, ), which was significantly higher (p < .001, ηp2 = 0.48) than PSF (165 ± 8 steps min−1).
OSF at higher than the preferred speed
Three participants had problems in running at several of the imposed SFs while maintaining speed constant. These three were excluded from this analysis. For the others, it was possible to fit a polynomial to the HR data (mean r2 = 0.72, range: 0.34–0.98). OSF was 174 ± 7 steps min−1 (n = 18, ), which again was significantly higher (p < .01, ηp2 = 0.41) than PSF (168 ± 9 steps min−1) and also 3.0 steps min−1 higher (p < .05, ηp2 = 0.27) than OSF at preferred speed (session 3).
Individual PSF and OSF
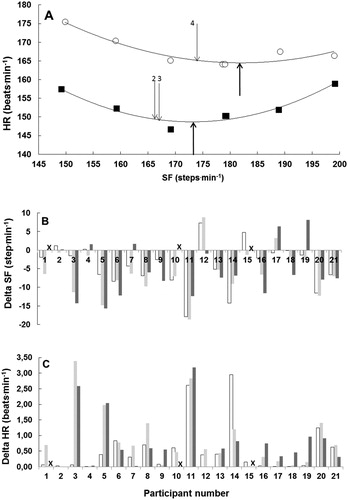
In the majority of runs PSF was lower than OSF ((B)). (C) shows the maximal decrease in HR that participants might achieve, if they would adjust (predominantly increase) their SF to optimum (OSF). Notably, the median reduction in HR would only be 0.46 (range 0–3.16) beats min−1.
Figure 2. Typical example (participant 13) of HR as a function of SF (A) during runs at 3.65 m s−1 (black squares; r2 = 0.93) and 4.14 m s−1(open circles; r2 = 0.91). Upward arrows denote OSF and numbered downward arrows denote PSF in sessions 2, 3 and 4. Crosses (X) indicate the missing data for participants 1, 10 and 15 in session four. In B the individual differences between PSF and OSF for sessions 2 (white bars), 3 (light grey) and 4 (dark grey) are depicted. Note that in the calculation of the delta values for session 2, OSF as determined in session three was used. In C the delta SF values (of B) are converted into the potential decreases in HR if participants would adjust (mostly increase) their SFs to OSF. These theoretical decreases in HR were calculated using the individually fitted second order polynomial SF-HR-functions (as depicted in A for participant 13).
As would be expected, PSF and OSF were related across sessions (0.60 < r < 0.93, p < .05). Body height was negatively (−0.66 < r < −0.49, p < .05) related to PSF and OSF across sessions. PSF and OSF were not different between males and females.
Discussion
Our results confirmed previous findings from treadmill running in the laboratory and showed that also in outdoor running people adopt an SF close to the energetic optimum. Although this does not come as a surprise, to the best of our knowledge, this has not been investigated before. Most (recreational) runners run outdoors and the presence of air resistance, optical flow and wind make outdoor running different from treadmill running. Moreover, and again to the best of our knowledge, this is the first study reporting the effects of wind on SF.
Preferred and optimal strep frequency
The results indicate that the absolute values of PSF and OSF during outdoor running are similar compared to previous laboratory findings. PSF and OSF for running at 3.45 m s−1 respectively were 168 ± 9 and 174 ± 7 steps min−1. Previously we have found PSF and OSF of 169 ± 11 and 174 ± 10 steps min−1 respectively for running at 3.5 m s−1 on a treadmill (de Ruiter et al., Citation2014). In addition, OSF (171 ± 8 steps min−1) found at 3.04 m s−1 was very similar to the metabolic optimum (170 ± 7 steps min−1) reported by Lieberman et al. for experienced runners at a similar (3.0 m s−1) speed (Lieberman et al., Citation2015). We did not find significant differences in PSF and OSF between male and female participants. We are unaware of any other studies specifically addressing this issue. But in general and similar to the present findings (−0.66 < r < −0.49, p < .05) negative relations between body height and SF have been found by others (Luedke, Heiderscheit, Williams, & Rauh, Citation2016). Our male participants were significantly (p = .003) taller (180.4 ± 5.4 cm) than the females (172.0 ± 5.7 cm), but they didn’t have a significantly (p = .28) lower PSF (164 ± 9 steps min−1) than the female participants (168 ± 7 steps min−1) in session 2, probably because running speed was higher (p = .014) in the males (3.25 ± 0.34 m s−1) than the females (2.95 ± 0.16 m s−1).
A consistent finding between the present and our earlier laboratory findings (de Ruiter et al., Citation2014; van Oeveren et al., Citation2017) is, that even experienced runners seem to prefer an SF which is slightly lower than OSF. This has been found by others (Cavanagh & Williams, Citation1982), although not consistently so (Hunter & Smith, Citation2007; Snyder & Farley, Citation2011). Our findings are in line with those of Folland et al., who recently suggested that over-striding, leading to uneconomically low SFs, is common in runners of diverse performance levels (Folland, Allen, Black, Handsaker, & Forrester, Citation2017). Besides energy costs, there may be other factors contributing to the selection of an SF and these factors may shift PSF away from the energetic minimum. PSF was suggested to result from a trade–off between braking force impulses that decrease with increasing SF and maximal hip flexion moments which increase with increasing SF (Lieberman et al., Citation2015). There are also indications that the overall cost of muscle activation, rather than the energy cost of locomotion may be minimized (Miller, Umberger, Hamill, & Caldwell, Citation2012; Neptune & Hull, Citation1999). In addition, ventilation (Fulton et al., Citation2018) and even the cardiac cycle (Constantini et al., Citation2018) is coupled to SF and therefore may influence SF.
If we accept the observation that PSF, in general, is slightly lower than OSF, we can use the individual SF-HR relations to estimate the potential reductions in HR that may be achieved by our participants if they would increase their PSF to OSF. The results show that only for two of our participants (11 and 14) a potential meaningful reduction in HR (1–3 beats min−1) was to be expected () when they would increase their PSF.
In the present study, we strived for a high ecological validity and therefore did not directly measure oxygen consumption. We used HR as a proxy of the energy costs during running (van Oeveren et al., Citation2017). This can be done because in healthy people the relation between exercise intensity and HR is linear up to values close to maximal oxygen consumption (Saltin, Citation1969). We have previously shown for treadmill running that OSF can be determined from HR data and that the results are very similar to those derived from direct measurements of oxygen consumption (de Ruiter et al., Citation2014).
Wind effects
During the headwind blocks in session two, PSF was only marginally (0.65 ± 1.17 steps min−1; p < .05) higher compared to the tailwind blocks (). Furthermore, the delta values (head-tailwind blocks) for SF were unrelated to the delta values of Faero (5.5 ± 4.1 N, r2 = 0.02) and speed (−0.025 ± 0.034 m s−1, r2 < 0.0001). Although we did not investigate the effects of wind on OSF, the current findings on PSF suggest that, similar to three-degree-changes running slope (Snyder & Farley, Citation2011), wind would hardly affect OSF. In contrast, HR clearly was sensitive to changes in wind. HR was higher with headwind than with tailwind () and although the range (0–8 beats min−1) in delta HR values (head-tailwind) was relatively small, 47% of the variance in delta HR could be explained by delta Faero (r2 = 0.47). In addition, forty-one percent (r2 = 0.41) of the small (∼1%) speed fluctuations between head and tailwind blocks could also be explained by delta Faero.
The presented effects of wind on HR (, ) expand earlier findings. The energy cost of overcoming air drag was estimated to be 2% for running outdoors at 5 m s−1 on a calm day (Davies, Citation1980). Jones and Doust demonstrated that HR was about 3–4 beats higher when running outside (calm day) compared to running on a treadmill (Jones & Doust, Citation1996). Pugh found an increase in VO2 of about 14% when ventilator wind increased from 0 to 10 m s−1 for a subject running on a treadmill at 3.75 m s−1 (Pugh, Citation1971). This would be equivalent to the difference between treadmill running at 3.5 m s−1 and outdoor running at the same speed (current session 4) into a headwind of 6.5 m s−1. Six of our participants ran in winds of about 6.5 m s−1 and indeed, for them HR was 4–8 beats min−1 higher during headwind compared to tailwind blocks, illustrating the substantial effects that wind can have on the energy cost of running.
Limitations
We have to consider the possibility that present and previous observations of PSF being slightly lower (or similar) than OSF, are subject to methodological problems. Notably, while PSF in session three (165 ± 8 steps min−1) was significantly lower than the OSF (171 ± 8 steps min−1) in the same session, PSF at the equivalent time in session two (167 ± 8 steps min−1) wasn’t significantly lower than OSF. PSF in session three may have been influenced by the imposed SFs in the surrounding blocks and perhaps PSF in session two might better reflect the actual PSF. Although PSF was positively related (p < .05) between sessions two and three (r = 0.88), for some individuals (e.g. 3 and 5 in (B)) PSF differed considerably between both sessions.
It is unfortunate that the cyclist did not succeed in keeping speed perfectly constant. However, it also is understandable, because conditions often were quite windy. Moreover, the effects of the rather trivial speed fluctuations on HR and SF were small ((B)) and we are confident that these did not affect our main conclusions.
There was a small (∼0.8%) significant decline in speed during session two. We think that this also has to be attributed to imperfect pacing of the cyclist, rather than to fatigue of the runners. PSF and OSF have been found to decrease following a fatiguing one hour run (Hunter & Smith, Citation2007), but our participants ran at a comfortable speed for only half an hour and they all completed the session at the 15% higher speed without difficulty. Although the speed decline during the course of session two was small, it may still have contributed to the 1.0 step.min−1 (p < .05) decrease in SF we found.
Continuous registration of wind speed and direction might have resulted in a more accurate description of the wind effects on HR and SF. We did not have enough confidence in our own wind measurements (see Materials and methods) and decided to use the data of a nearby weather station instead.
Practical implications
The out-and-back running protocol with different imposed SFs used here can be easily implemented by individual runners to determine their OSF during outdoor running. Alternatively, they may also run on a treadmill, since the present results combined with our earlier findings (de Ruiter et al., Citation2014) suggest that OSF for outdoor and treadmill running are similar. With both options, we would advise to use the linear correction for HR drift as described in the methods, since it improves the goodness of individual polynomial fits of the SF-HR relations. The present results suggest that PSF for most (but not all) trained recreational runners, is very close to optimal. Less experienced runners, however, may wish to check whether their PSF is close to OSF (de Ruiter et al., Citation2014). Anecdotally, the participant (no. 11) with the greatest deviation between PSF and OSF in the present study, was the only male that did not participate in organized runs.
Importantly, PSF may be affected by surrounding blocks of imposed SFs. Therefore, we advise to establish PSF in a separate session. In addition, running at low SFs like 140 steps min−1, may not be feasible for shorter people running at relatively high speeds, since this requires too long steps. It may be better to adjust the range of imposed SFs to body height and speed, and it may we worthwhile to practice running at different SFs.
In conclusion, individual OSF can be determined from recorded HR and SF during outdoor over-ground running, if an out-and-back protocol is used to minimize the wind effects. Although, and unexpectedly, wind hardly affected SF, it had substantial effects on HR. At two different speeds, experienced recreational runners ran at a PSF slightly, but significantly, below OSF. For most of them, there seemed little to be gained in terms of HR reductions (energy sparing) by increasing their SF to OSF.
Disclosure statement
No potential conflict of interest was reported by the authors.
ORCID
Cornelis J. De Ruiter http://orcid.org/0000-0003-0278-4235
Jaap H. Van Dieën http://orcid.org/0000-0002-7719-5585
Related Research Data
References
- Arsac, L. M., & Locatelli, E. (2002). Modeling the energetics of 100-m running by using speed curves of world champions. Journal of Applied Physiology, 92(5), 1781–1788. doi:10.1152/japplphysiol.00754.2001. Retrieved from https://www.ncbi.nlm.nih.gov/pubmed/11960924
- Cavanagh, P. R., & Kram, R. (1989). Stride length in distance running: Velocity, body dimensions, and added mass effects. Medicine & Science in Sports & Exercise, 21(4), 467–479. Retrieved from http://www.ncbi.nlm.nih.gov/entrez/query.fcgi?cmd=Retrieve&db=PubMed&dopt=Citation&list_uids=2674599
- Cavanagh, P. R., & Williams, K. R. (1982). The effect of stride length variation on oxygen uptake during distance running. Medicine & Science in Sports & Exercise, 14(1), 30–35. Retrieved from http://www.ncbi.nlm.nih.gov/entrez/query.fcgi?cmd=Retrieve&db=PubMed&dopt=Citation&list_uids=7070254
- Chen, T. C., Bundy, D. S., & Hoff, S. J. (1998). Modeling the variation of wind speed with height for agricultural source pollution control. ASHRAE Transactions, 104, 1695–1691.
- Conley, D. L., & Krahenbuhl, G. S. (1980). Running economy and distance running performance of highly trained athletes. Medicine & Science in Sports & Exercise, 12(5), 357–360. Retrieved from https://www.ncbi.nlm.nih.gov/pubmed/7453514
- Constantini, K., Stickford, A. S. L., Bleich, J. L., Mannheimer, P. D., Levine, B. D., & Chapman, R. F. (2018). Synchronizing gait with cardiac cycle phase alters heart rate response during running. Medicine & Science in Sports & Exercise, 50(5), 1046–1053. doi:10.1249/MSS.0000000000001515. Retrieved from https://www.ncbi.nlm.nih.gov/pubmed/29240004
- Daniels, J. (2005). Daniels’ running formula. Champaign, IL: Human Kinetics.
- Davies, C. T. M. (1980). Effects of wind assistance and resistance on the forward motion of a runner. Journal of Applied Physiology, 48(4), 702–709. Retrieved from <Go to ISI>://WOS:A1980JQ57300020
- de Ruiter, C. J., Verdijk, P. W., Werker, W., Zuidema, M. J., & de Haan, A. (2014). Stride frequency in relation to oxygen consumption in experienced and novice runners. European Journal of Sport Science, 14(3), 251–258. doi:10.1080/17461391.2013.783627. Retrieved from https://www.ncbi.nlm.nih.gov/pubmed/23581294
- Elliott, B. C., & Blanksby, B. A. (1979). Optimal stride length considerations for male and female recreational runners. British Journal Sports Medicine, 13, 15–18.
- Folland, J. P., Allen, S. J., Black, M. I., Handsaker, J. C., & Forrester, S. E. (2017). Running technique is an important component of running economy and performance. Medicine and Science in Sports and Exercise, 49(7), 1412–1423. doi:10.1249/Mss.0000000000001245. Retrieved from<Go to ISI>://WOS:000403552100017
- Fulton, T. J., Paris, H. L., Stickford, A. S. L., Gruber, A. H., Mickleborough, T. D., & Chapman, R. F. (2018). Locomotor-respiratory coupling is maintained in simulated moderate altitude in trained distance runners. Journal of Applied Physiology, 125(1), 1–7. doi:10.1152/japplphysiol.01122.2017. Retrieved from https://www.ncbi.nlm.nih.gov/pubmed/29517422
- Heiderscheit, B. C., Chumanov, E. S., Michalski, M. P., Wille, C. M., & Ryan, M. B. (2011). Effects of step rate manipulation on joint mechanics during running. Medicine & Science in Sports & Exercise, 43(2), 296–302. doi:10.1249/MSS.0b013e3181ebedf4. Retrieved from https://www.ncbi.nlm.nih.gov/pubmed/20581720
- Hill, A. V. (1928). The air-resistance to a runner. Proceedings of the Royal Society of London Series B-Containing Papers of a Biological Character, 102(718), 380–384. doi:10.1098/rspb.1928.0012. Retrieved from<Go to ISI>://WOS:000207199900006
- Hunter, I., & Smith, G. A. (2007). Preferred and optimal stride frequency, stiffness and economy: Changes with fatigue during a 1-h high-intensity run. European Journal of Applied Physiology, 100(6), 653–661. doi:10.1007/s00421-007-0456-1. Retrieved from http://www.ncbi.nlm.nih.gov/entrez/query.fcgi?cmd=Retrieve&db=PubMed&dopt=Citation&list_uids=17602239
- Jones, A. M., & Doust, J. H. (1996). A 1% treadmill grade most accurately reflects the energetic cost of outdoor running. Journal of Sports Sciences, 14(4), 321–327. doi:10.1080/02640419608727717. Retrieved from https://www.ncbi.nlm.nih.gov/pubmed/8887211
- Kalis, J. K., Freund, B. J., Joyner, M. J., Jilka, S. M., Nittolo, J., & Wilmore, J. H. (1988). Effect of beta-blockade on the drift in O2 consumption during prolonged exercise. Journal of Applied Physiology, 64(2), 753–758. doi:10.1152/jappl.1988.64.2.753. Retrieved from https://www.ncbi.nlm.nih.gov/pubmed/3372432
- Larsen, H. B. (2003). Kenyan dominance in distance running. Comparative Biochemistry and Physiology Part A: Molecular & Integrative Physiology, 136(1), 161–170. Retrieved from https://www.ncbi.nlm.nih.gov/pubmed/14527638
- Lieberman, D. E., Warrener, A. G., Wang, J., & Castillo, E. R. (2015). Effects of stride frequency and foot position at landing on braking force, hip torque, impact peak force and the metabolic cost of running in humans. Journal of Experimental Biology, 218(Pt 21), 3406–3414. doi:10.1242/jeb.125500. Retrieved from https://www.ncbi.nlm.nih.gov/pubmed/26538175
- Luedke, L. E., Heiderscheit, B. C., Williams, D. S., & Rauh, M. J. (2016). Influence of step rate on shin injury and anterior knee pain in high school runners. Medicine & Science in Sports & Exercise, 48(7), 1244–1250. doi:10.1249/MSS.0000000000000890. Retrieved from https://www.ncbi.nlm.nih.gov/pubmed/26818150
- Luedke, L. E., Heiderscheit, B. C., Williams, D. S. B., & Rauh, M. J. (2018). Factors associated with self-selected step rate in high school cross country runners. Journal of Strength and Conditioning Research, doi:10.1519/JSC.0000000000002891. Retrieved from https://www.ncbi.nlm.nih.gov/pubmed/30335714
- Miller, R. H., Umberger, B. R., Hamill, J., & Caldwell, G. E. (2012). Evaluation of the minimum energy hypothesis and other potential optimality criteria for human running. Proceedings of Biological Sciences/The Royal Society, 279(1733), 1498–1505. doi:10.1098/rspb.2011.2015. Retrieved from https://www.ncbi.nlm.nih.gov/pubmed/22072601
- Morgan, D., Martin, P., Craib, M., Caruso, C., Clifton, R., & Hopewell, R. (1994). Effect of step length optimization on the aerobic demand of running. Journal of Applied Physiology, 77(1), 245–251. Retrieved from http://www.ncbi.nlm.nih.gov/entrez/query.fcgi?cmd=Retrieve&db=PubMed&dopt=Citation&list_uids=7961241
- Morgan, D. W., Martin, P. E., & Krahenbuhl, G. S. (1989). Factors affecting running economy. Sports Medicine, 7(5), 310–330. Retrieved from https://www.ncbi.nlm.nih.gov/pubmed/2662320
- Nassis, G. P., & Geladas, N. D. (2002). Cardiac output decline in prolonged dynamic exercise is affected by the exercise mode. Pflugers Archiv, 445(3), 398–404. doi:10.1007/s00424-002-0935-5. Retrieved from https://www.ncbi.nlm.nih.gov/pubmed/12466943
- Neptune, R. R., & Hull, M. L. (1999). A theoretical analysis of preferred pedaling rate selection in endurance cycling. Journal of Biomechanics, 32(4), 409–415. doi:10.1016/S0021-9290(98)00182-1. Retrieved from <Go to ISI>://WOS:000079499500008
- Pugh, L. G. (1971). The influence of wind resistance in running and walking and the mechanical efficiency of work against horizontal or vertical forces. Journal of Physiology, 213(2), 255–276. Retrieved from https://www.ncbi.nlm.nih.gov/pubmed/5574828
- Saltin, B. (1969). Physiological effects of physical conditioning. Medicine and Science in Sports, 1(1), 50–56.
- Saunders, P. U., Pyne, D. B., Telford, R. D., & Hawley, J. A. (2004). Factors affecting running economy in trained distance runners. Sports Medicine, 34(7), 465–485. Retrieved from https://www.ncbi.nlm.nih.gov/pubmed/15233599
- Snyder, K. L., & Farley, C. T. (2011). Energetically optimal stride frequency in running: The effects of incline and decline. Journal of Experimental Biology, 214(Pt 12), 2089–2095. doi:10.1242/jeb.053157. Retrieved from https://www.ncbi.nlm.nih.gov/pubmed/21613526
- Sproule, J. (1998). Running economy deteriorates following 60 min of exercise at 80% VO2max. European Journal of Applied Physiology and Occupational Physiology, 77(4), 366–371. Retrieved from https://www.ncbi.nlm.nih.gov/pubmed/9562366
- van Ingen Schenau, G. J., Jacobs, R., & de Koning, J. J. (1991). Can cycle power predict sprint running performance? European Journal of Applied Physiology and Occupational Physiology, 63(3–4), 255–260. Retrieved from https://www.ncbi.nlm.nih.gov/pubmed/1761017
- van Oeveren, B. T., de Ruiter, C. J., Beek, P. J., & van Dieen, J. H. (2017). Optimal stride frequencies in running at different speeds. Plos One, 12(10), e0184273. doi:10.1371/journal.pone.0184273. Retrieved from https://www.ncbi.nlm.nih.gov/pubmed/29059198
- Weyand, P. G., Sternlight, D. B., Bellizzi, M. J., & Wright, S. (2000). Faster top running speeds are achieved with greater ground forces not more rapid leg movements. Journal of Applied Physiology, 89(5), 1991–1999. Retrieved from http://www.ncbi.nlm.nih.gov/entrez/query.fcgi?cmd=Retrieve&db=PubMed&dopt=Citation&list_uids=11053354