
 ?Mathematical formulae have been encoded as MathML and are displayed in this HTML version using MathJax in order to improve their display. Uncheck the box to turn MathJax off. This feature requires Javascript. Click on a formula to zoom.
ABSTRACT
Although movement smoothness is considered a hallmark of well-coordinated motor tasks, it is unknown whether markers of movement smoothness can be used to assess the quality of neuromuscular control in athletes. As a first step into this direction, the purpose of this study was to test whether movement smoothness is reduced following a fatiguing lateral shuffle protocol due to fatigue-related adaptations in neuromuscular control. Sixteen healthy adults (7 females) completed a submaximal 3-minute lateral shuffle trial and a maximal fatiguing shuffle trial until task failure. The movement of the pelvis and feet was determined using 3D motion capture at 250 Hz. Movement smoothness was quantified using the log-dimensionless jerk, which represents how often and abruptly the segment acceleration changes over time. Pelvis and foot movement smoothness along with spatiotemporal variables characterizing the shuffling pattern were compared between the beginning and end of the fatiguing shuffle trial using Wilcoxon signed-rank tests (α = 0.05). Pelvis movement smoothness was significantly reduced in all movement directions (p ≤ 0.005, strong effects) while foot movement smoothness was predominantly reduced in the shuffle direction (p ≤ 0.018, moderate to strong effects). Reductions in movement smoothness coincided with a lower peak pelvis speed in shuffle direction (p = 0.007, strong effect) and shorter contact times when changing direction (p = 0.049, moderate effect). These reductions in movement smoothness may be explained by a change in the overall shuffle pattern characterized by “harder” side-cuts as well as by a muscle fatigue-related decline in the ability to precisely plan and execute foot trajectories.
Highlights
We quantified the effect of fatigue on movement smoothness of the pelvis and feet during a lateral shuffling movement based on the cumulative jerk of their movement trajectories
Pelvis and foot movement smoothness was reduced in the fatigued state compared to the non-fatigued state
Reductions in smoothness may be explained by a fatigue-related change of the overall shuffle movement pattern and/or by more frequent corrections of the movement trajectories that become necessary when fatigued
Introduction
“Poor neuromuscular control” is assumed to be one of the most important and modifiable risk factors for non-contact injury in sports (Alentorn-Geli et al., Citation2009; Bahr & Krosshaug, Citation2005). There is, however, no standard method for assessing the quality of neuromuscular control in athletes. This is due to the multi-faceted nature of neuromuscular control combining a number of mechanisms related to motor planning, intersegmental and muscular coordination, sensorimotor integration, and muscle function (Griffin et al., Citation2000). A common approach to investigate neuromuscular control of athletes in clinical biomechanics research is to analyze discrete joint angles and moments of the lower extremities during sport-specific movements such as jump landing or side-cutting (Ford et al., Citation2005; Mclean & Samorezov, Citation2009). If athletes exhibit biomechanical patterns associated with a certain injury mechanism such as large peak knee valgus as a risk factor for ACL injury (Krosshaug et al., Citation2016), they are considered to show “poor neuromuscular control”.
While these assessments have provided valuable insight into potentially dangerous joint movement scenarios, they often neglect the temporal aspect of neuromuscular control, which results from the precisely timed, sequential activation and deactivation of groups of muscles to produce a well-coordinated movement. A hallmark of such well-coordinated movements is that the resulting movement trajectories of the involved segments appear smooth, i.e. with a lack of interruptions or abrupt changes in acceleration (Hogan, Citation1984). Following this definition, movement smoothness is typically quantified by measuring the jerk (first derivative of acceleration) of the segments of interest (Balasubramanian et al., Citation2012; Hogan & Sternad, Citation2009; Yan et al., Citation2000). In this manuscript, we investigate the use of a jerk-based measure for movement smoothness during a sport-specific task to potentially complement the assessment of neuromuscular control in athletes.
In sports, smoother movements have been associated with more proficient neuromuscular control. For example, runners (foot motion), golfers (club head motion), and swimmers (whole-body motion) with a higher skill level produce smoother movement trajectories compared to athletes with lower skill (Choi et al., Citation2014; Ganzevles et al., Citation2019; Hreljac, Citation2000). This observation may be explained by the theory that smooth movement trajectories are advantageous from movement planning, energetic, and injury prevention points of view (Cortes et al., Citation2014; Harris & Wolpert, Citation1998; Hreljac, Citation2000; Kiely et al., Citation2019). Specifically, smooth movement trajectories may be easier to predict for the central nervous system (CNS) (Bobbert & Casius, Citation2011), which in turn enables more precise muscular corrections of the trajectory when deviating from the intended path (Kiely et al., Citation2019). In contrast, less smooth movement trajectories are more difficult to predict and potentially require larger online muscular corrections, which will lead to more signal-dependent noise within the control system and subsequently more variance in the movement outcome (Harris & Wolpert, Citation1998). In sports, precise trajectory planning of the movement endpoint, e.g. the feet, may be important for athletes to ensure safe foot-ground interactions to avoid sprains or falls (Hreljac, Citation2000; Winter, Citation2009). Furthermore, large corrections of pre-planned movement trajectories require muscle activation and thus increase energy cost, especially if correcting the trajectory of segments with large masses such as the pelvis or trunk.
One important difference between the reaching tasks that have mostly informed theories of movement smoothness (Flash & Hogan, Citation1985; Harris & Wolpert, Citation1998) and sportive movements such as running and side-cutting is the influence of the ground reaction force (GRF). Specifically, the GRF induces abrupt changes in the acceleration of body segments making their movement trajectories less smooth. While some athletes may want to reduce large acceleration changes due to the GRF (Bergmann et al., Citation1995; Hreljac, Citation2000), other athletes depend on high loading rates to improve their performance (e.g. when performing a quick side-cutting movement to deceive an opponent in soccer). Thus, in order to investigate movement smoothness as a marker of proficient neuromuscular control in athletes, it may be necessary to distinguish unrestricted motion during flight phases from the motion during ground contact.
One way to experimentally alter neuromuscular control strategies is by exercise-induced fatigue. In the presence of fatigue, the neuromuscular system is challenged by a decline in muscle contractile function (peripheral fatigue) and an impairment in the excitation of motor neurons (central fatigue) (Bigland-Ritchie & Woods, Citation1984; Gandevia, Citation1992). To achieve the movement task despite fatigue, the control system must increase the net neural drive to the involved muscles resulting in a higher muscle excitation to produce the desired muscle force (Viitasalo & Komi, Citation1977) and/or must adapt the movement strategy (Barber-Westin & Noyes, Citation2017). Larger muscle excitations, however, will increase signal-dependent noise and potentially lead to less smooth movement trajectories in the presence of fatigue. Similarly, a change in movement strategy, e.g. stiffer landings from a jump when fatigued (Benjaminse et al., Citation2019), may increase the GRF loading rate and thus reduce movement smoothness of the involved body segments. Furthermore, the force output of individual muscle groups has been shown to become less complex with fatigue, potentially resulting in a reduced ability of the neuromuscular system to appropriately respond to perturbation (Pethick et al., Citation2015). It remains unknown, however, whether variables of movement smoothness are sensitive to these fatigue-related deficits in motor control during complex sport-specific tasks.
The aim of this study was to assess movement smoothness of the pelvis and feet during a fatiguing lateral shuffle and side-cut protocol. This movement task was selected given its common occurrence in team sports and its importance in current neuromuscular control and injury prevention research (Barber-Westin & Noyes, Citation2017; Ben Abdelkrim et al., Citation2007; Bloomfield et al., Citation2007; Boden et al., Citation2009). The following hypotheses were tested:
H1: There is a reduction in movement smoothness of the pelvis and feet during a fatiguing lateral shuffle test when comparing the movements at the beginning and end of the test.
H2: Reductions in movement smoothness throughout a fatiguing lateral shuffle test are larger than the natural variability in smoothness during a submaximal lateral shuffle test.
Methods
Study design and participants
This was an experimental study to compare movement smoothness during a lateral shuffle movement between a non-fatigued and a fatigued state. A convenience sample of 16 healthy adults (9 males, 7 females, students at the University of XXX [added after peer-review]) volunteered to participate in this study. Participants were 25 ± 5 (mean ± SD) years old, 177 ± 15 cm tall, and weighed 70 ± 12.5 kg. All participants indicated to be physically active for a duration of at least 1–5 h per week. 14 out of 16 participants were physically active at least 5 h per week. Participants were free from lower extremity injuries in the last 6 months prior to study participation. This study was approved by the local ethics board of the University of XXX [added after peer-review] (Certificate 70/2019) in accordance with the ethical principles of the Helsinki Declaration. Prior to study participation, all individuals provided written informed consent. Given the novelty of our research question in sports science, a-priori estimation of an expected effect size and corresponding power analysis was not feasible. Instead, a sensitivity analysis (paired t-test, G-Power 3.1.9.7; Faul et al., Citation2007) was performed and indicated that with our sample size of n = 16 and a significance level of alpha = 0.05, only moderate to large effects (Cohen’s d = 0.75) could be detected with the desired power of 0.8. Therefore, small effects detected by this study should be considered preliminary and interpreted carefully.
Experimental protocol
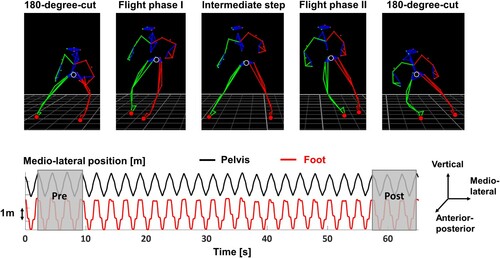
All participants completed one testing session consisting of an initial warm-up followed by a four-part lateral shuffle test. During the warm-up, participants walked and ran on a treadmill for a duration of ten minutes each at their self-selected speed. During each shuffle test part, participants were asked to shuffle back and forth laterally and perform 180 degree side-cutting maneuvers on two marked lines on the floor that were three times their leg length apart. In between the side-cutting maneuvers, all participants used two side steps (two flight phases) to clear the distance between the lines (). During the first test part, participants familiarized with the movement task and tried different shuffling speeds until they were confident to perform the lateral shuffle movement at their maximal pace. For all shuffle trials, participants received the instruction to keep their hands at the side of the body and approximately at hip height. Familiarization took between two to five minutes depending on the participant. In the second part, participants were asked to shuffle as fast as possible for 60 s while the investigator counted the number of completed shuffle cycles C (from one end to the other and back). For the third part, participants shuffled for three minutes at a submaximal speed, i.e. 70% of the average speed achieved during the second test component. The speed was dictated by a metronome at a frequency of 2*C*0.7 beats per minute (bpm) and participants had to match each metronome beat with a 180-degree side-cutting movement. The last test part was the fatiguing shuffle test, for which participants had to shuffle according to a metronome speed of 2*C bpm, thus the average speed of the second component. Participants shuffled until task failure, which was defined as missing two consecutive metronome beats in a row due to exhaustion. Rest periods of at least two minutes were given in between each test part.
Figure 1. Shuffle and side-cut movement task. The top figure shows images of one shuffle cycle in chronological order from left to right. The black and red dots indicate the analyzed pelvis and foot segments, respectively. The bottom figure shows the medio-lateral pelvis and (right) foot position during a fatiguing shuffle trial of one exemplary participant. The grey transparent boxes indicate the shuffle segments at the beginning (pre) and end (post) of the shuffle trial that were used to investigate the effect of fatigue on movement smoothness.
Data collection, processing, and segmentation
During the third (submaximal) and fourth (maximal) shuffle test components, we recorded the participants’ three-dimensional movement patterns using an 8-camera Vicon system with a sample rate of 250 Hz (Vicon Motion Systems Ltd., Oxford, UK). Individuals were equipped with 39 retro-reflective markers according to the Vicon Plug-in Gait full body model. For the current analysis, we analyzed the 3D movement trajectories of the right and left foot based on the right and left toe markers and the 3D movement of the pelvis based on the average of four iliac spine markers in each movement direction (medio-lateral, anterior-posterior, vertical). The marker trajectories were reconstructed and labeled using Vicon Nexus software (v. 2.9.2).
All further data processing was performed according to a custom-written Matlab script (MATLAB R2019b, Natick, MA, US). The position data were filtered using a fourth-order Butterworth low-pass filter where the cut-off frequency was determined according to the residual analysis method described by Winter (Winter, Citation2009). The first derivative (velocity), second derivative (acceleration), and third derivative (jerk) were determined from the position data using the central difference method. Similar to the approach of Hreljac (Hreljac, Citation2000), each new derivative was re-filtered using a second fourth-order Butterworth low-pass filter at a new cut-off frequency, again determined by the residual analysis method before the next derivative was calculated. This filtering procedure resulted in cut-off frequencies of 14–22 Hz for the pelvis position, 22–28 Hz for the foot position, and 30–32 Hz for all velocity, acceleration, and jerk data.
Individual shuffle segments (half a shuffle cycle) were then identified in between the time points when the pelvis velocity in medio-lateral direction was equal to zero, which was equivalent to a a time point about halfway through the ground contact phase of the 180 degree side-cutting maneuver. For the fatiguing shuffle test, we additionally approximated the ground contact and flight phases based on the foot velocities in medio-lateral direction. Specifically, we defined the flight phases of the right and left foot as the time when the respective (absolute) medio-lateral foot velocities were greater than 0.5 m/s (). While this algorithm inherently underestimates the true duration of the flight phase, we selected this method to exclude any influence of impact phenomena on the flight phase analysis.
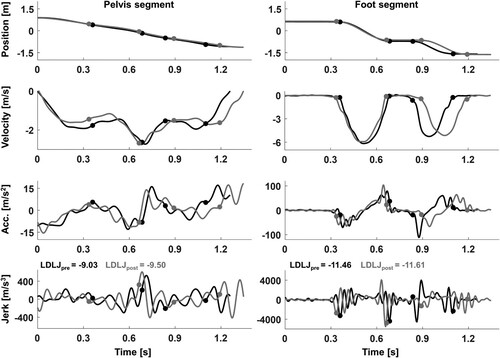
Figure 2. Position, velocity, acceleration (acc.), and jerk for pelvis and (right) foot segment of one exemplary participant during one shuffle segment at the beginning (pre, black) and one segment at the end (post, grey) of the fatiguing trial. The dots indicate the following events in chronological order: first toe-off, first foot-contact, second toe-off, second foot-contact of the right foot. Note, that the shuffle segment at the end of the trial had a slightly longer duration.
Outcome variables
To characterize overall temporal aspects of the shuffle movement, we determined the shuffle segment durations (d) and the peak speed (vp) of the pelvis and feet during each shuffle segment in each of the three movement directions. We additionally approximated the ground contact time of the outer foot during the 180 side-cut based on the end of the previous and start of the subsequent flight phase of the same foot.
Smoothness of the pelvis and foot movement trajectories was quantified for each shuffle segment and each of the three movement directions according to the log-dimensionless jerk (LDLJ, Equationeq. 1(1)
(1) ),
(1)
(1) where j(t) is the third derivative, i.e. the jerk of the pelvis or foot position (), t1 and t2 mark the beginning and end of a particular shuffle segment, d is the shuffle segment duration, and vp the peak pelvis or foot speed. For the separate flight phase analysis, t1 and t2 mark the beginning and end of a particular flight phase during a shuffle segment. In essence, the LDLJ represents the cumulative jerk of a body segment over a time period of interest, indicative of how often and abruptly the segment acceleration changes over time. The variable is normalized by the respective movement duration and peak speed to derive a dimensionless measure that can be compared between individuals (Balasubramanian et al., Citation2012; Hogan & Sternad, Citation2009). Due to the negative sign in Equationequation 1
(1)
(1) , lower LDLJ reflects increased cumulative jerk and thus less smooth movements.
Statistical analysis
Descriptive statistics included medians and interquartile ranges (IQR) for participant information and variables related to the temporal shuffle pattern (shuffle trial duration, shuffle speed, shuffle segment duration, estimated contact time, pelvis peak speed).
The inferential analysis was based on comparing the six shuffle segments at the beginning of a shuffle trial with the six shuffle segments at the end of the same trial. Since the majority of investigated variables were not normally distributed according to a Shapiro–Wilk test, non-parametric tests were used for the inferential analysis. With respect to H1, we performed Wilcoxon signed-rank tests to investigate if the average LDLJ of the pelvis and right and left foot (in three movement directions) was lower at the end of the fatiguing shuffle trial in comparison to the beginning. We determined Rosenthal’s r as an effect size and interpreted effects with r < 0.1 as negligible, 0.1 < r < 0.3 as small, 0.3 < r < 0.5 as moderate, and r > 0.5 as large (Field, Citation2009). A family-wise Bonferroni-correction of the a-priori significance level of alpha = 0.05 was applied such that within each analyzed segment p-values were multiplied by three to account for comparisons in three movement directions. To address H2, we used the submaximal shuffle trial to estimate the natural variability in LDLJ and temporal variables by calculating the minimal detectable change (MDC) (Portney & Watkins, Citation2009). We used the submaximal shuffle trial to determine the MDC because it can give insight into the inherent variability of our outcome variables in the absence of fatigue. In analogy to the analysis above, we determined the MDC based on the average smoothness or temporal variable of the first six shuffle segments in comparison to the last six shuffle segments of the submaximal trial. Observed changes during the fatiguing shuffle trial that exceed the MDC, have a 95% probability to represent a real change rather than noise (Portney & Watkins, Citation2009).
In an additional exploratory analysis, we performed an equivalent analysis as described above to investigate fatigue effects on foot LDLJ variables during the flight phase only as well as on the three temporal variables shuffle segment duration, estimated contact time, and pelvis peak speed. All statistical analyses were conducted using the Statistics and Machine Learning Toolbox in MATLAB (MATLAB R2019b, Natick, MA, US).
Results
The median (IQR) time to exhaustion during the fatiguing shuffle trial was 57(36) s with a median (IQR) shuffle speed of 52(8) bpm (). All descriptive and inferential statistics related to movement smoothness are summarized in Supplementary Table 1.
Table 1. Statistical results for variables related to the overall shuffle pattern. P-values < 0.05 were formatted in bold.
On average, the LDLJ of the pelvis and right and left foot movement trajectories was reduced in all movement directions at the end of the fatiguing shuffle trial compared to the beginning (). This reduction in LDLJ, i.e. reduced movement smoothness, was statistically significant for all movement directions of the pelvis with strong effect sizes (p ≤ 0.005, r ≥ 0.56). The right and left foot showed a significantly reduced LDLJ mostly in medio-lateral direction with large and moderate effect sizes, respectively (right: p = 0.003, r = 0.58; left: p = 0.018, r = 0.48). In the vertical direction, moderate reductions in LDLJ were observed but only reached statistical significance for the left foot (right: p = 0.079, r = 0.39; left: p = 0.039, r = 0.44). Similarly, the small and moderate effects towards a reduction in foot movement smoothness in the anterior-posterior direction were not statistically significant (right: p = 0.443, r = 0.26; left: p = 0.052, r = 0.42). shows that none of the fatigue-related reductions in LDLJ exceeded the minimal detectable changes that were calculated based on the submaximal shuffle trial.
Figure 3. Difference (median, IQR) in the log-dimensionless jerk (LDLJ) between the beginning (pre) and end (post) of the fatiguing shuffle trial for each movement direction [medio-lateral (M-L), anterior-posterior (A-P), vertical (V)]. The left panels show the full shuffle segment analysis for the pelvis, right foot and left foot. The right panels show the flight phase analysis for the right and left foot. Asterisks mark a significant reduction in LDLJ from the beginning to the end of the trial, indicating trajectories with lower smoothness. The red triangles mark the corresponding minimal detectable changes determined from the submaximal shuffle trial.
![Figure 3. Difference (median, IQR) in the log-dimensionless jerk (LDLJ) between the beginning (pre) and end (post) of the fatiguing shuffle trial for each movement direction [medio-lateral (M-L), anterior-posterior (A-P), vertical (V)]. The left panels show the full shuffle segment analysis for the pelvis, right foot and left foot. The right panels show the flight phase analysis for the right and left foot. Asterisks mark a significant reduction in LDLJ from the beginning to the end of the trial, indicating trajectories with lower smoothness. The red triangles mark the corresponding minimal detectable changes determined from the submaximal shuffle trial.](/cms/asset/fa8ed4eb-e594-4f4c-ae2c-c7447bf0deaa/tejs_a_1960427_f0003_oc.jpg)
The secondary analysis of the temporal shuffle pattern showed a significantly reduced medio-lateral peak pelvis speed by 0.11 m/s and reduced contact times by 30 ms (see ). The significant reduction in shuffle segment duration by 20 ms at the end of the fatiguing trial shows that individuals started to slowly miss the metronome beat due to exhaustion. Similar to the full segment analysis, the separate analysis of foot movement smoothness during the flight phase also yielded a trend towards a reduction in smoothness (). Specifically, LDLJ in medio-lateral direction was significantly reduced in the fatigued state for the right foot (p = 0.018, r = 0.48) while the reduction of the left foot was not statistically significant (p = 0.401, r = 0.27).
Discussion
This study investigated adaptations in movement smoothness to fatigue as quantified by the log-dimensionless jerk (LDLJ) of the pelvis and feet during a fatiguing lateral shuffle test. The observed significant reductions in LDLJ from start to end of the fatiguing shuffle trial support our first hypothesis that movement smoothness of the pelvis and feet is reduced during a fatigued state compared to a non-fatigued state. Given that the observed reductions in LDLJ were generally smaller than the corresponding minimal detectable changes (MDCs) refutes our second hypothesis and indicates that the smoothness variables investigated here have low sensitivity.
The LDLJ variable is a cumulative measure for how often and how strongly the acceleration of the investigated body segment changes during a movement (Hogan, Citation1984; Hogan & Sternad, Citation2009). Very few changes of the segment acceleration result in smooth movement trajectories and vice versa. At least two and closely linked neuromuscular adaptations could explain the observed fatigue-related reductions in movement smoothness: (1) Accumulation of central and peripheral fatigue of the leg muscles during sustained exercise forced the neuromuscular system to adopt a new overall shuffling strategy resulting in inherently less smooth movement trajectories. (2) A decline in muscle contractile function over time forced the neuromuscular system to increase the level of muscle excitation for a desired muscle force output. Due to signal-dependent noise (Harris & Wolpert, Citation1998), increased muscle excitation led to less precise movement trajectories and more necessary trajectory corrections, ultimately lowering movement smoothness (Kiely et al., Citation2019).
The reduced peak pelvis speed in shuffle direction and the reduced contact times during the side-cuts indicate that fatigued individuals adopted “harder” cutting maneuvers, i.e. a more abrupt deceleration and subsequent acceleration during the change of direction, to compensate for the inability to maintain high peak shuffle speeds (scenario 1). Following this argument, we would expect an increased jerk of the pelvis segment at the beginning and end of a shuffle segment to explain the observed reduction in pelvis smoothness. We performed a post-hoc analysis to verify this assumption and confirmed that the pelvis trajectories during the acceleration phase (start of shuffle segment to first toe off) were significantly less smooth in all movement directions with moderate to strong effect sizes (p < 0.05, 0.38 < r < 0.58) during the fatigued state. During the deceleration phase (last toe contact to end of shuffle segment), pelvis smoothness was significantly reduced in the anterior-posterior direction (p = 0.026, r = 0.39) but not in the other directions. In consequence, reduced pelvis smoothness during the fatigued state may have predominantly resulted from a more rapid increase in acceleration following the 180-degree side-cut to quickly reach the required average shuffle speed.
The fact that we could also show reduced LDLJ for medio-lateral foot movement during a separate flight phase analysis indicates that increasingly poor trajectory planning and corresponding trajectory corrections (scenario 2) may have contributed to lower movement smoothness during the fatigued state (Kiely et al., Citation2019). Importantly, these reductions in foot movement smoothness cannot be solely explained by impact-related phenomena (Hreljac, Citation2000). Hreljac (Hreljac, Citation2000) reported that trained runners achieved a smoother foot motion path during the running swing phase in comparison to untrained runners and interpreted this as improved intersegmental coordination and more successful translation from movement planning to execution in trained runners (Kiely et al., Citation2019). In our case, lower foot movement smoothness during the shuffle flight phases may be a sign of deteriorating motor control ability with the development of fatigue. Cortes and colleagues (Cortes et al., Citation2014) reached a similar conclusion based on their observation of a less regular ground reaction force profile (higher sample entropy) during a side-stepping task following a fatiguing protocol. While jerk-based movement smoothness and GRF sample entropy are not related from a computational perspective, future studies may target the question whether these measures capture similar or distinct neurophysiological adaptations to fatigue.
Based on these arguments, pelvis smoothness as a sign of “harder” or “softer” side-cutting and foot smoothness as a sign of more or less precise control of the foot trajectories during unrestricted motion, could be potential candidates to (1) assess an athlete’s quality of neuromuscular control during sport-specific tasks, and (2) point towards an increased risk of injury in athletes (Cortes et al., Citation2014; Hreljac, Citation2000; Kiely et al., Citation2019). Furthermore, given recent innovations in wearable sensing, pelvis and foot smoothness of athletes may be monitored on-field during practices or games (Seshadri et al., Citation2019). However, the LDLJ smoothness variables in this study showed low sensitivity when compared to the corresponding minimal detectable changes. While combining temporal and spatial aspects of motor control into one variable may be intriguing, it also presents the challenge that the underlying phenomena are highly variable even in a controlled laboratory shuffle movement like in the current study. Given the large variety of side-cutting speeds and angles that players exhibit during game situations (Taylor, Wright, Dischiavi, Townsend, & Marmon, Citation2017), assessments of movement smoothness on-field will require highly precise activity classification to enable smoothness comparisons. A possible way to improve the sensitivity of LDLJ smoothness variables in the future could be to directly record segment accelerations or rotational velocities with wearable sensors and avoid repeated differentiation to derive jerk (Melendez-Calderon et al., Citation2020).
A limitation of this study was that the analysis did not allow us to comment on the temporal evolution of movement smoothness throughout the fatiguing trial. Although we considered a linear regression approach, visual analysis of the analyzed LDLJ variables over time suggested a non-linear behaviour of movement smoothness for a few individuals thus not justifying a linear statistical model. Furthermore, we did not quantify the level of peripheral or central fatigue in this study. Given the short duration (∼1 min) and maximal intensity of our shuffle trial to exhaustion, however, task failure was most likely due to the accumulation of peripheral fatigue that eventually led to a decline in supraspinal drive to the muscles to protect from further peripheral fatigue (Gandevia, Citation2001). Consequently, our results may not generalize to longer, submaximal movement protocols where central fatigue has a potentially larger impact on neuromuscular control (Goodall et al., Citation2017). In addition, residual muscle fatigue may have been present in some participants when starting the fatiguing shuffle trial due to the previous two shuffle trials, which would likely lead to underestimated effect sizes in this study. This limitation, however, only applies to a small number of participants given that the median duration of the fatiguing shuffle trail (57 s) was almost equal to the one-minute maximal shuffle trial at the beginning of the protocol. Finally, digital filtering settings can have a significant influence on the magnitude of LDLJ variables and thus their sensitivity (Balasubramanian et al., Citation2015). Besides the residual analysis method to determine optimal low-pass filter frequencies described above, we did re-analyze all outcome variables using a lower cut-off frequency of 10 Hz. This analysis yielded comparable reductions in movement smoothness but did not improve sensitivity and thus we assume that filtering settings had a minor influence on our conclusions.
Conclusion
There are fatigue-related reductions in movement smoothness, i.e. an increased cumulative jerk of the pelvis and feet when individuals perform a lateral shuffle and side-cut protocol to exhaustion. These reductions in movement smoothness may be explained by a change in the overall shuffle pattern characterized by “harder” side-cuts as well as by a muscle fatigue-related decline in the ability to precisely plan and execute foot trajectories. Nevertheless, we found jerk-based smoothness variables to show low sensitivity in this shuffling protocol, which must be overcome before the implementation of smoothness-based markers of neuromuscular control become viable in sports practice and on-field.
Supplemental Material
Download MS Word (16 KB)Disclosure statement
No potential conflict of interest was reported by the author(s).
References
- Alentorn-Geli, E., Myer, G. D., Silvers, H. J., Samitier, G., Romero, D., Lázaro-Haro, C., & Cugat, R. (2009). Prevention of non-contact anterior cruciate ligament injuries in soccer players. Part 1: Mechanisms of injury and underlying risk factors. Knee Surgery, Sports Traumatology, Arthroscopy, 17, 705–729.
- Bahr, R., & Krosshaug, T. (2005). Understanding injury mechanisms: A key component of preventing injuries in sport. British Journal of Sports Medicine, 39, 324–329.
- Balasubramanian, S., Melendez-Calderon, A., & Burdet, E. (2012). A robust and sensitive metric for quantifying movement smoothness. IEEE Transactions on Biomedical Engineering, 59, 2126–2136.
- Balasubramanian, S., Melendez-Calderon, A., Roby-Brami, A., & Burdet, E. (2015). On the analysis of movement smoothness. Journal of Neuro Engineering and Rehabilitation, 12(112), 1–11.
- Barber-Westin, S. D., & Noyes, F. R. (2017). Effect of fatigue protocols on lower limb neuromuscular function and implications for anterior cruciate ligament injury prevention training: A systematic review. The American Journal of Sports Medicine, 45, 3388–3396.
- Ben Abdelkrim, N., El Fazaa, S., El Ati, J., & Tabka, Z. (2007). Time-motion analysis and physiological data of elite under-19-year-old basketball players during competition. British Journal of Sports Medicine, 41, 69–75.
- Benjaminse, A., Webster, K. E., Kimp, A., Meijer, M., & Gokeler, A. (2019). Revised approach to the role of fatigue in anterior cruciate ligament injury prevention: A systematic review with meta-analyses. Sports Medicine, 49, 565–586.
- Bergmann, G., Kniggendorf, H., Graichen, F., & Rohlmann, A. (1995). Influence of shoes and heel strike on the loading of the hip joint. Journal of Biomechanics, 28, 817–827.
- Bigland-Ritchie, B., & Woods, J. J. (1984). Changes in muscle contractile properties and neural control during human muscular fatigue. Muscle & Nerve, 7, 691–699.
- Bloomfield, J., Polman, R., & O’Donoghue, P. (2007). Physical demands of different positions in FA premier league soccer. Journal of Sports Science and Medicine, 6, 63–70.
- Bobbert, M. F., & Casius, L. J. R. (2011). Spring-like leg behaviour, musculoskeletal mechanics and control in maximum and submaximum height human hopping. Philosophical Transactions of the Royal Society B: Biological Sciences, 366, 1516–1529.
- Boden, B. P., Torg, J. S., Knowles, S. B., & Hewett, T. E. (2009). Video analysis of anterior cruciate ligament injury: Abnormalities in hip and ankle kinematics. The American Journal of Sports Medicine, 37, 252–259.
- Choi, A., Joo, S.-B., Oh, E., & Mun, J. H. (2014). Kinematic evaluation of movement smoothness in golf: Relationship between the normalized jerk cost of body joints and the clubhead. BioMedical Engineering OnLine, 13(20), 1–12.
- Cortes, N., Onate, J., & Morrison, S. (2014). Differential effects of fatigue on movement variability. Gait & Posture, 39, 888–893.
- Faul, F., Erdfelder, E., Lang, A.-G., & Buchner, A. (2007). G*power 3: A flexible statistical power analysis program for the social, behavioral, and biomedical sciences. Behavior Research Methods, 39, 175–191.
- Field, A. P. (2009). Discovering statistics using SPSS: (and sex, drugs and rock “n” roll). London, UK: SAGE Publications.
- Flash, T., & Hogan, N. (1985). The coordination of arm movements: An experimentally confirmed mathematical model. The Journal of Neuroscience, 5, 1688–1703.
- Ford, K. R., Myer, G. D., Toms, H. E., & Hewett, T. E. (2005). Gender differences in the kinematics of unanticipated cutting in young athletes. Medicine & Science in Sports & Exercise, 37, 124–129.
- Gandevia, S. C. (1992). Some central and peripheral factors affecting human motoneuronal output in neuromuscular fatigue. Sports Medicine, 13, 93–98.
- Gandevia, S. C. (2001). Spinal and supraspinal factors in human muscle fatigue. Physiological Reviews, 81, 1725–1789.
- Ganzevles, S. P. M., Beek, P. J., Daanen, H. A. M., Coolen, B. M. A., & Truijens, M. J. (2019). Differences in swimming smoothness between elite and non-elite swimmers. Sports Biomechanics, 1–14. doi:10.1080/14763141.2019.1650102
- Goodall, S., Thomas, K., Harper, L. D., Hunter, R., Parker, P., Stevenson, E., West, D., Russell, M., & Howatson, G. (2017). The assessment of neuromuscular fatigue during 120 min of simulated soccer exercise. European Journal of Applied Physiology, 117, 687–697.
- Griffin, L. Y., Agel, J., Albohm, M. J., Arendt, E. A., Dick, R. W., Garrett, W. E., Garrick, J. G., Hewett, T. E., Huston, L., Ireland, M. L., Johnson, R. J., Kibler, W. B., Lephart, S., Lewis, J. L., Lindenfeld, T. N., Mandelbaum, B. R., Marchak, P., Teitz, C. C., & Wojtys, E. M. (2000). Noncontact anterior cruciate ligament injuries: Risk factors and prevention strategies. JAAOS - Journal of the American Academy of Orthopaedic Surgeons, 8, 141.
- Harris, C. M., & Wolpert, D. M. (1998). Signal-dependent noise determines motor planning. Nature, 394, 780–784.
- Hogan, N. (1984). An organizing principle for a class of voluntary movements. The Journal of Neuroscience, 4, 2745–2754.
- Hogan, N., & Sternad, D. (2009). Sensitivity of smoothness measures to movement duration, amplitude, and arrests. Journal of Motor Behavior, 41, 529–534.
- Hreljac, A. (2000). Stride smoothness evaluation of runners and other athletes. Gait & Posture, 11, 199–206.
- Kiely, J., Pickering, C., & Collins, D. J. (2019). Smoothness: An unexplored window into coordinated running proficiency. Sports Medicine - Open, 5(43), 2–9.
- Krosshaug, T., Steffen, K., Kristianslund, E., Nilstad, A., Mok, K.-M., Myklebust, G., Andersen, T. E., Holme, I., Engebretsen, L., & Bahr, R. (2016). The vertical drop jump is a poor screening test for ACL injuries in female elite soccer and handball players: A prospective cohort study of 710 athletes. The American Journal of Sports Medicine, 44, 874–883.
- Mclean, S. G., & Samorezov, J. E. (2009). Fatigue-Induced ACL injury risk stems from a degradation in central control. Medicine & Science in Sports & Exercise, 41, 1661.
- Melendez-Calderon, A., Shirota, C., & Balasubramanian, S. (2020). Estimating movement smoothness from inertial measurement units. Frontiers in Bioengineering and Biotechnology, 8, 558771.
- Pethick, J., Winter, S. L., & Burnley, M. (2015). Fatigue reduces the complexity of knee extensor torque fluctuations during maximal and submaximal intermittent isometric contractions in man. The Journal of Physiology, 593, 2085–2096.
- Portney, L. G., & Watkins, M. P. (2009). Foundations of clinical research: Applications to practice. Upper Saddle River, NJ, USA: Pearson/Prentice Hall.
- Seshadri, D. R., Li, R. T., Voos, J. E., Rowbottom, J. R., Alfes, C. M., Zorman, C. A., & Drummond, C. K. (2019). Wearable sensors for monitoring the internal and external workload of the athlete. NPJ Digital Medicine, 2(71). doi:10.1038/s41746-019-0149-2
- Taylor, J. B., Wright, A. A., Dischiavi, S. L., Townsend, M. A., & Marmon, A. R. (2017). Activity demands during multi-directional team sports: A systematic review. Sports Medicine, 47, 2533–2551.
- Viitasalo, J. H., & Komi, P. V. (1977). Signal characteristics of EMG during fatigue. European Journal of Applied Physiology and Occupational Physiology, 37, 111–121.
- Winter, D. A. (2009). Biomechanics and motor control of human movement. Hoboken, NJ, USA: Wiley.
- Yan, J. H., Hinrichs, R., Gregory Payne, V., & Thomas, J. R. (2000). Normalized jerk: A measure to capture developmental characteristics of young girls’ overarm throwing. Journal of Applied Biomechanics, 16, 196–203.