
ABSTRACT
A low-frequency to a high-frequency component ratio (LF/HF) in heart rate variability (HRV) may not accurately reflect sympathetic nervous activity during exercise. Thus, a valid HRV-based index of sympathetic nervous activity is needed. Therefore, the heart rate to LF ratio (Heart rate/LF) was evaluated as sympathetic nervous activity index which is reflected by catecholamine levels during incremental exercise. In this study, 15 healthy adults performed an incremental exercise test using a cycle ergometer. HRV was derived from electrocardiography and HRV components related to the autonomic nervous system were obtained using frequency analysis. Heart rate/LF was calculated using the heart rate and LF component produced by HRV analysis. Catecholamine, blood lactate levels and respiratory gas were also measured throughout the exercise test. While LF/HF did not increase with increasing exercise intensity, Heart rate/LF non-linearly increased during the incremental exercise test, as did noradrenaline and blood lactate. Interestingly, Heart rate/LF values were positively correlated with noradrenaline (ρ = 0.788, p < 0.05) and blood lactate (ρ = 0.802, p < 0.05) levels and carbon dioxide production (ρ = 0.903, p < 0.05) from at rest through the exercise stages. Heart rate/LF reflects sympathetic nervous activity and metabolic responses during incremental cycling exercise and has potential as an HRV index of sympathetic nervous activity during exercise.
Trial registration: UMIN Japan identifier: UMIN000039639.
Introduction
Exercise induces activation of the sympathetic nervous system followed by catecholamine induction, which is reported to non-linearly increase during incremental exercise (Mazzeo & Marshall, Citation1989). In addition, exercise significantly changes metabolic responses to meet the increased requirements of energy and oxygen (Sales et al., Citation2019). Previous studies have determined that blood lactate accumulation and respiratory gas exchange can change non-linearly (Mazzeo & Marshall, Citation1989; Wasserman, Whipp, Koyal, & Beaver, Citation1973). The breakpoints of each of these parameters have been identified as the lactate threshold (LT) and ventilatory threshold (VT), respectively, and these measurements provide a useful tool in the assessment of metabolic demands and activation of the sympathetic nervous system during exercise. Although these measurements are widely used in fitness training and cardiac rehabilitation (Hansen, Stevens, Eijnde, & Dendale, Citation2012), blood lactate measurement requires invasive blood sampling, and the equipment required for respiratory gas measurement is expensive.
Heart rate variability (HRV) is an established noninvasive index of autonomic nervous activity. HRV, which refers to variation in the duration of the R–R interval obtained by electrocardiography, is quantified via frequency analysis as a high-frequency component (HF) that reflects parasympathetic activity and a low-frequency component (LF) that reflects both parasympathetic and sympathetic activities (Berntson et al., Citation1997). HRV can be measured in the resting state and during exercise (Kiviniemi, Hautala, Kinnunen, & Tulppo, Citation2007; Shiraishi et al., Citation2018). Additionally, HRV has been considered as an alternative tool for blood lactate and respiratory gas measurements to estimate LT and VT (Cottin et al., Citation2006; Karapetian, Engels, & Gretebeck, Citation2008; Shiraishi et al., Citation2018).
The LF to HF ratio (LF/HF) in HRV is widely used as an indicator of sympathetic nervous modulation (Pagani et al., Citation1986). However, the results of previous studies regarding changes in LF/HF during exercise have been inconsistent. While LF/HF has been reported to increase above VT (Yamamoto, Hughson, & Peterson, Citation1991), several studies have indicated that LF/HF does not change or decrease with exercise (Arai et al., Citation1989; Leicht, Sinclair, & Spinks, Citation2007; Polanczyk et al., Citation1998). In addition, LF/HF reportedly does not increase even with catecholamine infusion at rest (Ahmed et al., Citation1994; Breuer et al., Citation1993). Accordingly, LF/HF may not be suitable for the evaluation of sympathetic activation during exercise. Thus, a valid HRV-based index of sympathetic activity during exercise is needed.
Heart rate (HR) levels during exercise are determined by the interplay between sympathetic and parasympathetic nervous activity. As exercise intensity increases, the dominance of autonomic nervous activity is shifted from parasympathetic to sympathetic nervous activity, and HR linearly increase, which is considered to be caused by baroreflex resetting (Raven, Fadel, & Ogoh, Citation2006; White & Raven, Citation2014). The baroreflex efferents are mediated through both sympathetic and parasympathetic nervous signals, which can influence the LF component of HRV (Berntson et al., Citation1997). Moreover, the LF component is reported to be more strongly influenced by parasympathetic activity than sympathetic activity (Randall, Brown, Raisch, Yingling, & Randall, Citation1991). Therefore, we hypothesized that changes in HR that are corrected by the LF components could reflect sympathetic nervous activation by showing the relative decrease in the ability of the parasympathetic nervous system to modulate HR by baroreflex resetting during exercise. The current study aimed to determine whether changes in the HR to LF ratio (Heart rate/LF) reflect sympathetic activation during exercise.
Methods
Study approval and consent
The study protocol was approved by the Ethics Committee of Fukuoka University (approval no. 17-10-05) (UMIN Clinical Trials Registry number, UMIN000039639) and was performed in accordance with the guidelines for Medical Research Involving Human Subjects as described in the Declaration of Helsinki. All participants were informed of the methods and potential risks associated with this study and provided written informed consent.
Participants
In total, 15 healthy adults (seven males and eight females, mean age = 21.2 ± 1.0 years, mean height = 165.6 ± 7.8 cm, mean weight = 57.6 ± 6.3 kg, mean body mass index = 21.0 ± 1.4) were recruited for incremental exercise testing. Individuals with severe or progressive medical disorders, restrictions regarding exercise, those who currently took alpha- or beta-blockers, and those who were smokers, were excluded from this test. Moreover, no participants took antidepressant or antipsychotic medication. Alcohol consumption was below 2 days per week in all participants. Twelve participants reported exercising more than three times per week. All participants were asked to avoid drinking alcohol, consuming caffeine or doing rigorous exercise the day before the exercise test, and to fast, with the exception of water, for 2–3 h before the test.
Incremental exercise test
The incremental exercise test was performed between 9 am and 5 pm using a cycle ergometer (AEROBIKE 75XL III; Konami Wellness, Tokyo, Japan; Corival cpet, Lode BV, Groningen, the Netherlands). Upon arrival to our laboratory, a venous catheter was placed in the cubital vein and was filled with physiological saline until blood collection. Participants rested for 30 min prior to the incremental exercise test. After a 1–4 min rest on the ergometer, the participants pedaled at 10 W for 4 min as a warm-up. The exercise load was then gradually increased by 10-W (female) or 20-W (male) increments every minute until the participant reached the point of exhaustion. Participants were instructed to maintain a pedaling frequency of 60 rpm, and when the pedaling rate fell below 50 rpm, the test was declared finished. At the end of the test, participants were instructed to pedal at 10 W until HR stabilized. The temperature of the two rooms in which the exercise test was performed was constantly maintained at 23–24°C, and humidity was within 30–60%. The light level in each of the two rooms was 635 or 878 lx when measured at 2 m high from ceiling light source vertically.
Blood lactate measurement and determination of LT
Blood lactate was measured at rest before the exercise test and at the end of every 30-s period (20-W increments) or 1-min (10-W increments) period until it reached 4 mmol/L, as well as at 3 min after the end of the exercise test using a Lactate Pro 2 metre (LT-1730; Arkray Inc., Kyoto, Japan). LT, defined as the breakpoint of lactate concentration (Faude, Kindermann, & Meyer, Citation2009; Kiyonaga, Arakawa, Tanaka, & Shindo, Citation1985), was determined by five technicians via visual inspection of graphical plots of lactic acid versus workload. Following the exclusion of maximum and minimum LT values, the remaining three LT values were averaged.
Respiratory gas measurement and determination of VT
To evaluate oxygen uptake and VT, respiratory gas was continuously measured during the incremental exercise test using the mixing chamber method. The expired gas volume and respiratory rate were measured independently using a flow sensor with a mixing chamber. The expired gas was collected in the mixing chamber (4-L capacity) using a mouthpiece or mask via a corrugated tube. The sample gas was analyzed using a mass spectrometer (ARCO-2000; Arco System, Chiba, Japan) and oxygen uptake (VO2), carbon dioxide production (VCO2), and respiratory quotient (RQ) were automatically calculated every 12-s (Hirano et al., Citation2014). Five technicians assessed the VT via visual inspection of graphical plots of VO2 versus VCO2 plotted using the V-slope method (Beaver, Wasserman, & Whipp, Citation1986). After excluding the maximum and minimum values, the remaining three VT values were averaged.
HRV measurement
Electrocardiogram in the incremental exercise test (include at rest period) was collected with a 3-lead system with a sampling rate of 1000 Hz using an HRR-01 (Ahm electronics, Tokyo, Japan). Electrocardiogram recording in the exercise test was conducted from the rest period until the end of the exercise test for each participant (minimum; 14 min 44 s, maximum; 25 min 2 s). R–R intervals were calculated using “Reflex-Meijin” software (Crosswell, Yokohama, Japan). The spectral analysis was used “Memcalc/Win” software (GMS, Tokyo, Japan). Before the spectral densities analysis, the following types of artifacts and abnormal beats were excluded from the R–R data by Memcalc/Win: (1) HR was below 30 bpm and above 220 bpm, (2) outlier which was detected by comparing adjacent R–R data, (3) the validity was not certified among the successive three R–R data. The analysis of power spectral densities was calculated using a combination of the maximum entropy method (MEM) for spectral analysis and the non-linear least squares method for fitting analysis, in accordance with methods reported in a previous study (Sahara et al., Citation1996; Sawada et al., Citation1997). The length of data to analyze power spectral densities was set at 90 s and the interval of each spectral analysis was 2 s. Briefly, the first spectral density was calculated from the time at which the first R–R interval was obtained to 90 s, and the next was calculated for 90 s from 2 s after the time at which the first R–R interval, and so on until the end time of the exercise test. The LF band was set at 0.04–0.15 Hz. In this study, the HF band was set at 0.15–0.83 Hz to include the effects of respiratory rate from rest until high exercise intensity period and exclude cycling components. Additionally, Heart rate/LF and LF/HF were calculated using the obtained LF, HF and HR data from the frequency analysis, respectively. The control of respiratory depth and frequency was not required in both the rest and exercise periods.
Blood sample collection and hormonal analysis
Venous samples were continuously collected from the catheter every minute during the exercise test, centrifuged at 3,500 rpm for 15 min at 4°C, and stored at −80°C until analysis. Plasma catecholamine and dopamine concentrations were analyzed by two commercial blood analysis companies (SRL Inc., Tokyo, Japan; LSI Medience Corporation, Tokyo, Japan).
Statistical analysis
According to a previous study (Shiraishi et al., Citation2018), a sample size of nine participants was needed for the trial for power of 80% and a two-sided alpha value of 0.05. Descriptive data were presented as the mean ± standard deviation (SD). Prior to analysis, the normality of the data was tested using the Kolmogorov–Smirnov statistic; regarding non-normally distributed data, the median value was analyzed using non-parametric tests. The Friedman test was used to compare the physiological parameters and HRV components during the rest, LT, VT, and exhaustion periods. Multiple comparisons were performed using the Wilcoxon rank-sum test as a post-hoc test. R–R interval values were compared using repeated-measures one-way analysis of variance (ANOVA). Equality of variance was confirmed using the Greenhouse-Geisser correction and multiple comparisons were performed using the Bonferroni test. There were some missing data in the blood lactate values in VT (n = 14) and HRV components (LF, HF, Heart rate/LF, LF/HF) at exhaustion (n = 14). Comparisons between at rest and each relative workload in the HRV components and physiological parameters were performed using the Friedman test together with the Wilcoxon rank-sum test as a post-hoc test. HR and VO2 were performed using repeated-measures one-way ANOVA and multiple comparisons were performed using Dunnett’s test. There were some missing data in the blood lactate (n = 14–15), adrenaline (n = 10–12), noradrenaline values (n = 10–12) and HRV components (n = 14–15) in the part of some relative exercise intensities. In all analyses, pairs with missing data were excluded in each test. Spearman’s rank correlation coefficient was calculated from the logarithmic (log) values. The analysis was performed using the data points collected until the blood lactate level reached 4 mmol/L as plasma catecholamine could not be sampled around the end of the exercise test in most participants. A two-sided probability (p) value of < 0.05 was considered statistically significant. Statistical analyses were then performed using IBM SPSS Statistics for Windows, version 23.0 (IBM Corporation, Armonk, NY, USA).
Results
Representative data of the HRV components
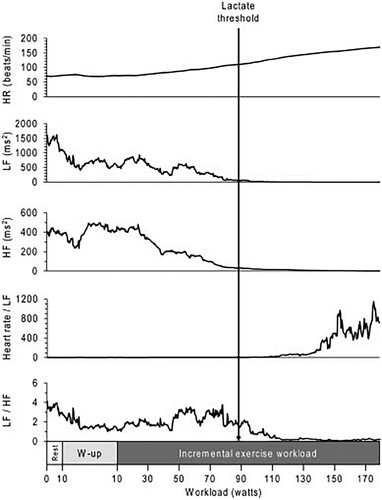
Representative data of a 21-year-old female who habitually exercised more than three times per week were shown in . This participant’s HR linearly increased as exercise workload increased. The LF and HF components of HRV gradually decreased after beginning the exercise, and both components were maintained at low levels after LT had been reached. LF/HF, a traditional index of sympathetic nerve activity, was observed to decrease rather than increase after LT had been reached. In contrast, Heart rate/LF was maintained at a low level until LT was reached, then clearly increased above LT.
Figure 1. Representative data during an incremental exercise test in a female participant. The white box indicates the rest period. The gray box indicates the warm-up period, during which the participant cycled at 10 W. The black box indicates the period of 10-W incremental increases in exercise workload every minute until exhaustion. The black arrow indicates the workload at the LT. HF, high-frequency component; HR, heart rate; LF, low-frequency component; W-up, warm-up.
Changes from at rest until exhaustion
⩒O2, blood lactate, respiratory rate, and HR were observed to increase at LT and VT compared with the values at rest, and had further increased at the point of exhaustion. The R–R intervals, LF and HF decreased at LT and VT compared with values at rest, and further decreased at exhaustion but HF was no difference between LT and exhaustion. Heart rate/LF increased at LT and VT compared with values at rest and significantly increased at the point of exhaustion. LF/HF values at rest were not different with LT and VT, but it at exhaustion were lower than values at LT and VT. Furthermore, no differences were noted in the values of any parameters between LT and VT ().
Table 1. Physiological parameters and heart rate variability components in each stage during the incremental exercise test.
Changes before and after LT
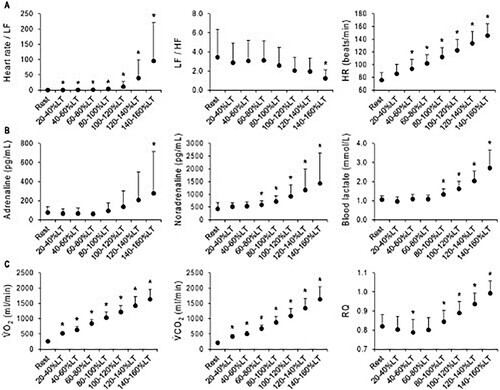
Comparisons in HRV and physiological parameters at rest and each relative workload intensity are shown in . Compared with values at rest, Heart rate/LF increased above 20–40% LT. In contrast, the LF/HF value decreased at 140–160% LT. HR increased above 40–60% LT. Noradrenaline increased above 60–80% LT and Adrenaline increased at 140–160% LT. The blood lactate value increased above 80–100% LT. VO2 and VCO2 increased at all relative workloads. RQ decreased at 40–60% LT but increased above 80–100% LT. The log data of are shown in Figure S1.
Figure 2. Changes in HRV components and physiological parameters before and after reaching the LT. Data are shown the mean ± SD. A, HRV components (Heart rate/LF, n = 14–15; LF/HF, n = 14–15) and HR (n = 15). B, Blood parameters (adrenaline, n = 10–12; noradrenaline, n = 10–12; blood lactate, n = 14–15). C, Respiratory gas parameters (⩒O2, n = 15; ⩒CO2, n = 15; RQ, n = 15). The relative intensity of workload with respect to the LT is shown in the horizontal axis. The obtained values were averaged as percentage ranges. *p < 0.05 at rest vs. each relative intensity. HF, high-frequency component; HR, heart rate; LF, low-frequency component; LT, lactate threshold; RQ, respiratory quotient; ⩒O2, oxygen uptake; ⩒CO2, carbon dioxide production.
Relationship between HRV components and physiological parameters
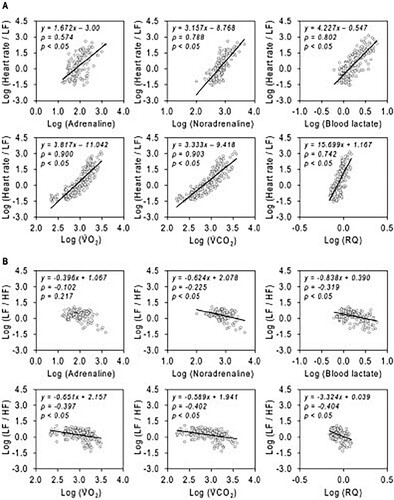
Log Heart rate/LF was found to be strongly correlated with log noradrenaline, log blood lactate, log ⩒O2, log ⩒CO2 and log RQ, and moderately correlated with log adrenaline. Meanwhile, log LF/HF was negatively correlated with log noradrenaline, log blood lactate, log ⩒O2, log ⩒CO2, and log RQ, but was not correlated with log adrenaline (). The correlations between the blood samples and respiratory gas parameters are shown in Figure S2. Furthermore, the correlations between HR, Heart rate/LF and physiological parameters are shown in Figures S3 and S4. The correlations in individual amounts of change are shown in Figure S5.
Figure 3. Correlations between HRV components and physiological parameters. All data are the values from at rest to until the blood lactate reached 4 mmol/L. All data are presented as logarithms (log). (A) The correlation between Heart rate/LF and blood, respiratory gas parameters. (B) The correlation between LF/HF and blood, respiratory gas parameters. HF, high-frequency component; HR, heart rate; LF, low-frequency component; RQ, respiratory quotient; ⩒O2, oxygen uptake; ⩒CO2, carbon dioxide production.
Discussion
The current findings revealed that Heart rate/LF non-linearly increased during incremental exercise along with noradrenaline and metabolic parameters, in contrast to LF/HF. In addition, Heart rate/LF was strongly correlated with noradrenaline and metabolic parameters from rest throughout the exercise stages, indicating that Heart rate/LF reflects sympathetic nervous activation during exercise. Thus, Heart rate/LF may provide as an index of sympathetic nervous activity in HRV.
LF/HF did not increase during incremental exercise, in contrast with noradrenaline elevation ( and Figure S1). Furthermore, LF/HF and noradrenaline exhibited a weak negative correlation (), suggesting that LF/HF does not necessarily reflect sympathetic nervous activity during exercise. This finding is consistent with the results of previous studies reporting that LF/HF did not increase during exercise (Arai et al., Citation1989; Leicht et al., Citation2007; Polanczyk et al., Citation1998). One possible explanation for this finding is that LF is more strongly influenced by parasympathetic nervous activity than sympathetic nervous activity, whereas HF is only influenced by parasympathetic nervous activity (Berntson et al., Citation1997; Randall et al., Citation1991). The key point is that parasympathetic nervous activity during exercise decreases along with increasing exercise intensity (Gourine & Ackland, Citation2019; Robinson, Epstein, Beiser, & Braunwald, Citation1966; White & Raven, Citation2014). The decrease in both LF and HF due to the reduction in parasympathetic nervous activity may be one of the reasons LF/HF does not increase during exercise. In addition, previous studies reported a unique exponential decay-like relationship between HRV and HR (Monfredi et al., Citation2014; Sacha, Citation2013). Therefore, we also speculated that the decrease at the same level in both the LF and HF components was caused by both frequency components in HRV being equally affected by the HR increase itself.
In contrast to LF/HF, Heart rate/LF increased during incremental exercise. Heart rate/LF below the LT point increased compared with that at rest, but the range of the increase was small ( and Figure S1). In contrast, Heart rate/LF rapidly and non-linearly increased above the LT level as well as catecholamine (). In addition, Heart rate/LF was strongly positively correlated with catecholamine, particularly noradrenaline (). These results indicate that Heart rate/LF reflects sympathetic nervous activation during exercise. The LF component of HRV is influenced by the baroreflex efferents which are mediated through both sympathetic and parasympathetic nervous signals. However, the LF component might be more strongly influenced by parasympathetic nervous activity than sympathetic nervous activity (Randall et al., Citation1991). Therefore, during the LT and VT periods from the start of exercise, the LF component decreased (). In contrast, there was no difference in noradrenaline until 60–80% LT compared with values at rest, but HR was observed to increase (). This result suggests that the increase in HR until around LT and VT was mainly due to reduced parasympathetic nervous activity. Therefore, Heart rate/LF might have been slightly increased until around LT and VT. Above LT and VT, the decrease in the LF component was slight, while HR continued to increase (). In contrast to LF components, noradrenaline was found to increase above 60–80% LT (). These increases of catecholamine above LT are consistent with the findings of several previous studies (Mazzeo & Marshall, Citation1989; Schneider, Mclellan, & Gass, Citation2000). Therefore, an increase in HR past LT and VT might be mainly attributed to sympathetic nervous activation. Consequently, although the changes in Heart rate/LF were statistically significant at all relative intensity levels compared with the rest period, these Heart rate/LF changes were similar to the non-linear changes in catecholamine during exercise, potentially reflecting sympathetic nervous activation. Furthermore, LF may be superior to HF for HR correction because the respiratory reflex is very likely to be influenced by spontaneous breathing during exercise, while the baroreceptor reflex is difficult to control voluntarily.
HR is strongly influenced by sympathetic nervous activation at higher workloads (White & Raven, Citation2014). However, HR showed slight linear changes depending on exercise intensity, in contrast with catecholamine (). Moreover, the slope of regression line of HR against catecholamine above LT was very small (Figure S4 B), meaning that the range of HR values was very narrow against a catecholamine change. Although the correlation coefficient of HR and Heart rate/LF with catecholamine was similar, it may be difficult to detect an exponential change in sympathetic nervous activity during exercise using HR alone.
Several previous studies have indicated that HRV is primarily dependent on HR (Monfredi et al., Citation2014; Sacha, Citation2013). Based on these findings, for standardizing and normalizing HRV, HRV indices corrected by mean R-R intervals or HR has been proposed (Bailón et al., Citation2011; J. Hayano et al., Citation1990; Junichiro Hayano et al., Citation1991; Hernando et al., Citation2018). LF component corrected by mean HR was indicated to increase in phase moderate exercise intensity and decrease during moderate to high exercise intensity (Hernando et al., Citation2018). That index would not indicate sympathetic nerve activity increases, may be not useful for the evaluation of sympathetic nervous activation specifically caused by incremental exercise. In contrast, the purpose of the present study was to assess sympathetic nervous activation during exercise using HRV, and HR corrected by LF component of HRV was indicated the specifical activation in sympathetic nervous system during exercise. Therefore, we considered that Heart rate/LF was a different concept compared to the HRV corrected by mean HR, and it may be more beneficial in the evaluation of sympathetic nervous activation than HRV indices corrected by mean HR.
Blood lactate and respiratory gas analyses have been widely used to assess physical fitness and exercise intensity in exercise prescription and fitness training. Given that such measurements are invasive and expensive, more practical evaluation methods that are comparatively less invasive, less expensive, and more convenient are needed. Thus, HRV measurement has been identified as a potential practical method. In the present study, Heart rate/LF was found to be strongly correlated with blood lactate and respiratory gas parameters, as with noradrenaline (). Therefore, Heart rate/LF provides a potential noninvasive and inexpensive parameter for estimating metabolic responses during exercise, and HRV measurement is more convenient than blood lactate sampling and respiratory gas analysis.
The current study involved several limitations. First, it was not possible to evaluate Heart rate/LF in patients with arrhythmia, such as atrial fibrillation or premature beats. Second, the participants were healthy young adults. Thus, it remains unclear whether the data would have been similar for patients taking beta-blockers, those with cardiovascular disease, or those with heart failure undergoing cardiac rehabilitation. Further studies are needed to evaluate the usefulness of this method for these patients. Third, in the present study, the exercise testing was performed in a relatively wide time frame (9 am to 5 pm). This time range may have increased inter-subject variability in the values of HR and HRV because of circadian variations. Fourth, catecholamine data were lacking at the end of the exercise, because it was often difficult to collect blood samples from peripheral veins during high-intensity exercise. Therefore, it remains unclear whether Heart rate/LF can evaluate the moment at which sympathetic nervous activity is highest, around the end of the exercise period.
In conclusion, the Heart rate/LF, but not LF/HF, reflected sympathetic nervous activity during incremental cycling exercise, as well as metabolic responses. Thus, Heart rate/LF has the potential to provide an HRV index of sympathetic nervous activity during incremental cycling exercise.
Acknowledgements
The authors would like to thank the participants and Mr. Yusuke Goto for their cooperation and Prof. Hiroaki Tanaka for initial valuable advice.
Disclosure statement
No potential conflict of interest was reported by the author(s).
Additional information
Funding
References
- Ahmed, M. W., Kadish, A. H., Parker, M. A., GoldAhmed, M. W., Kadish, A. H., Parker, M. A., & Goldberger, J. J. (1994). Effect of physiologic and pharmacologic adrenergic stimulation on heart rate variability. Journal of the American College of Cardiology, 24(4), 1082–1090. https://doi.org/10.1016/0735-1097(94)90874-5
- Arai, Y., Saul, J. P., Albrecht, P., Hartley, L. H., Lilly, L. S., Cohen, R. J., & Colucci, W. S. (1989). Modulation of cardiac autonomic activity during and immediately after exercise. American Journal of Physiology, 256(1), H132–H141. https://doi.org/10.1152/ajpheart.1989.256.1.H132
- Bailón, R., Laouini, G., Grao, C., Orini, M., Laguna, P., & Meste, O. (2011). The integral pulse frequency modulation model with time-varying threshold: Application to heart rate variability analysis during exercise stress testing. IEEE Transactions on Biomedical Engineering, 58(3 PART 1), 642–652. https://doi.org/10.1109/TBME.2010.2095011
- Beaver, W. L., Wasserman, K., & Whipp, B. J. (1986). A new method for detecting anaerobic threshold by gas exchange. Journal of Applied Physiology, 60(6), 2020–2027. https://doi.org/10.1152/jappl.1986.60.6.2020
- Berntson, G. G., Thomas Bigger, J., Eckberg, D. L., Grossman, P., Kaufmann, P. G., Malik, M., … Van Der Molen, M. W. ((1997, November). Heart rate variability: Origins methods, and interpretive caveats. Psychophysiology, 34, 623–648. https://doi.org/10.1111/j.1469-8986.1997.tb02140.x
- Breuer, H. W. M., Skyschally, A., Schulz, R., Martin, C., Wehr, M., & Heusch, G. (1993). Heart rate viability and circulating catecholamine concentrations during steady state exercise in healthy volunteers. British Heart Journal, 70(2), 144–149. https://doi.org/10.1136/hrt.70.2.144
- Cottin, F., Leprêtre, P. M., Lopes, P., Papelier, Y., Médigue, C., & Billat, V. (2006). Assessment of ventilatory thresholds from heart rate variability in well-trained subjects during cycling. International Journal of Sports Medicine, 27(12), 959–967. https://doi.org/10.1055/s-2006-923849
- Faude, O., Kindermann, W., & Meyer, T. (2009). Lactate threshold concepts: How valid are they? Sports Medicine, 39(6), 469–490. https://doi.org/10.2165/00007256-200939060-00003
- Gourine, A. V., & Ackland, G. L. (2019). Cardiac vagus and exercise. Physiology, 34(1), 71–80. https://doi.org/10.1152/physiol.00041.2018
- Hansen, D., Stevens, A., Eijnde, B. O., & Dendale, P. (2012). Endurance exercise intensity determination in the rehabilitation of coronary artery disease patients: A critical re-appraisal of current evidence. Sports Medicine, 42(1), 11–30. https://doi.org/10.2165/11595460-000000000-00000
- Hayano, J., Sakakibara, Y., Yamada, A., Yamada, M., Mukai, S., Fujinami, T., … Takata, K. (1991). Accuracy of assessment of cardiac vagal tone by heart rate variability in normal subjects. The American Journal of Cardiology, 67(2), 199–204. https://doi.org/10.1016/0002-9149(91)90445-Q
- Hayano, J., Sakakibara, Y., Yamada, M., Kamiya, T., Fujinami, T., Yokoyama, K., … Takata, K. (1990). Diurnal variations in vagal and sympathetic cardiac control. American Journal of Physiology-Heart and Circulatory Physiology, 258(3), H642–H646. https://doi.org/10.1152/ajpheart.1990.258.3.H642
- Hernando, D., Hernando, A., Casajús, J. A., Laguna, P., Garatachea, N., & Bailón, R. (2018). Methodological framework for heart rate variability analysis during exercise: Application to running and cycling stress testing. Medical and Biological Engineering and Computing, 56(5), 781–794. https://doi.org/10.1007/s11517-017-1724-9
- Hirano, M., Yamada, Y., Hibi, M., Katashima, M., Higaki, Y., Kiyonaga, A., & Tanaka, H. (2014). Simultaneous multiple-subject analysis of respiratory gas exchange in humans. The Journal of Physical Fitness and Sports Medicine, 3(2), 269–279. https://doi.org/10.7600/jpfsm.3.269
- Karapetian, G. K., Engels, H. J., & Gretebeck, R. J. (2008). Use of heart rate variability to estimate LT and VT. International Journal of Sports Medicine, 29(8), 652–657. https://doi.org/10.1055/s-2007-989423
- Kiviniemi, A. M., Hautala, A. J., Kinnunen, H., & Tulppo, M. P. (2007). Endurance training guided individually by daily heart rate variability measurements. European Journal of Applied Physiology, 101(6), 743–751. https://doi.org/10.1007/s00421-007-0552-2
- Kiyonaga, A., Arakawa, K., Tanaka, H., & Shindo, M. (1985). Blood pressure and hormonal responses to aerobic exercise. Hypertension, 7(1), 125–131.
- Leicht, A. S., Sinclair, W. H., & Spinks, W. L. (2007). Effect of exercise mode on heart rate variability during steady state exercise. European Journal of Applied Physiology, 102(2), 195–204. https://doi.org/10.1007/s00421-007-0574-9
- Mazzeo, R. S., & Marshall, P. (1989). Influence of plasma catecholamines on the lactate threshold during graded exercise. Journal of Applied Physiology, 67(4), 1319–1322. https://doi.org/10.1152/jappl.1989.67.4.1319
- Monfredi, O., Lyashkov, A. E., Johnsen, A. B., Inada, S., Schneider, H., Wang, R., … Boyett, M. R. (2014). Biophysical characterization of the underappreciated and important relationship between heart rate variability and heart rate. Hypertension, 64(6), 1334–1343. https://doi.org/10.1161/HYPERTENSIONAHA.114.03782
- Pagani, M., Lombardi, F., Guzzetti, S., Rimoldi, O., Furlan, R., Pizzinelli, P., … Malliani, A. (1986). Power spectral analysis of heart rate and arterial pressure variabilities as a marker of sympatho-vagal interaction in man and conscious dog. Circulation Research, 59(2), 178–193. https://doi.org/10.1161/01.RES.59.2.178
- Polanczyk, C. A., Rohde, L. E. P., Moraes, R. S., Ferlin, E. L., Leite, C., & Ribeiro, J. P. (1998). Sympathetic nervous system representation in time and frequency domain indices of heart rate variability. European Journal of Applied Physiology, 79(1), 69–73. https://doi.org/10.1007/s004210050475
- Randall, D. C., Brown, D. R., Raisch, R. M., Yingling, J. D., & Randall, W. C. (1991). SA nodal parasympathectomy delineates autonomic control of heart rate power spectrum. American Journal of Physiology-Heart and Circulatory Physiology, 260(3), H985–H988. https://doi.org/10.1152/ajpheart.1991.260.3.H985
- Raven, P. B., Fadel, P. J., & Ogoh, S. (2006). Arterial baroreflex resetting during exercise: A current perspective. Experimental Physiology, 91(1), 37–49. https://doi.org/10.1113/expphysiol.2005.032250
- Robinson, B. F., Epstein, S. E., Beiser, G. D., & Braunwald, E. (1966). Control of heart rate by the autonomic nervous system: Studies in man on the interrelation between baroreceptor mechanisms and exercise. Circulation Research, 19(2), 400–411. https://doi.org/10.1161/01.RES.19.2.400
- Sacha, J. (2013). Why should one normalize heart rate variability with respect to average heart rate. Frontiers in Physiology, 4(October), 1–2. https://doi.org/10.3389/fphys.2013.00306
- Sahara, H., Ezoe, K., Fukuoka, H., Ohtomo, N., Tanaka, Y., Takahashi, N., … Kikudhi, K. (1996). Periodicity of ovarian follicular dynamics in postpartum cows demonstrated using time-series analysis based on the maximum entropy method. Journal of Reproduction and Development, 42(2), 117–124.
- Sales, M. M., Sousa, C. V., da Silva Aguiar, S., Knechtle, B., Nikolaidis, P. T., Alves, P. M., & Simões, H. G. (2019). An integrative perspective of the anaerobic threshold. Physiology and Behavior, 205(October 2017), 29–32. https://doi.org/10.1016/j.physbeh.2017.12.015
- Sawada, Y., Ohtomo, N., Tanaka, Y., Tanaka, G., Yamakoshi, K., Terachi, S., … Limura, O. (1997). New technique for time series analysis combining the maximum entropy method and non-linear least squares method: Its value in heart rate variability analysis. Medical and Biological Engineering and Computing, 35(4), 318–322.
- Schneider, D. A., Mclellan, T. M., & Gass, G. C. (2000). Plasma catecholamine and blood lactate responses to incremental arm and leg exercise. Medicine and Science in Sports and Exercise, 32(3), 608–613. https://doi.org/10.1097/00005768-200003000-00009
- Shiraishi, Y., Katsumata, Y., Sadahiro, T., Azuma, K., Akita, K., Isobe, S., … Takatsuki, S. (2018). Real-time analysis of the heart rate variability during incremental exercise for the detection of the ventilatory threshold. Journal of the American Heart Association, 7(1), 1–12. https://doi.org/10.1161/JAHA.117.006612
- Wasserman, K., Whipp, B. J., Koyal, S. N., & Beaver, W. L. (1973). Anaerobic threshold and respiratory gas exchange during exercise. Journal of Applied Physiology, 35(2), 236–243.
- White, D. W., & Raven, P. B. (2014). Autonomic neural control of heart rate during dynamic exercise: Revisited. Journal of Physiology, 592(12), 2491–2500. https://doi.org/10.1113/jphysiol.2014.271858
- Yamamoto, Y., Hughson, R. L., & Peterson, J. C. (1991). Autonomic control of heart rate during exercise studied by heart rate variability spectral analysis. Journal of Applied Physiology, 71(3), 1136–1142. https://doi.org/10.1152/jappl.1991.71.3.1136