
 ?Mathematical formulae have been encoded as MathML and are displayed in this HTML version using MathJax in order to improve their display. Uncheck the box to turn MathJax off. This feature requires Javascript. Click on a formula to zoom.
ABSTRACT
Jump take-off momentum has previously been proposed as an alternative test to predict sprint momentum. This study used a data simulation to replicate and systematically investigate relationships reported in previous studies between body mass, vertical jump performance, and sprint performance. Results were averaged for 1000 simulated data sets in each condition, and the effects of various parameters on correlations between jump momentum and sprint momentum were determined. The ability of jump take-off momentum to predict sprint momentum is greatest under relatively high inter-individual variation in body mass and relatively low inter-individual variation in jump height. This is largely due to the increased emphasis on body mass in these situations. Even under zero or a small negative (r = −0.30) correlation between jump height and sprint velocity, the correlation between the two momenta remained very large (r ≥ 0.76) on average. There were no investigated conditions under which jump momentum was most frequently a significantly (p < 0.05) greater predictor of sprint momentum compared to simply using body mass alone. Furthermore, between-individual correlations should not be used to make inferences or predictions for within-individual applications (e.g. predicting or evaluating the effects of a longitudinal training intervention). It is recommended that any rationale for calculating and/or monitoring jump take-off momentum should be separate from its ability to predict sprint momentum. Indeed, body mass alone may be a better predictor of sprint momentum.
Highlights
This study replicated and systematically perturbed relationships reported in the literature to investigate factors contributing to correlations between jump momentum and sprint momentum.
The ability of jump take-off momentum to predict sprint momentum is greatest under relatively high inter-individual variation in body mass and relatively low inter-individual variation in jump height. This is largely due to the increased emphasis on body mass in these situations.
Even under zero or a small negative correlation between jump height and sprint velocity, the correlation between the two momenta remained very large on average. There were no investigated conditions under which jump momentum was a better predictor of sprint momentum compared to simply using body mass alone.
It is recommended that any rationale for calculating and/or monitoring jump take-off momentum should be separate from its ability to predict sprint momentum. Indeed, body mass alone may be a better inter-individual predictor of sprint momentum if such a prediction were deemed necessary.
Introduction
Collisions and tackling actions are frequent in sports such as rugby union, rugby league, American football, and Australian football (Edwards, Spiteri, Piggott, Haff, & Joyce, Citation2018; Fuller, Brooks, Cancea, Hall, & Kemp, Citation2007; Gabbett, Jenkins, & Abernethy, Citation2011; Gastin, McLean, Spittle, & Breed, Citation2013; Weaving et al., Citation2019). The outcome of any collision is influenced by the relative momentum of the two colliding bodies. As such, sprint momentum (i.e. body mass × sprint velocity) may be a more important performance determining factor in these circumstances than either constituent parameter alone (i.e. body mass or sprint velocity). Due to the challenging and potentially fatiguing nature of regular sprint momentum assessment, there may be a benefit to researchers and practitioners from alternative jump-based tests to predict sprint momentum (Agar-Newman & Klimstra, Citation2015; Harry et al., Citation2021; Jalilvand, Banoocy, Rumpf, & Lockie, Citation2019; McMahon, Lake, Ripley, & Comfort, Citation2020; Nicholson, Dinsdale, Jones, & Till, Citation2021).
A recent study correlated countermovement jump take-off momentum with sprint momentum in a sample of 25 male professional rugby league players (McMahon et al., Citation2020). The observed very large to near-perfect correlations (r = 0.781 at 0–5 m, r = 0.878 at 5–10 m, r = 0.920 at 10–20 m) were used to suggest that jump take-off momentum could be used to predict sprint momentum in the field. However, it was not clear to what extent this relationship was mediated by: (a) the velocities achieved by the athletes (i.e. jump take-off velocity and sprint velocity); or (b) the fact that both velocities were multiplied by a common body mass value for each participant. Indeed, multiplying any two (related or unrelated) variables by each participant’s body mass would increase their shared variance and hence their correlation coefficient. The relative contribution of these two factors (a and b above) to the observed correlation between jump momentum and sprint momentum will depend on the relative magnitudes of inter-individual variation in mass or velocity parameters (Goodwin & Leech, Citation2006). As an extreme example, if all participants had the same body mass then all inter-individual variation in momentum would be due to differences in velocity, or vice versa. Further, it is not clear whether body mass may be a better predictor of sprint momentum than using any jump-related parameter.
Correlations between body mass, jump performance, and sprint performance were recently reported for 16 male high-school American footballers (Jalilvand et al., Citation2019). Body mass correlated negatively with both countermovement jump height (r = −0.56) and average sprint velocity (r = −0.56 at 0–4.6 m, r = −0.59 at 0–9.1 m, r = −0.70 at 0–36.6 m). Any applied force will accelerate a lesser body mass more than it would accelerate a greater body mass (i.e. acceleration = force ÷ mass), and so greater body mass (independent of any change in force generating capabilities) appears to negatively affect jump and sprint performance. Body mass correlated positively with average sprint momentum over each distance (0.95 ≤ r ≤ 0.96), whereas jump take-off momentum was not reported. Jump height correlated positively with average sprint velocity (0.51 ≤ r ≤ 0.83), showing that the ability to apply an impulse and accelerate the body in one movement and direction relates positively to similar abilities in a different movement and direction (Cronin & Hansen, Citation2005). Jump height did not correlate significantly with average sprint momentum over any distance.
Whether sprint momentum can be more effectively predicted from jump momentum than from body mass alone is dependent on a number of factors, including: the correlation between jump and sprint performance measures (e.g. jump height and sprint velocity); the magnitude of inter-individual variation in measured jump heights; and the magnitude of inter-individual variation in body mass (Goodwin & Leech, Citation2006). It is necessary to identify the conditions under which jump momentum is or is not useful as a predictor of sprint momentum. This will expand upon recent recommendations (McMahon et al., Citation2020) and provide greater insight into the relationships between these commonly measured parameters. The use of simulated data has recently been recommended for the generation of new knowledge and hypotheses within sport science (Warmenhoven et al., Citation2020); this will enable relationships reported in previous studies to be replicated (Azizi, Zheng, Mosquera, Pilote, & El Emam, Citation2021) and systematically varied, observing the effect on correlations between jump momentum and sprint momentum.
The aim of this study was to investigate the effects of the following parameters on the correlation between countermovement jump vertical take-off momentum and sprint average anterior momentum using previously reported sample characteristics: (1) the correlation between jump height and sprint velocity; and (2) the magnitudes of inter-individual variation in each of body mass and jump height. This investigation will facilitate a detailed demonstration and exploration of these mechanical / mathematical relationships and their applied implications.
Methods
Input parameters
Both Jalilvand et al. (Citation2019) and McMahon et al. (Citation2020) recorded the highest of three countermovement vertical jumps, performed with hands on hips to reduce the influence of arm swing magnitude (McErlain-Naylor, King, & Pain, Citation2014). Both studies measured average sprint velocity using a timing light system, recording the best of two (Jalilvand et al., Citation2019) or three (McMahon et al., Citation2020) attempts. Values reported for the similar 0–4.57 m (Jalilvand et al., Citation2019) and 0–5 m (McMahon et al., Citation2020) sprint distances were selected for simulation, to facilitate more direct comparison between the two studies. Simulation inputs described body mass, jump height, and sprint velocity – all of which were normally distributed in the studies mentioned above and are readily obtainable by practitioners in the field. The sample mean and standard deviation (SD) for each of these three parameters in Jalilvand et al. (Citation2019), and the correlation coefficients between them, were used to simulate the correlation between jump take-off momentum and sprint momentum (n = 25 individuals as in McMahon et al. (Citation2020)). All prescribed input values (prior to values being perturbed and investigated) are presented in .
Table 1. Prescribed values from Jalilvand et al. (Citation2019) and the mean ± SD or mean (95% confidence interval) of each value from the 1000 initial simulated data sets, prior to values being perturbed and investigated.
Analysis 1: Data set simulation
The purpose of this stage was to generate the simulated data. The data set described by mean and SD of mass, jump height, and sprint velocity, as well as the correlations between them () was simulated using the “faux” R package (DeBruine, Citation2020). The “rnorm_multi” function was used, which simulates multiple normally distributed vectors (i.e. mass, jump height, and sprint velocity values for 25 “individuals” given the group mean and standard deviation for each parameter) with specified relationships (i.e. the correlation coefficients between parameters). Readers are directed to DeBruine (Citation2020) and associated materials for further information and examples. This process was repeated 1000 times (i.e. 1000 simulated data sets). The R script used to perform all analyses and generate all figures within this paper is available within the supplementary materials.
For each of the 25 “individuals” within each simulated data set, countermovement jump vertical take-off velocity was calculated from jump height using constant acceleration equations (take-off velocity = , where g is acceleration due to gravity [9.81 m·s−2]). This matched Jalilvand et al.’s (Citation2019) calculation of jump height from flight time. Jump take-off momentum and sprint momentum were calculated via the multiplication of body mass by jump take-off velocity and sprint velocity, respectively.
For each of the 1000 simulated data sets, Pearson’s product moment correlation coefficients and associated p-values (α = 0.05) were calculated for each bivariate combination of the following parameters: body mass, jump height, jump velocity, jump momentum, sprint velocity, and sprint momentum. Throughout each set of 1000 simulations in analyses 1-3, average correlation coefficients were calculated via Fisher’s z-transformation (Silver & Dunlap, Citation1987); the mean z value and its 95% confidence interval (CI) were back transformed and reported as correlation coefficients (r). As in both McMahon et al. (Citation2020) and Jalilvand et al. (Citation2019), correlation coefficients were interpreted as: small ≤ 0.3; 0.3 < moderate ≤ 0.5; 0.5 < large ≤ 0.7; 0.7 < very large ≤ 0.9; and near-perfect > 0.9 (Hopkins, Citation2006).
Analysis 2: The effect of the jump height – sprint velocity correlation
The purpose of this stage was to investigate the effect of varying the jump height – sprint velocity correlation (i.e. the correlation between the two “performances”) on the correlation between the two (jump and sprint) momenta. The process described in Analysis 1 (i.e. the prescribed values [] and 1000 simulations of n = 25) was repeated for various prescribed jump height – sprint velocity correlation coefficients. The coefficient (r = 0.51 in Analysis 1: ) was varied from a small negative correlation (r = −0.30) to a near-perfect positive correlation (r = 0.99) in increments of r = 0.01 (1000 simulations per investigated coefficient), and the jump momentum – sprint momentum correlations were reported.
Analysis 3: The effects of inter-individual variation in body mass and jump height
The purpose of this stage was to investigate the effect of varying the sample homogeneity of body mass and jump ability (i.e. jump height) on the correlation between jump momentum and sprint momentum. This should increase the ability of researchers or practitioners to generalise the findings to alternative groups and situations, as well as increasing understanding of factors contributing to the correlation of interest. The process described in Analysis 1 (i.e. the prescribed values [] and 1000 simulations of n = 25) was repeated for various combinations of body mass and jump height SDs. Both of these SDs (prescribed as 17.9 kg and 8.8 cm in Analyses 1 & 2: ) were varied from 0.5–2 times the previously prescribed SD in increments of 0.05 times the previously prescribed SD (1000 simulations per investigated combinations of SDs), and the jump momentum – sprint momentum correlations were reported. To determine the conditions under which either body mass or jump take-off momentum are the greater predictors of sprint momentum, the two correlations were compared statistically for each simulated data set. Dependent overlapping correlations (i.e. correlations from the same sample, with one variable [sprint momentum] common to both correlations) were compared using Williams’ t (Williams, Citation1959) via the “cocor” R package (Diedenhofen & Musch, Citation2015). Williams’ t was selected over alternative methods due to its Type I error rate and statistical power, particularly under relatively small sample sizes and relatively high predictor-criterion correlations and predictor intercorrelation (Hittner, May, & Silver, Citation2003).
Results
Analysis 1: Data set simulation
All values prescribed from previous literature were accurately replicated on average (), although simulated correlation coefficients varied relatively more (Fisher’s z SD ranging from 0.21–0.22) than the simulated parameter means and SDs. Jump take-off momentum and sprint momentum averaged 299 ± 46 kg·m·s−1 and 442 ± 72 kg·m·s−1 respectively. Correlation coefficients and p-values for each pair of parameters are reported within . The simulated correlation coefficient between jump take-off momentum and sprint momentum averaged 0.88 (very large; p < 0.001). On average, body mass correlated negatively with both jump velocity (r = −0.56, large, p = 0.035) and sprint velocity (r = −0.55, large; p = 0.041) but positively with jump momentum (r = 0.87, very large; p < 0.001) and sprint momentum (r = 0.97, near-perfect; p < 0.001). On average, jump velocity and jump momentum did not correlate significantly with each other (r = −0.07, small; p = 0.49), nor did sprint velocity and sprint momentum (r = −0.35, moderate; p = 0.20).
Table 2. Mean (95% confidence interval) Pearson’s product moment correlation coefficient’s via Fisher’s z transformation (r: white background) and associated mean p-values (grey background) for each bivariate combination of simulated parameters from the 1000 initial simulated data sets prior to values being perturbed and investigated. Bold text: these three correlations were prescribed based on Jalilvand et al. (Citation2019).
Analysis 2: The effect of the jump height – sprint velocity correlation
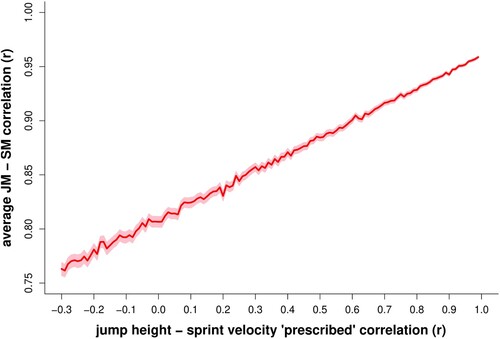
As the correlation between jump height and sprint velocity increased, the correlation between jump momentum and sprint momentum also increased (maximum r = 0.96) and became less variable (). Even in cases of zero or small negative (r = −0.30) correlation between jump height and sprint velocity, the correlation between the two momenta remained very large (r ≥ 0.76) on average.
Figure 1. At each prescribed correlation between countermovement jump height and 0–5 m sprint average velocity (r = −0.3–0.99 in increments of 0.01), 1000 data simulations were run with a sample of n = 25. This figure shows the mean (and 95% confidence interval: shaded area) correlation coefficient between jump vertical take-off momentum (JM) and sprint average anterior momentum (SM) for each set of 1000 simulations, calculated via Fisher’s z transformation. The jump momentum – sprint momentum correlation increases as the jump height – sprint velocity correlation increases.
Analysis 3: The effects of inter-individual variation in body mass and jump height
With increasing inter-individual variation in body mass, the average positive correlation between body mass and sprint momentum increased (range: 0.88–0.99, very large to near-perfect; (a)) and the average correlation between jump velocity and sprint momentum became more negative (range: −0.55 – −0.37, moderate to large; (b)). The average correlation between jump take-off momentum and sprint momentum ranged from small (r = 0.08) to near-perfect (r = 0.99), depending on the prescribed variation in body mass and jump height ((c)). This correlation between jump and sprint momenta increased with increasing variation in body mass (i.e. greater contribution of the stronger sprint momentum predictor) and/or with decreasing variation in jump height (i.e. reduced contribution of the weaker sprint momentum predictor).
Figure 2. At each combination of prescribed body mass standard deviation (SD; 8.95 kg to 35.8 kg in increments of 0.895 kg) and prescribed countermovement jump height SD (4.4 cm to 17.6 cm in increments of 0.44 cm), 1000 data simulations were run with a sample of n = 25. For each set of 1000 simulations, the top row of this figure shows the mean correlation coefficient (calculated via Fisher’s z transformation) between; (a) body mass (m) and sprint average anterior momentum (SM); (b) countermovement jump vertical take-off velocity (JV) and SM; (c) countermovement jump vertical take-off momentum (JM) and SM. Colours indicate small (r ≤ 0.3), moderate (0.3 < r ≤ 0.5), large (0.5 < r ≤ 0.7), very large (0.7 < r ≤ 0.9), and near-perfect (r > 0.9) correlations. For each set of 1000 simulations, the bottom row of this figure shows the number of data sets for which: (d) the m-SM correlation was significantly (p < 0.05) greater than the JM-SM correlation; (e) there was no significant difference between m-SM and JM-SM correlations; (f) the JM-SM correlation was significantly greater than the m-SM correlation.
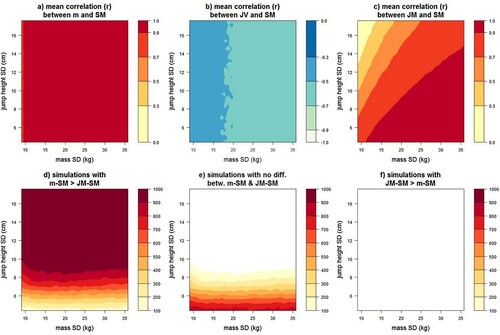
The proportion of simulated data sets in which sprint momentum had a significantly greater correlation with body mass than with jump momentum increased with increasing variability (SD) of jump height ((d)). This was the most common scenario for all data sets with prescribed jump height SD ≥ 6.6 cm. As jump height SD decreased, a greater proportion of data sets had no significant difference between these two correlations ((e)). This was the most common scenario for all data sets with prescribed jump height SD ≤ 5.7 cm. In all conditions (combinations of prescribed SDs), the proportion of simulations in which sprint momentum correlated significantly more with jump momentum than with body mass was always ≤ 1.4% ((f)).
Discussion
This study used simulated data to replicate and systematically investigate relationships reported in previous studies (Jalilvand et al., Citation2019; McMahon et al., Citation2020) between body mass, vertical jump performance, and sprint performance. The effects of various factors on correlations between jump momentum and sprint momentum were reported. The ability of jump take-off momentum to predict sprint momentum is greatest under relatively high inter-individual variation in body mass and relatively low inter-individual variation in jump height. There were no investigated conditions under which jump momentum was most frequently a significantly greater predictor of sprint momentum compared to using body mass alone. Although what are described herein are inherent mathematical relationships, it is useful and informative to demonstrate and explore these relationships which may find considerable application in sports science practice.
For each of body mass, jump height, and sprint velocity, the simulated mean and SD and the correlation coefficients between them accurately replicated those of Jalilvand et al. (Citation2019) (). Importantly, secondary values and relationships which were not directly prescribed also replicated accurately. For example, the calculated sprint momentum compared favourably to Jalilvand et al.’s (Citation2019) values (442 ± 72 kg·m·s−1 vs 445 ± 72 kg·m·s−1). Likewise, the body mass – sprint momentum correlation (r = 0.97 [CI: 0.97, 0.98] vs 0.96) and jump height – sprint momentum correlation (r = −0.49 [CI: −0.50, −0.48] vs −0.48) both replicated well. Once the replicated values had been evaluated satisfactorily, the simulated data sets could be investigated and perturbed to facilitate greater understanding of factors influencing the jump momentum – sprint momentum relationship.
The first aspect investigated was the importance of any correlation between the two performance measures (i.e. jump height and sprint velocity). A greater positive correlation between jump height and sprint velocity will clearly lead to a greater positive correlation between jump momentum and sprint momentum (). This mathematical relationship should not be surprising, however it is noteworthy how little effect the actual jump height and sprint velocity have on the correlation between momenta. Firstly, neither jump take-off velocity nor sprint velocity correlated significantly with their respective momenta on average. Secondly, even with zero (or even negative) relationship between jump height and sprint velocity, the correlation between the two momenta remained very large. Previously reported relationships between jump momentum and sprint momentum therefore likely have relatively little to do with jumping and sprinting – in reality the inclusion of velocity measures is simply dampening a perfect correlation coefficient between body mass and body mass. It must be recognised, however, that these relationships (e.g. jump height – sprint velocity) do not exist in isolation, and so any change in one relationship is likely to change the other prescribed correlations (e.g. body mass – jump height or body mass – sprint velocity). Regardless, the effects of any increase (Jalilvand et al., Citation2019) or decrease (Cronin & Hansen, Citation2005) in jump height – sprint velocity correlation with increased sprint distances may be limited due to potentially opposite changes in body mass – sprint velocity correlation (Jalilvand et al., Citation2019). McMahon et al. (Citation2020) did report greater correlations between jump and sprint momenta for later sections of the sprint (e.g. 10–20 m compared to 0–5 m) but the factors contributing to this were not reported.
Assuming other factors are unchanged, a correlation will be greater if there is more variability among the observations (Goodwin & Leech, Citation2006). However, this fact is often neglected when interpreting research findings, comparing studies, or transferring findings to alternative populations (Glass & Hopkins, Citation1996). In the present example, jump momentum is the product of take-off velocity (a lesser correlate of sprint momentum) and body mass (a greater correlate of sprint momentum). An increase in the variability of either contributing factor will increase its relative contribution to the correlation between momenta. Indeed, increasing the inter-individual variation in body mass (the greater correlate of sprint momentum) led to greater correlations between body mass and sprint momentum ((a)). This also augmented the negative effect of body mass on jump velocity, leading to more negative correlations between jump velocity and sprint momentum ((b)). Because body mass was the greatest predictor of sprint momentum (), anything that increased the influence of this parameter (i.e. its variation as a proportion of the total variation) would increase the correlation between the two momenta. Accordingly, this correlation did increase with increasing variation in body mass and/or decreasing variation in jump height ((c)). Greater variation in jump heights (the lesser correlate of sprint momentum) reduce the correlation between jump and sprint momenta, increasing the likelihood of mass rather than jump momentum being a significantly greater predictor of sprint momentum ((d)). For the sample characteristics taken from Jalilvand et al. (Citation2019), inter-individual jump height SD of around 6 cm appears to be the threshold above which mass is a greater predictor of sprint momentum and below which there is no significant difference between mass and jump momentum as predictors. With the body mass SD of 17.9 kg from Jalilvand et al. (Citation2019), a jump height SD of 6.2 cm resulted in an average correlation between the jump and sprint momenta of r = 0.97. It should be noted that the frequency of significant differences would also increase at greater sample sizes than the 25 individuals in McMahon et al. (Citation2020) and replicated in the present study (Abt et al., Citation2020). The absence of any condition in the present investigation in which jump momentum was a stronger predictor of sprint momentum than using body mass alone further reinforces the apparent lack of evidence to support using jump momentum for this purpose over other alternatives in applied settings. Furthermore, the correlations between body mass and sprint momentum (r = 0.97 [CI: 0.97, 0.98]) were greater than those recently reported between sprint momentum and any jump or sprint force-velocity profile parameter (greatest r = 0.88 for sprint theoretical maximal horizontal force; Nicholson et al., Citation2021).
Changes in the inter-individual variation of a parameter would also affect its correlation with other parameters (Goodwin & Leech, Citation2006). We therefore recognise the limitations associated with perturbing SD independently of correlation coefficients. Likewise, we recognise that changes in one parameter (e.g. body mass) would likely result in changes in other parameters correlated with that parameter (e.g. jump height and sprint velocity). Nonetheless, an attempt has been made to demonstrate the important factors influencing previously reported jump momentum – sprint momentum correlations. Readers should not place too much emphasis on the specific correlation coefficients reported here, but rather should consider the broad relationships and principles described. These relationships and principles are equally relevant for the interpretation of other correlations reported within sport and exercise science where one parameter is a multiple of other commonly measured parameters (e.g. power = force × velocity, speed = stride or stroke length x frequency, or session-RPE = session duration x rating of perceived exertion). Additionally, the implication remains that there were no conditions in the current investigation under which jump momentum was a better predictor of sprint momentum compared to using body mass alone. This is due to the near-perfect correlation between body mass and sprint momentum (r = 0.97 [CI: 0.97, 0.98]; p < 0.001). Given the strength of body mass as a predictor of sprint momentum, and considering that jump momentum is not that much easier to measure than sprint momentum, the rationale for calculating jump take-off momentum as a predictor (McMahon et al., Citation2020) appears questionable. Researchers and practitioners wishing to utilise sprint momentum are therefore recommended to either measure this parameter directly or, if necessary, make predictions using participant body mass.
The initial correlation between jump momentum and sprint momentum in the present study (r = 0.88 [CI: 0.88, 0.89]) using values from Jalilvand et al. (Citation2019) is greater than the 0.78 reported for a similar sprint distance in McMahon et al. (Citation2020). Our results show that this correlation would decrease under reduced inter-individual variation in body mass and/or increased variation in jump and sprint performances. Accordingly, the SD of body mass was lower in McMahon et al. (Citation2020) (10.0 kg vs 17.9 kg) and the playing standard was higher (professional vs high-school). Higher playing standards have previously been associated with greater SD in rugby union players’ sprint times (Smart, Hopkins, & Gill, Citation2013). It is possible that jump momentum is a better predictor of later (e.g. 10–20 m) rather than earlier (e.g. 0–5 m) sprint momentum (McMahon et al., Citation2020), although body mass will likely remain a greater predictor (if such an indirect prediction is necessary). Practitioners should also consider the typical sprint distance prior to any collision of interest (e.g. whether collisions typically occur within 5 m or between 10 and 20 m).
A further necessary consideration is the transfer of between-individual relationships to within-individual applications (Fisher, Medaglia, & Jeronimus, Citation2018; Glazier & Mehdizadeh, Citation2019). Jump take-off momentum has been proposed for within-individual monitoring (McMahon et al., Citation2020). However, it is not currently known how or whether longitudinal changes in jump momentum relate to changes in sprint momentum within the same individual. This likely depends on whether the changes are attributable to greater body mass (which could be measured separately), enhanced muscular capabilities, or coordination during the jump. For many of the reasons discussed above, it is therefore recommended that any rationale for calculating and / or monitoring jump take-off momentum should be separate from its ability to predict sprint momentum.
In conclusion, factors influencing the jump momentum – sprint momentum correlation have been investigated and demonstrated via data simulation. The ability of jump take-off momentum to predict sprint momentum is greatest under relatively high inter-individual variation in body mass and relatively low variation in jump height. However, there were no investigated conditions under which jump momentum was a greater predictor of sprint momentum compared to simply using body mass alone. Furthermore, between-individual relationships may not transfer to within-individual applications. It is therefore recommended that any rationale for calculating and / or monitoring jump take-off momentum should be separate from its ability to predict sprint momentum. Indeed, body mass alone may be a better predictor of sprint momentum.
Supplemental Material
Download R Objects File (19.7 KB)Conflict of interest statement
The authors report no conflicts of interest.
Disclosure statement
No potential conflict of interest was reported by the author(s).
Additional information
Funding
References
- Abt, G., Boreham, C., Davison, G., Jackson, R., Nevill, A., Wallace, E., & Williams, M. (2020). Power, precision, and sample size estimation in sport and exercise science research. Journal of Sports Sciences, 38(17), 1933–1935. doi:10.1080/02640414.2020.1776002
- Agar-Newman, D. J., & Klimstra, M. D. (2015). Efficacy of horizontal jumping tasks as a method for talent identification of female rugby players. Journal of Strength and Conditioning Research, 29(3), 737–743. doi:10.1519/JSC.0000000000000683
- Azizi, Z., Zheng, C., Mosquera, L., Pilote, L., & El Emam, K. (2021). Can synthetic data be a proxy for real clinical trial data? A validation study. BMJ Open, 11(4), e043497. doi:10.1136/bmjopen-2020-043497
- Cronin, J. B., & Hansen, K. T. (2005). Strength and power predictors of sports speed. The Journal of Strength and Conditioning Research, 19(2), 349–357. doi:10.1519/14323.1
- DeBruine, L. (2020). faux: simulation for factorial designs. https://doi.org/10.5281/zenodo.2669586.
- Diedenhofen, B., & Musch, J. (2015). Cocor: A comprehensive solution for the Statistical Comparison of correlations. PLOS ONE, 10(4), e0121945. doi:10.1371/journal.pone.0121945
- Edwards, T., Spiteri, T., Piggott, B., Haff, G. G., & Joyce, C. (2018). A narrative review of the physical demands and injury incidence in American football: Application of current knowledge and practices in workload management. Sports Medicine, 48(1), 45–55. doi:10.1007/s40279-017-0783-2
- Fisher, A. J., Medaglia, J. D., & Jeronimus, B. F. (2018). Lack of group-to-individual generalizability is a threat to human subjects research. Proceedings of the National Academy of Sciences, 115(27), E6106–E6115. doi:10.1073/pnas.1711978115
- Fuller, C. W., Brooks, J. H. M., Cancea, R. J., Hall, J., & Kemp, S. P. T. (2007). Contact events in rugby union and their propensity to cause injury. British Journal of Sports Medicine, 41(12), 862–867. doi:10.1136/bjsm.2007.037499
- Gabbett, T. J., Jenkins, D. G., & Abernethy, B. (2011). Physical collisions and injury in professional rugby league match-play. Journal of Science and Medicine in Sport, 14(3), 210–215. doi:10.1016/j.jsams.2011.01.002
- Gastin, P. B., McLean, O., Spittle, M., & Breed, R. V. P. (2013). Quantification of tackling demands in professional Australian football using integrated wearable athlete tracking technology. Journal of Science and Medicine in Sport, 16(6), 589–593. doi:10.1016/j.jsams.2013.01.007
- Glass, G. V., & Hopkins, K. D. (1996). Statistical methods in education and psychology (3rd ed.). Needham Heights, MA: Allyn & Bacon.
- Glazier, P. S., & Mehdizadeh, S. (2019). Challenging conventional paradigms in applied sports biomechanics research. Sports Medicine, 49(2), 171–176. doi:10.1007/s40279-018-1030-1
- Goodwin, L. D., & Leech, N. L. (2006). Understanding correlation: Factors that affect the size of r. Journal of Experimental Education, 74(3), 251–266. doi:10.3200/JEXE.74.3.249-266
- Harry, J. R., Barker, L. A., Tinsley, G. M., Krzyszkowski, J., Chowning, L. D., McMahon, J. J., … Lake, J. (2021). Relationships among countermovement vertical jump performance metrics, strategy variables, and inter-limb asymmetry in females. Sports Biomechanics, ahead of print, 1–19. doi:10.1080/14763141.2021.1908412.
- Hittner, J. B., May, K., & Silver, N. C. (2003). A monte carlo evaluation of tests for comparing dependent correlations. The Journal of General Psychology, 130(2), 149–168. doi:10.1080/00221300309601282
- Hopkins, W. G. (2006). A Scale of Magnitudes for Effect Statistics. Retrieved January 13, 2021, from http://www.sportsci.org/resource/stats/effectmag.html.
- Jalilvand, F., Banoocy, N. K., Rumpf, M. C., & Lockie, R. G. (2019). Relationship between body mass, peak power, and power-to-body mass ratio on sprint velocity and momentum in high-school football players. Journal of Strength and Conditioning Research, 33(7), 1871–1877. doi:10.1519/JSC.0000000000002808
- McErlain-Naylor, S., King, M., & Pain, M. T. G. (2014). Determinants of countermovement jump performance: A kinetic and kinematic analysis. Journal of Sports Sciences, 32(19), 1805–1812. doi:10.1080/02640414.2014.924055
- McMahon, J. J., Lake, J. P., Ripley, N. J., & Comfort, P. (2020). Vertical jump testing in rugby league: A rationale for calculating take-off momentum. Journal of Applied Biomechanics, 36(6), 370–374. doi:10.1123/jab.2020-0100
- Nicholson, B., Dinsdale, A., Jones, B., & Till, K. (2021). Sprint and jump mechanical profiles in academy rugby league players: Positional differences and the associations between profiles and sprint performance. Sports, 9(7), 93. doi:10.3390/sports9070093
- Silver, N. C., & Dunlap, W. P. (1987). Averaging correlation coefficients: Should Fisher’s z transformation be used? Journal of Applied Psychology, 72(1), 146–148. doi:10.1037/0021-9010.72.1.146
- Smart, D. J., Hopkins, W. G., & Gill, N. D. (2013). Differences and changes in the physical characteristics of professional and amateur rugby union players. Journal of Strength and Conditioning Research, 27(11), 3033–3044. doi:10.1519/JSC.0b013e31828c26d3
- Warmenhoven, J., Harrison, A., Quintana, D., Hooker, G., Gunning, E., & Bargary, N. (2020). Unlocking sports medicine research data while maintaining participant privacy via synthetic datasets. SportRxiv, preprint. https://doi.org/10.31236/osf.io/f3rz7.
- Weaving, D., Sawczuk, T., Williams, S., Scott, T., Till, K., Beggs, C., … Jones, B. (2019). The peak duration-specific locomotor demands and concurrent collision frequencies of european super league rugby. Journal of Sports Sciences, 37(3), 322–330. doi:10.1080/02640414.2018.1500425
- Williams, E. J. (1959). The Comparison of regression variables. Journal of the Royal Statistical Society: Series B (Methodological), 21, 396–399. doi:10.1111/j.2517-6161.1959.tb00346.x