
ABSTRACT
Self-reported physical fitness has advantages in cost and time over objective methods, but previous studies demonstrate equivocal conclusions regarding validity. Methods for self-reporting are usually based on subjective judgements, while another approach includes performing field tests at home. The Norwegian military relies on the latter method for conscript selection, but its validity is unknown and should be investigated. In total 14,166 young men and women were included in the study. During conscript selection step one, the subjects were requested to perform 3,000 m run, push-up, pull-up and standing long jump tests at home, and report the results online (“self-reported measurements”). Step two took place at a conscript selection centre 1–18 months later. Here, the subjects completed a maximal treadmill test, seated medicine ball throw, pull-up and standing long jump tests (“objective measurements”). The results demonstrated correlation coefficients from 0.29 to 0.82 (P < 0.05) for self-reported vs. objective measurements, with the highest association found for self-reported and objectively measured pull-ups. Kappa values ranged from 0.05 to 0.34 (P < 0.05), with pull-ups demonstrating the highest agreement. More women than men over-reported their physical fitness. Among men and women indicating similar self-reported fitness, men’s objective fitness was higher for all objective tests (effect sizes from 0.5 to 3.0). In conclusion, large variations in correlation coefficients were observed between self-reported and objectively measured physical fitness, while the kappa values indicated poor to fair agreement. The finding that more women than men over-reported their fitness level contradicts most previous studies.
Highlights
Low, moderate, and high correlations, and poor to fair agreements (kappa values), were observed between self-reported and objectively measured endurance and muscle strength variables.
More women than men overreported their actual fitness level.
Self-reported fitness based on performing field tests at home may be a feasible alternative to traditional methods which rely on self-perceived fitness.
Introduction
Good physical fitness is associated with lower risk of cardiovascular disease and all-cause mortality (Kodama et al., Citation2009; Liu et al., Citation2019), as well as better occupational and sports performance (Åstrand, Rodahl, Dahl, & Strømme, Citation2003). Physical fitness has been defined in several ways, but cardio-respiratory endurance, muscular endurance and muscular strength are considered essential components of health-related physical fitness (hereafter “physical fitness”) (Caspersen, Powell, & Christenson, Citation1985; Nindl et al., Citation2015). Since physical fitness is an important factor in both health and performance, much effort has been put into developing valid methods for determining physical fitness for clinical, selection, evaluation, and research purposes.
The most advanced method for evaluating physical fitness includes objective measurements performed in an exercise physiology laboratory, with direct measurement of maximal oxygen uptake (VO2max) as one classical example (Åstrand et al., Citation2003). Such evaluations are usually time-consuming, expensive and require sophisticated instruments and trained test-leaders, making it less realistic for mass-testing. Thus, several indirect field methods are utilized as they can be performed faster and cheaper and with less need of equipment and specialized personnel (Vanhees et al., Citation2005). Still, field testing also requires time, facilities and administration, and a test may lead to discomfort or even health-risk if it needs to be performed until maximal effort. A third way of evaluating physical fitness is by self-report; that is, the subject answers questions related to his or her physical fitness or performance (Keith, Stump, & Clark, Citation2012; Knapik, Jones, Reynolds, & Staab, Citation1992). Such an approach is cost and time effective compared to objective fitness testing. This method is particularly interesting when screening physical fitness in large samples, such as for research on population fitness, health evaluations and for initial screening of applicants to sports schools or occupations with physical standards (military, police, firefighters, etc.).
Different approaches and questionnaires are used to collect self-reported physical fitness data. The simplest method includes a single-item question like “how do you rate your own physical fitness?”, and with typically five or more alternative responses (Jensen, Rosthoj, Linneberg, & Aadahl, Citation2018; Obling et al., Citation2015; Petersen, Eriksen, Dahl-Petersen, Aadahl, & Tolstrup, Citation2021; Stefan, Paradzik, & Sporis, Citation2019). Yet, single-item questionnaires are criticized for not addressing the multidimensionality of physical fitness (Germain & Hausenblas, Citation2006). An alternative is to ask several questions pertaining to separate fitness components like cardio-respiratory fitness, muscular fitness, flexibility, etc. (Knapik et al., Citation1992; Mikkelsson, Kaprio, Kautiainen, Kujala, & Nupponen, Citation2005; Ortega et al., Citation2011b). Others use questions related to how hard it feels to complete specific tasks (Keith et al., Citation2012), or which physical tasks the respondent are able to complete (Mikkelsson et al., Citation2005). The answers may subsequently be used to create fitness indexes by summarizing scores for each domain.
Conclusions regarding validity of self-reported fitness are equivocal. Most studies demonstrate significant associations between self-reported and objectively measured fitness, but with large variance in reported correlation coefficients (Germain & Hausenblas, Citation2006). Lack of consistency in the literature may be caused by differences in questions and objective methods used, sample characteristics (age, gender, fitness levels) and statistical methods and interpretations. After many years with research on self-reported physical fitness, there seems to be no clear consensus for a “best-practice” method for collecting such data. Moreover, it is not clear whether validity of self-reported fitness is higher in certain subgroups. A previous meta-study concluded that sex did not moderate the relationship between perceived and actual fitness (Germain & Hausenblas, Citation2006), but this is apparently in conflict with newer studies showing that more men overestimate their fitness compared to women (Obling et al., Citation2015; Petersen et al., Citation2021). Thus, several questions pertaining to self-reported fitness still need to be addressed.
The Norwegian Armed Forces uses another variant of self-reported fitness as a first step to select potential conscripts for compulsory military service. At age 17, all Norwegian men and women (∼60,000) are required to complete an internet questionnaire as part of conscript selection step one (Teien et al., Citation2019). The subjects are first requested to carry out one endurance and three muscle strength tests at home, and then return to the online form and report the results. Within 18 months, ∼15,000 of the initial population are required to meet for step two examinations at a selection centre. Here, the subjects carry out supervised objective physical tests that are similar or considered related to the four self-reported tests. No previous studies were identified investigating the validity of this method for self-reporting physical fitness. By using obligatory conscript selection data, a large sample size is available for such a method comparison study.
Thus, the aim of the present study was to study the relationship between self-reported endurance and muscle strength against corresponding objective measurements, and to investigate whether there is a sex-difference in the ability to self-report physical fitness.
Materials and methods
This study can be characterized as an observational method-comparison study. It was approved by the Research Group at the Norwegian Defense University College, while the Norwegian Centre for Research Data and the Regional Committee for Medical and Health Research Ethics considered the study to be exempted from notification. The data was extracted from the database P3 by technical personnel from the Norwegian Armed Forces HR and Conscription Centre (Hamar, Norway).
Subjects
All men and women born in the year 2000 who participated in both step one and step two of the Norwegian conscript selection were first identified (n = 15,842). Subjects with one or more missing data points (n = 1,669), as well as subjects with data points considered mistyped (unnatural outliers) in the P3 register (n = 7) were removed prior to conducting the analyses. Accordingly, 8,046 men and 6,120 women were included in the study. The participants were 17 years old when they completed the step one questionnaire.
Self-reported fitness
Data on self-reported fitness were gathered from an internet questionnaire administered during conscript selection step one. When the subjects first logged on to the questionnaire, they were asked to perform the following physical tests with maximal effort: 3,000 m run (min:sec), push-ups (number of repetitions), pull-ups (number of repetitions) and standing long jump (m). Correct execution of the tests was described through text and video clips, according to the Norwegian Armed Forces Regulations on Physical Fitness Testing (Frantzen, Citation2020; “Tjenestereglement for Forsvaret. Gruppe 43 [Service manual for the Norwegian Armed Forces. Group 43]”, Citation1998). Thereafter, the subjects returned to the questionnaire and reported their results, as well as answered other questions pertaining to their background, health, qualifications, motivation, etc. It is not known how many actually completed the physical tests prior to reporting their test scores, and how many simply estimated their performance without doing the tests.
Self-reported physical fitness was registered according to the performance intervals (categories) presented in Supplemental online material 1. Twelve categories were available for the 3,000 m run, while push-ups, pull-ups (vertical and horizontal combined) and standing long jump consisted of 10, 21 and 14 categories, respectively.
Objectively measured fitness
The objectively measured fitness tests were performed as part of the conscript selection step two, which took place at district conscript selection centres 1–18 months after step one. The administration of the tests and the protocols have previously been described in detail (Aandstad, Citation2021b; Aandstad & Hageberg, Citation2019), and will therefore only be explained briefly here.
The treadmill test began with 6 min of walking at 5 and 10% incline on a motorized treadmill (T300, Nordic Sportsmaster AS, Nesbru, Norway). Thereafter, the treadmill speed was automatically increased by 1 km·h−1 every minute (10% incline) until voluntarily exhaustion. Run time in minutes and seconds was registered to the nearest five seconds. Maximal oxygen uptake was estimated from an equation previously validated on male and female conscript soldiers (Aandstad & Hageberg, Citation2019). The study demonstrated a test-retest intraclass correlation coefficient (ICC) of 0.95 (0.91, 0.97) for run time, while a Pearson correlation coefficient (r) of 0.89 (0.83, 0.93) was demonstrated for estimated vs. directly measured VO2max.
The seated medicine ball throw was performed in a customized weight bench (Gym 2000, Vikersund, Norway). Starting position was with the subject seated on the bench holding a 10 kg medicine ball (Trial SRL, Forli, Italy) to the chest. The medicine ball was then pushed with maximal power as far as possible. The length of the throw was measured to the nearest 10 cm by use of a customized measurement mat. The best result of two attempts was recorded.
The standing long jump was performed with the subject standing behind a line on the measurement mat. The participant was instructed to jump as far as possible, and the jump was measured to the nearest 5 cm. The best result of two attempts was recorded.
The pull-up test was performed from a starting position hanging vertically from a beam using an overhand grasp. The subject then raised the body until the chin was over the beam, followed by lowering the body until the arms were fully stretched. The total number of accepted repetitions was registered. If a subject was not able to perform any vertical pull-ups, an alternative horizontal pull-up test was administered. Here, the starting position was with the subject grasping the beam with an overhand grip (straight arms) and with heels placed on a bench to achieve a horizontal starting position. The straight body was raised until the chest touched the underside of the beam. The total number of accepted repetitions was registered.
Subjects were given the same instructions for executing the pull-up and standing long jump tests during conscript selection step one and two. Reliability and validity statistics for the medicine ball throw (seated or standing), standing long jump and pull-ups have previously been documented in Norwegian military personnel (Aandstad, Citation2015, Citation2020; Aandstad & Kirknes, Citation2018).
Statistical analyses
The objectively measured physical fitness variables were checked for normality by visual inspections of data distribution plots (Q-Q plots and histograms). All objectively measured variables were considered normally distributed, except for pull-ups.
Self-reported fitness data are described from frequency distributions, including cumulative relative frequency. Objectively measured physical fitness data are presented as means (SD) or medians (25–75 percentiles), and with 95% confidence intervals and box-and-whisker plots, dependent on the reported data set.
Spearman’s rank correlation coefficient (rs) was calculated to investigate associations between self-reported and objectively measured physical fitness. The rs values are interpreted as low (≤ 0.49), moderate (0.50–0.69), and high (≥ 0.70) (Hinkle, Wiersma, & Jurs, Citation2003). Moreover, weighted kappa (Kw) with linear weights was used to investigate the agreement between self-reported and objectively measured pull-up and standing long jump performance (Brenner & Kliebsch, Citation1996). The Kw values are interpreted as poor (< 0.20), fair (0.21–0.40), moderate (0.41–0.60), good (0.61–0.80), and very good (0.81–1.00) (Altman, Citation1991). For the kappa analyses, the objectively measured continuous data were re-arranged into categories identical to the self-reported data (i.e. 21 categories for pull-ups and 14 categories for standing long jump). The same categories were also used to calculate the frequency and percentage of men and women who underreported (i.e. performed better on the objective test compared to their self-reported level), correctly reported, or overreported their pull-up and standing long jump performance.
A Chi squared test was used to analyze differences in frequencies between men and women for the self-reported fitness data. An independent sample’s t test was used to check for significant differences between sexes for all objectively measured fitness variables, except for pull-ups for which the Mann–Whitney U test was utilized. Effect sizes for the sex differences were calculated as Cohen’s d, and interpreted as trivial (≤ 0.19), small (0.20–0.49), medium (0.50–0.79) and large (≥ 0.80) (Cohen, Citation1988).
Statistical analyses were performed in jamovi (version 1.6.10). A probability (P) of < 0.05 was considered statistically significant.
Results
Mean self-reported height and weight were 1.81 (0.06) m and 73.0 (9.9) kg in men, and 1.68 (0.06) m and 62.3 (8.5) kg in women. Descriptive data for objectively measured physical fitness are presented in . Mean (SD) estimated VO2max was 53.8 (4.3) mL·kg−1·min−1 for men and 43.0 (3.9) mL·kg−1·min−1 for women (P < 0.001), based on calculations from treadmill run time. The frequency distributions for self-reported physical fitness are given in Supplemental online material 1.
Table 1. Descriptive data for objectively measured endurance and muscle strength in Norwegian men (n = 8,046) and women (n = 6,120) during conscript selection step two.
Correlation coefficients for self-reported and objectively measured endurance and muscle strength are presented in . In men, the highest association was demonstrated for self-reported vs. objectively measured pull-up performance (rs = 0.70). In women, the highest association was demonstrated for self-reported 3,000 m run vs. objectively measured treadmill run performance (rs = −0.51), as well as for self-reported vs. objectively measured standing long jump performance (rs = 0.51). When men and women were analyzed together, all correlation coefficients increased, with the highest association demonstrated for self-reported and objectively measured pull-ups (rs = 0.82). Weighted kappa for self-reported and objectively measured pull-ups were Kw = 0.34 in men, Kw = 0.05 in women, and Kw = 0.22 for both sexes combined. The corresponding figures for standing long jump were Kw = 0.17 in men, Kw = 0.24 in women, and Kw = 0.25 for both sexes combined. All correlation and kappa values were significant (P < 0.001). Cross-tabulation tables for self-reported vs. objectively measured pull-ups and standing long jump are presented in Supplemental online material 2.
Table 2. Spearman correlation coefficients for self-reported vs. objectively measured endurance and muscle strength in men (n = 8,046) and women (n = 6,120) during conscript selection.
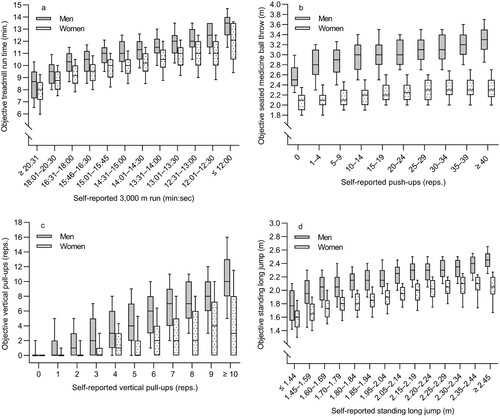
Among men and women who reported being in the same fitness category, the corresponding objectively measured fitness level was significantly higher in men for all tests and categories ( and Supplemental online material 3). Effect sizes for the differences between men and women within each category ranged from 0.5–3.0.
Figure 1. Box-and-whisker plots illustrating how objectively measured physical fitness vary according to self-reported physical fitness category in Norwegian men (n = 8,046) and women (n = 6,120) during conscript selection. The panels reflect treadmill vs. 3,000 m run (a), push-ups vs seated medicine ball throw (b), vertical pull-ups (c), and standing long jump (d). The boxes cover the range from 25th to 75th percentiles, with the horizontal line indicating median. The whiskers represent the 10th and 90th percentiles.
Almost twice as many subjects overreported their pull-up performance compared to their standing long jump performance (). Furthermore, a higher proportion of women overreported their pull-up and standing long jump performance compared to men.
Table 3. Number (%) of subjects who underreported, correctly reported, or overreported their standing long jump and pull-ups performance, based on the difference between self-reported and objectively measured fitness during conscript selection.
Discussion
The present study found a significant association and agreement between self-reported and objectively measured endurance and muscle strength in young men and women. Yet, the magnitude of the reported correlation and kappa values showed large discrepancy depending on which tests were compared and whether men and women were analyzed separately or together. Among men and women with identical self-reported fitness, men performed considerably better in the corresponding objective measurements, and more women than men overreported their physical fitness levels.
When interpreting the results of the present study, it is important to keep in mind that two of the self-reported tests were not identical to the corresponding objective measurements. For endurance, self-reported 3,000 metre run was compared with a maximal treadmill test. This difference is probably of little importance, as they both measure relative VO2max with approximately similar accuracy (Aandstad, Citation2021a; Aandstad & Hageberg, Citation2019). In contrast, it is more problematic to compare self-reported push-ups with objectively measured seated medicine ball throw. While push-up is a muscular endurance test, the medicine ball throw is a test of maximal muscular power. Moreover, the subject’s body is used as the resistance in push-ups, while the medicine ball throw includes moving external load. Such fundamental differences will naturally weaken the relationship between the two tests (Aandstad, Citation2020; Vanderburgh, Citation2008). The Norwegian Armed Forces decided not to use the treadmill test and the seated medicine ball throw as part of the selection step one because the tests require special equipment and are difficult to carry out at home.
Regarding the Spearman correlation analyses, the highest value was found for self-reported vs. objectively measured pull-ups (rs = 0.82 for men and women together). Also, the self-reported 3,000 metre test and the standing long jump test demonstrated high association against their corresponding objective measurements (rs > 0.70). These correlation coefficients were reduced when splitting the analyses by sex and could in most cases be interpreted as moderate. Lower correlation values are natural as sex-separate analyses likely produce smaller variance in the data sets (Altman, Citation1991; Atkinson & Nevill, Citation2001). The association between self-reported push-ups vs. objectively measured medicine ball throw demonstrated low correlation coefficients in both men and women (rs = 0.29). This is not surprising considering the inherent differences between these two tests, as explained above. It is also worth noticing that all self-reported tests correlated significantly with all objective tests, even with rs values as low as 0.14. This illustrates that a significant association is not proof of good relationship, but merely reflects the high sample size in the current study.
It was only possible to conduct the kappa analyses for the two tests that were identical in the self-reported and the objective measurements (i.e. pull-ups and standing long jump). While all kappa values were significant, they only suggested “fair” or even “poor” agreement according to the defined thresholds (Altman, Citation1991). This is partly in conflict with the interpretation of the correlation coefficients in the present study. However, statisticians emphasize that absolute definitions for correlation and kappa values are not really possible (as the thresholds are arbitrary), and that the values must be interpreted in context and on its own merits (Altman, Citation1991). Together with the fact that correlation reflects association, while kappa reflects agreement, these are likely reasons for the seemingly discrepancy.
A previous meta-analysis based on 28 studies reported a mean correlation coefficient of 0.38 between self-perceived and objectively measured physical fitness (Germain & Hausenblas, Citation2006). The analysis revealed large inter-study variations, which are likely caused by factors such as sample heterogeneity and variations in the self-perceived and objective methods. A study by Riley et al. (Citation2005) is particularly interesting as comparison to the present study. Here, U.S. Marine Corps male recruits were first asked how many pull-ups they could complete; this capacity was subsequently tested objectively a month later. This produced a correlation coefficient of 0.72, which is almost identical to the observed value for pull-ups among males in the present study (0.70). Other relevant validation studies of self-reported physical fitness have typically reported correlation coefficients between 0.4 and 0.7 against objective measurements (Keith et al., Citation2012; Mikkelsson et al., Citation2005; Obling et al., Citation2015; Petersen et al., Citation2021; Stefan et al., Citation2019). While comparing correlation coefficients among different studies is complicated, the overall impression is that the current study demonstrated similar or somewhat higher associations between self-reported and objective fitness measurements compared to previously published data. Yet, the kappa analyses suggested an opposite conclusion, as the present study produced similar or lower Kw values compared to relevant previous studies (De Moraes, Vilanova-Campelo, Torres-Leal, & Barbosa Carvalho, Citation2019; Jensen et al., Citation2018; Obling et al., Citation2015; Petersen et al., Citation2021).
An interesting finding in this study was that among men and women indicating similar self-reported fitness level, men performed much better than women on the corresponding objective measurement. For most tests and fitness categories, this difference can be interpreted as large (effect size ≥ 0.80). The largest difference between sexes was found for self-reported push-ups vs. objectively measured seated medicine ball throw. As previously mentioned, such a comparison is problematic since these tests measure different physiological characteristics, and because the difference in medicine ball throw performance is particularly high between men and women (Aandstad, Citation2021b). Still, the other comparisons also produced large sex-related effect sizes. As an example, among men and women who indicated they could perform 10 or more vertical pull-ups, the corresponding mean objectively measured numbers of pull-up repetitions were 10.6 and 4.5 in men and women, respectively (effect size 1.5). Moreover, almost three out of four women performed fewer objective pull-ups compared to their self-reported number of repetitions, while the same applied to 44% of the men. Yet, while more women (37%) than men (23%) also overreported their standing long jump performance, it was in fact more common for both sexes to underreport their standing long jump performance.
Some earlier studies have concluded that both sexes are equally good at estimating their fitness level, based on similar correlation coefficients between self-perceived and objectively measured fitness in men and women (Germain & Hausenblas, Citation2006). However, a systematic bias (under or overreporting) will not be detected via correlation analyses. Previous studies reporting this type of bias have generally concluded that more men than women overreport their self-perceived fitness level (Obling et al., Citation2015; Petersen et al., Citation2021). The opposite finding in the present study was therefore somewhat surprising. Most remarkable were the high effect sizes for the difference in objectively measured fitness between men and women indicating similar self-related fitness. The reason for this is unknown, but among subjects who indicated high level of self-reported fitness, men tended to perform to their reported fitness level while a larger proportion of women did not. Among subjects who indicated moderate or low self-reported fitness, men tended to overperform while women performed as self-reported. While this certainly produces large sex-related effect sizes, it does not answer why there is a systematic bias concerning under and overreporting of fitness level. One reason could be related to motivation for doing military service. Køber (Citation2016) has shown that women at selection step one report lower motivation for doing conscript service compared to men. More women than men are also unmotivated for service among those selected to step two. The military emphasizes that all subjects should do their best during the objective tests at selection step two. It may still be hypothesized that unmotivated subjects (i.e. more women than men) are somewhat more likely to underperform on purpose at step two, and that this partly explains the higher levels of over-reporting in women. Yet, by using this rationale we would also assume that more women than men underreport their fitness level at selection step one to lower their chance of being selected to step two. The latter is apparently in conflict with the current study’s findings. Unfortunately, no data on motivation were available in the present study. It is therefore unknown whether or how this factor played a role in the observed sex differences pertaining under and overreporting of fitness level. Another potential reason could be that men and women develop their fitness level in opposite directions during the ≤ 18 months period between selection step one and step two. Studies have shown that relative VO2max and relative muscular strength tend to increase in men during late adolescence, while the opposite is evident for young women (Castro-Piñero et al., Citation2009; Ortega et al., Citation2011a; van der Steeg & Takken, Citation2021). Hence, this may partly explain the large sex-related effect sizes observed in the data.
The present data demonstrate that the step one selection system used by the Norwegian Armed Forces is useful at the group level to detect physical fitness in prospective soldiers, but a potential high degree of error should be acknowledged at the individual level. Moreover, a replacement for the step one push-up test should be considered if the intention is to use this test as a surrogate measure of upper body maximal power. The current approach of self-testing may also be a feasible alternative in other situations where mass-screenings are required (e.g. population health studies), especially if the subjects are young, healthy, and motivated to carry out the tests. A disadvantage of home-testing is that it puts a burden of time and physical stress on the respondent which may lead to lower attendance rate.
Study strengths and limitations
The present study comprises an unusual large sample size, and with both sexes included. Many previous studies have investigated association (correlation) only, while the present study also includes analyses of agreement and bias. Moreover, validated maximal tests of cardiorespiratory endurance, muscular endurance, and muscular power, were used for the objective measurements. The study is novel in the sense that the subjects were asked to carry out field tests at home and then subsequently report the results. This differs from previous studies which have often used generic questions like “how do you rate your own physical fitness?”
There are also some limitations associated with the current study. Although the subjects were requested to carry out fitness tests at home, it is likely that some simply estimated their performance level without doing the tests. Unfortunately, this proportion is unknown. Another potential limitation is related to individual motivation for doing military service. It is conceivable that some highly motivated subjects intentionally overreported their fitness level to try to influence the selection step one outcome, while less motivated subjects underreported and underperformed during step one and two, respectively. If so, this will impact the analyses and the interpretation of the observed relationships. The long duration (1–18 months) between step one and two should also be mentioned. In some subjects, physical fitness will indeed change between step one and two, but the analyses will interpret this difference as lack of agreement. It can be hypothesized that the association and agreement would be higher if shorter time were allocated between the two measurement periods. Finally, a larger proportion of moderate-to-high fit subjects are included in the present study, as many of those indicating low fitness level were screened out after step one (Aandstad, Citation2021b). While this certainly leads to higher mean fitness levels in the studied sample compared to the general population, it is less clear how correlation coefficients and kappa values were affected by this selection. Thus, it is unknown whether the results concerning relationships are representative for the entire population of 17–18 years old men and women.
Conclusions
The current study has investigated the validity of self-reported fitness based on physical fitness tests carried out at home. The correlation analyses indicate that this method is potentially valid at group level, but the low kappa values is a concern. The study also demonstrated that more women than men overreported their actual fitness level. This finding contradicts most previous studies and may be worthwhile following up in future research.
Supplemental Material
Download PDF (250.8 KB)Acknowledgements
The author would like to thank retired Major Aslak Brekke from the Norwegian Armed Forces HR and Conscription Centre for extracting the data from the P3 database. Gratitude is also owed to Elena V. Aandstad, MD, for language revision.
Disclosure statement
No potential conflict of interest was reported by the author(s).
Additional information
Funding
References
- Aandstad, A. (2015). Styrketesting på sesjon. Gir medisinballstøt, stille lengde og pull-ups et mer valid mål på styrke enn dagens isometriske bryst- og beinpress? [Strength testing at conscript selection: Will medicine ball throw, standing long jump and pull-ups produce more valid measurements of muscle strength compared to isometric chest and leg press?]. Oslo, Norway: Norwegian School of Sport Sciences, Defence Institute.
- Aandstad, A. (2020). Association between performance in muscle fitness field tests and skeletal muscle mass in soldiers. Military Medicine, 185(5-6), e839–e846.
- Aandstad, A. (2021a). Estimation of maximal oxygen uptake from the 3,000 m run in adult men and women. Journal of Sports Sciences, 39(15), 1746–1753.
- Aandstad, A. (2021b). Reference data on anthropometrics, aerobic fitness and muscle strength in young Norwegian men and women. European Journal of Applied Physiology, 121(11), 3189–3200.
- Aandstad, A., & Hageberg, R. (2019). Reliability and validity of a maximal treadmill test for predicting aerobic fitness in Norwegian prospective soldiers. Military Medicine, 184(3-4), e245–e252.
- Aandstad, A., & Kirknes, J. (2018). Validity and reliability of muscle strength field tests for use in the Norwegian Armed forces. 3rd International conference on physical employment standards, Portsmouth, England.
- Altman, D. (1991). Practical statistics for medical research. London, Chapman & Hall.
- Åstrand, P. O., Rodahl, K., Dahl, H. A., & Strømme, S. B. (2003). Textbook of work physiology. Physiological bases of exercise (4th ed.). Champaign, IL, Human Kinetics.
- Atkinson, G., & Nevill, A. M. (2001). Selected issues in the design and analysis of sport performance research. Journal of Sports Sciences, 19(10), 811–827.
- Brenner, H., & Kliebsch, U. (1996). Dependence of weighted kappa coefficients on the number of categories. Epidemiology, 7(2), 199–202.
- Caspersen, C. J., Powell, K. E., & Christenson, G. M. (1985). Physical activity, exercise, and physical fitness: Definitions and distinctions for health-related research. Public Health Reports, 100(2), 126–131.
- Castro-Piñero, J., Gonzalez-Montesinos, J. L., Mora, J., Keating, X. D., Girela-Rejon, M. J., Sjöström, M., Ruiz, J. R. (2009). Percentile values for muscular strength field tests in children aged 6 to 17 years: Influence of weight status. Journal of Strength and Conditioning Research, 23(8), 2295–2310.
- Cohen, J. (1988). Statistical power analysis for the behavioral sciences (2nd ed.). New York, NY, Lawrence Erlbaum Associates.
- De Moraes, A. C. F., Vilanova-Campelo, R. C., Torres-Leal, F. L., & Barbosa Carvalho, H. (2019). Is self-reported physical fitness useful for estimating fitness levels in children and adolescents? A reliability and validity study. Medicina, 55, 286.
- Frantzen, H.-A. (2020). Reglement for fysisk test [Regulations on physical fitness testing]. Oslo, Norway: The Norwegian Defence University College.
- Germain, J. L., & Hausenblas, H. A. (2006). The relationship between perceived and actual physical fitness: A meta-analysis. JASP, 18(4), 283–296.
- Hinkle, D. E., Wiersma, W., & Jurs, S. G. (2003). Applied statistics for the behavioral sciences (5th ed.). Boston, MA, Houghton Mifflin.
- Jensen, K. G., Rosthoj, S., Linneberg, A., & Aadahl, M. (2018). The association between self-rated fitness and cardiorespiratory fitness in adults. International Journal of Sports Medicine, 39(6), 419–425.
- Keith, N. R., Stump, T. E., & Clark, D. O. (2012). Developing a self-reported physical fitness survey. Medicine & Science in Sports & Exercise, 44(7), 1388–1394.
- Knapik, J. J., Jones, B. H., Reynolds, K. L., & Staab, J. S. (1992). Validity of self-assessed physical fitness. American Journal of Preventive Medicine, 8(6), 367–372.
- Køber, P. K. (2016). Fra sesjonsplikt til verneplikt for kvinner – motivasjon og seleksjon på sesjon del 1 for årskullene 1992–1997 [From obligatory conscript selection to obligatory conscript service for women - motivation at selection step one for subjects born 1992–1997]. Report no. 2016/00014. Kjeller, Norway: Norwegian Defence Research Establishment.
- Kodama, S., Saito, K., Tanaka, S., Maki, M., Yachi, Y., et al. (2009). Cardiorespiratory fitness as a quantitative predictor of all-cause mortality and cardiovascular events in healthy men and women: A meta-analysis. JAMA, 301(19), 2024–2035.
- Liu, Y., Lee, D. C., Li, Y., Zhu, W., Zhang, R., et al. (2019). Associations of resistance exercise with cardiovascular disease morbidity and mortality. Medicine & Science in Sports & Exercise, 51(3), 499–508.
- Mikkelsson, L., Kaprio, J., Kautiainen, H., Kujala, U. M., & Nupponen, H. (2005). Associations between self-estimated and measured physical fitness among 40-year-old men and women. Scandinavian Journal of Medicine and Science in Sports, 15(5), 329–335.
- Nindl, B. C., Alvar, B. A., Dudley, R., Favre, M. W., Martin, G. J., et al. (2015). Executive summary from the national strength and Conditioning association's second blue ribbon panel on military physical readiness: Military physical performance testing. Journal of Strength and Conditioning Research, 29(Suppl 11), S216–S220.
- Obling, K. H., Hansen, A. L., Overgaard, K., Normann, K., Sandbaek, A., et al. (2015). Association between self-reported and objectively measured physical fitness level in a middle-aged population in primary care. Preventive Medicine Reports, 2, 462–466.
- Ortega, F. B., Artero, E. G., Ruiz, J. R., Espana-Romero, V., Jimenez-Pavon, D., et al. (2011a). Physical fitness levels among European adolescents: The HELENA study. British Journal of Sports Medicine, 45(1), 20–29.
- Ortega, F. B., Ruiz, J. R., Espana-Romero, V., Vicente-Rodriguez, G., Martinez-Gomez, D., et al. (2011b). The International fitness scale (IFIS): usefulness of self-reported fitness in youth. International Journal of Epidemiology, 40(3), 701–711.
- Petersen, C. B., Eriksen, L., Dahl-Petersen, I. K., Aadahl, M., & Tolstrup, J. S. (2021). Self-rated physical fitness and measured cardiorespiratory fitness, muscular strength, and body composition. Scandinavian Journal of Medicine & Science in Sports, 31(5), 1086–1095.
- Riley, D. J., Wingard, D., Morton, D., Nichols, J. F., Ji, M., et al. (2005). Use of self-assessed fitness and exercise parameters to predict objective fitness. Medicine & Science Sports Exercise, 37(5), 827–831.
- Stefan, L., Paradzik, P., & Sporis, G. (2019). Sex and age correlations of reported and estimated physical fitness in adolescents. PLoS One, 14(7), e0219217.
- Teien, H. K., Aandstad, A., Gulliksrud, K., Kåsin, J., Køber, P. K., et al. (2019). Are the most suitable personnel selected for the Armed Forces? A description of the current selection process for the compulsory military service. Report no. 19/01738. Kjeller, Norway: Norwegian Defence Research Establishment.
- Tjenestereglement for Forsvaret. Gruppe 43 [Service manual for the Norwegian Armed Forces. Group 43]. (1998). Norwegian Armed Forces.
- Vanderburgh, P. M. (2008). Occupational relevance and body mass bias in military physical fitness tests. Medicine & Science in Sports & Exercise, 40(8), 1538–1545.
- van der Steeg, G. E., & Takken, T. (2021). Reference values for maximum oxygen uptake relative to body mass in Dutch/flemish subjects aged 6-65 years: The LowLands fitness registry. European Journal of Applied Physiology, 121(4), 1189–1196.
- Vanhees, L., Lefevre, J., Philippaerts, R., Martens, M., Huygens, W., et al. (2005). How to assess physical activity? How to assess physical fitness? European Journal of Cardiovascular Prevention & Rehabilitation, 12(2), 102–114.