
 ?Mathematical formulae have been encoded as MathML and are displayed in this HTML version using MathJax in order to improve their display. Uncheck the box to turn MathJax off. This feature requires Javascript. Click on a formula to zoom.
ABSTRACT
In a recent randomised trial investigating running shoe cushioning, injury risk was greater in recreational runners who trained in the shoe version with greater cushioning stiffness (Stiff) compared to those using the Soft version. However, vertical impact peak force (VIPF) was lower in the Stiff version. To investigate further the mechanisms involved in the protective effect of greater cushioning, the present study used an intra-subject design and analysed the differences in running kinematics and kinetics between the Stiff and Soft shoe versions on a subsample of 41 runners from the previous trial. Data were recorded in the two shoe conditions using an instrumented treadmill at 10 km.h−1. VIPF was confirmed to be lower in the Stiff version compared to the Soft version (1.39 ± 0.25 vs. 1.50 ± 0.25 BW, respectively; p = 0.009, d = 0.42), but not difference was observed in vertical loading rate (p = 0.255 and 0.897 for vertical average and instantaneous loading rate, respectively). Ankle eversion maximal velocity was not different (p = 0.099), but the Stiff version induced greater ankle negative work (−0.55 ± 0.09 vs. −0.52 ± 0.10 J.kg−1; p = 0.009, d = 0.32), maximal ankle negative power (−7.21 ± 1.90 vs. −6.96 ± 1.92 W.kg−1; p = 0.037, d = 0.13) and maximal hip extension moment (1.25 ± 0.32 vs.1.18 ± 0.30 N.m.kg−1; p = 0.009, d = 0.22). Our results suggest that the Stiff shoe version is related to increased mechanical burden for the musculoskeletal system, especially around the ankle joint.
Trial registration: ClinicalTrials.gov identifier: NCT03115437.
Introduction
During shod running, the majority of runners adopt a heel-toe style during stance phase, which has been associated with greater landing impacts when compared to a forefoot strike pattern (Lieberman et al., Citation2010). Commonly investigated factors for the measurement of landing impacts in running biomechanics are impact peak forces and loading rate (“load” being defined in this study as the force applied on the body). As these factors have been associated with the development of specific running injuries such as e.g. stress fracture (Davis, Bowser, & Mullineaux, Citation2016; Milner, Ferber, Pollard, Hamill, & Davis, Citation2006) or plantar fasciitis (Pohl, Hamill, & Davis, Citation2009), different solutions of shoe cushioning have been proposed to attenuate landing impacts.
Despite large variations in shoe cushioning systems, results of in vitro experiments are generally consistent with the theory, which says that more compliant systems are characterised by a lower impact peak force, lower loading rate, and longer time to peak (Shorten & Mientjes, Citation2011). However, many in vivo experiments reported greater impact peak forces and/or loading rate in running shoes with greater cushioning when compared to traditional running shoes (Baltich, Maurer, Nigg, & Garcia Aznar, Citation2015; Chan et al., Citation2018; Kulmala, Kosonen, Nurminen, & Avela, Citation2018). These findings may appear counterintuitive with regards to the initial goal of the cushioning systems, but an explanation for this shoe cushioning paradox has previously been provided (Shorten & Mientjes, Citation2011). Frequency domain analysis revealed that the first peak of the vertical ground reaction force (GRF) is a superimposition of low frequency (non-impact) load components on the “true” high-frequency impact peak force. Softer shoes tend to attenuate the magnitude of the high-frequency impact peak, but also delay its occurrence. As a result, the relative contribution of the low-frequency load component to the first peak is higher, which results in a higher vertical impact peak forces (VIPF, which is the sum of the two components) when running in shoes with greater cushioning (Shorten & Mientjes, Citation2011). Furthermore, impact peak forces and/or loading rate showed poor correlation with tibial loading, which suggests that these GRF metrics should not be interpreted as indicators of musculoskeletal loading (Matijevich, Branscombe, Scott, Zelik, & Grabowski, Citation2019). Lastly, GRF metrics may only reveal part of the reality, as alterations in running kinematics may affect joint moments, independently of the magnitude of the GRF.
Investigations combining advanced biomechanical analyses with long-term prospective follow-ups of a large number of runners are required to improve knowledge on the relationship between shoe cushioning, running biomechanics and injury risk (Theisen, Malisoux, Gette, Nührenbörger, & Urhausen, Citation2016). In a recent randomised trial including more than 800 recreational runners, the shoe version with lesser cushioning (termed here the “Stiff” version) was associated with a greater risk of injury (Malisoux, Delattre, Urhausen, & Theisen, Citation2020). To better understand the mechanism that might explain the effect of shoe cushioning on injury risk, all runners were tested in the allocated study shoes at baseline on an instrumented treadmill. In line with previous findings (Baltich et al., Citation2015; Chan et al., Citation2018; Kulmala et al., Citation2018), lower VIPF was observed in the Stiff shoe version (Malisoux et al., Citation2021). Given that the suitability of VIPF and loading rate to assess loading of internal structures and shoe impact attenuation has been questioned (Matijevich et al., Citation2019; Shorten & Mientjes, Citation2011), a detailed comparative analysis of running biomechanics in the two shoe versions used for the trial is needed.
The aim of the present study was therefore to investigate the differences in running kinematics and kinetics between these two shoe versions in leisure-time runners. Based on previous literature (Kulmala et al., Citation2018; Malisoux et al., Citation2021), we propose two main hypotheses: we hypothesised that lower VIPF, and vertical loading rate would be observed in the Stiff shoe version when compared with the Soft shoe version. Furthermore, given that maximal rearfoot eversion velocity has previously been shown to be greater in running shoes with softer midsole (De Wit, De Clercq, & Lenoir, Citation1995; MacLean, Davis, & Hamill, Citation2009), we also hypothesised that ankle eversion maximal velocity would be lower in the stiffer shoe version. We do not advance any hypotheses regarding the other biomechanical variables examined. Instead, our analysis of these variables will be exploratory and aims to generate new hypotheses to be tested and confirmed in future research on mechanisms that may explain the protective effect of shoe cushioning on injury risk. Consequently, we also investigated potential differences in spatiotemporal variables, ankle, knee and hip joints kinematics (sagittal and frontal planes), as well as the usual GRF metrics, and moment, work and power around the lower limb joints.
Materials and methods
The protocol was approved by the National Ethics Committee (ref. 201701/02 version 1.1) and registered on www.clinicaltrials.gov (identifier: NCT03115437). All volunteers received a full description of the protocol and provided written informed consent for participation. The present intra-subject experiment is an ancillary study to a previously published participant- and assessor-blinded randomised trial on the association between shoe cushioning, body mass, running biomechanics and the risk of running-related injuries (Malisoux, Delattre, Urhausen, & Theisen, Citation2017).
Study participants
Participants from the trial were eligible for an additional biomechanical test if they fulfilled the following inclusion criteria: reported usual running speed of 9–11 km.h−1 and free of any pain or injury that could have impaired their running training or biomechanics over the previous month. Forty-two participants volunteered for the study. A sample size calculation was used to determine the number of participants needed to show any significant difference in VIPF between shoe conditions. With an alpha of 0.05 and a power of 80%, an average difference between shoe conditions of 0.16 BW (body weight), and a standard deviation of 0.25 BW (Baltich et al., Citation2015), the total number of participants required is 39.
Conditions
The study shoes were anonymised prototypes provided by a renowned sport equipment manufacturer (Decathlon SA, Villeneuve-d’Ascq, France). They came in two identical versions, except for their cushioning properties: high stiffness and low stiffness, hereafter named Stiff and Soft versions, respectively. Shoe stiffness properties at the heel were characterised by the manufacturer on a set of 40 shoes (10 pairs per condition) using a gravity-driven impact test (ASTM F1976-13) (ASTM International, Citation2013) after being conditioned for 24 hours in the laboratory (temperature: 23 ± 2 C; humidity: 50% ± 5%). The impact test was performed at the rear-part of the shoes and consisted in the 50 mm free fall of a 8.5 kg mass (diameter 45 mm). For each shoe, 30 load/unload cycles were applied, and the last five cycles were kept for analysis. Recorded force and displacement enabled to compute the global stiffness (i.e. the slope of the force-displacement curve during loading phase), which was averaged over the five analysed cycles. The global stiffness at the heel differed by 35.4% (94.9 ± 5.9 and 61.3 ± 2.7 N.mm−1 in the Stiff and Soft shoe versions, respectively), while the dissipated energy differed by 4.6% (2.37 ± 0.04 and 2.26 ± 0.02 Joule in the Stiff and Soft versions, respectively). The shoe mass was 354 ± 4 g and 320 ± 3 g in the Stiff and Soft versions, respectively. The stack height at the heel was 34 mm (5, 24, and 5 mm for the outsole, midsole, and insole, respectively) and the heel to-toe drop was 10 mm in both versions (size 43).
Procedures
All data were collected during a single session at the laboratory. Participants were informed that they would be tested in two footwear conditions in a random order, which across all participants was previously defined and counterbalanced by a statistician not involved in any other part of the study. The participants were blinded regarding the shoe version order. Height, body mass, and leg length were measured prior to warm-up. The running test was performed on an instrumented split-belt treadmill (M-Gait, MotekForcelink, The Netherlands). The protocol consisted of a 3-min warm-up, followed by an 8-min habituation phase in the respective shoe version and a subsequent 1-min data collection phase at 10 km.h−1. The running test was repeated with the second shoe version after 15 minutes of recovery.
Biomechanical measurements
A high-speed (200 Hz) motion analysis system consisting of four CX1 3D scanner units (CODAmotion, Charnwood Dynamics, UK) was used to track hip, knee and ankle joints as well as shoe/ground angles during the tests. Analogue signals from the instrumented treadmill force plates were recorded by the motion capture system at a 1 kHz sampling rate, allowing for synchronised kinetic and kinematic recordings. The participants were equipped with markers to yield a model consisting of seven rigid six degrees-of-freedom segments representing feet, shanks, thighs, and pelvis with the segment definitions and joint centre locations according to the IOR Lower Extremity Model (documentation C-MW, Citation2020). Anatomical landmarks on both legs were digitised as virtual markers using a calibrated pointer device: medial and lateral femoral condyles and malleoli, fibular head, tibial tuberosity, first metatarsal head and calcanei prominent rear aspect. In total, for both lower limbs, the marker set consisted of 16 virtual markers and 28 tracking markers (anterior & posterior superior iliac spines, 4-marker clusters on thighs and shanks, second & fifth metatarsal heads, medial & lateral tuber calcanei areas) to completely define and track selected model's body segments. A static calibration record was performed with the participant standing on the treadmill in a neutral position in the running direction. Data acquisition and file export were performed with the Odin software (version 2.00.04.06, CODAmotion).
Signal processing
The motion capture and force plate recordings were imported into Visual3D (Version 6.01.30, C-Motion, USA), where the IOR Lower Extremity Model (documentation C-MW, Citation2020) was constructed and scaled to each participant based on the static recording. All computations followed the inverse dynamics approach using Newton-Euler equations, X-Y-Z Cardan sequence (which correspond to flexion/extension, abduction/adduction, internal/external rotation, respectively) and resolution in the proximal segment coordinate system. The internal moments were reported (Derrick et al., Citation2020). Participant's body weight (BW) was obtained by the average vertical force signal (Fz) recorded during 5 seconds of quiet stance. Prior to any computational steps, marker trajectory data was gap-filled where necessary using a 3rd polynomial order least square interpolation with a maximum gap size of 20 frames. A bidirectional low-pass filter (cut-off frequency of 10 Hz, 4th order zero phase Butterworth) was then equally applied to both, forces and marker trajectories (Kristianslund, Krosshaug, & van den Bogert, Citation2012). A second computation of GRF metrics (i.e. VIPF, Steps with VIPF, Time to VIPF, Peak vertical force, Vertical average loading rate, Vertical instantaneous loading rate and Vertical stiffness) was carried out with a different cut-off frequency of 30 Hz and by calling a custom-written Matlab script (Matlab R2014a, MathWorks, USA) from Visual3D. This second set of data was only used for the analysis of the force-only variables.
Initial contact (IC) and toe-off events were identified by Fz exceeding or falling below a 20-N threshold (which was determined based on the properties of the treadmill). Contact time was defined as the time interval between IC and toe-off. Step length was computed based on cadence (steps.min−1) and the measured belt speed. Peak vertical force (PVF) was defined as the highest Fz-value recorded during stance phase. VIPF was defined as the first peak of the Fz curve (Fzpeak1) in those steps displaying two peaks in the Fz-record. If during a given step only one peak was present, that peak was defined as PVF, and the step was marked as having no VIPF. All curves with corresponding peaks (VIPF and PVF) were visually inspected for each participant and manually confirmed. Vertical instantaneous loading rate (VILR) was calculated as , where (tIC < t < tVIPF) for steps with a VIPF and where (tIC < t < tPVF) for steps without a VIPF. Vertical average loading rate (VALR) was calculated between 20 and 80% of the period between IC and VIPF, or between IC and PVF for steps without VIPF. Vertical oscillation of the centre of mass was calculated as the difference between the minimal and maximal position of the kinematic model's centre of mass in vertical direction during the step. Vertical stiffness was calculated as the ratio of peak vertical GRF and the downward displacement of the centre of mass from foot strike to the lower position (Serpell, Ball, Scarvell, & Smith, Citation2012).
Joint angles were defined with the distal segment expressed relative to the proximal segment. The ankle angle was normalised under the assumption of the foot segment being parallel to the laboratory floor in both shoe models. The normalisation was achieved by projecting the tracking markers applied on the shoes to the floor during calibration records (documentation C-MW, Citation2021). Any potential offset due to marker placement between the two shoe version trials was hereby removed yielding normalised ankle flexion/extension and inversion/eversion angles. The same normalised foot segment served for the shoe-ground angle computations. Positive values indicate a rearfoot strike pattern (shoe-ground angle), ankle dorsiflexion, knee flexion, hip flexion, ankle inversion, knee adduction, and hip adduction.
The joint kinetics and the GRF variables were normalised by the participant's body mass and weight, respectively. Joint angles, net joint moments, net joint powers, and GRF were normalised to the gait cycle over 101 time points. To enable statistical comparison, the variables of interest were calculated on each curve (i.e. each gait cycle available for each subject), and then averaged per subject and condition. Joint powers were calculated as the scalar product of net joint moments and joint angular velocities in the sagittal plane. Net joint work was calculated as the area under the joint power-time curves. Data from both sides were averaged.
Participants were classified as rearfoot (dorsiflexion > 5°), mid-foot (plantar and dorsiflexion < 5°) and fore-foot (plantar flexion > 5°) runners based on the ankle angle at initial contact (Fuller, Buckley, Tsiros, Brown, & Thewlis, Citation2016).
Statistics
A repeated measures analysis of variance (ANOVA) was used for the comparison of the means between the test conditions. The Benjamini-Hochberg procedure was applied to correct p-values for multiple statistical comparisons (Benjamini & Hochberg, Citation1995). The significance level was set at p < 0.05. Omega squared (ω2) were used to define the proportion of variance associated with shoe version (Richardson, Citation2011). ω2 values were classified as small (<0.06), medium (0.06 to <0.14) or large (≥0.14). Additionally, effect sizes were reported for all significant comparisons using Cohen's d (Cohen, Citation1988), and were interpreted as negligible (0 to <0.15), small (0.15 to <0.40), medium (0.40 to <0.75), large (0.75 to <1.10), and very large (≥1.10). The Friedman test was used to compare the two test conditions for non-normally distributed variables. The proportion of runners classified as rearfoot or midfoot strikers in the two conditions was compared using a Chi-square test. All analyses were performed using STATA/SE V.15 (StataCorp LLC, College Station, USA).
Results
Participants
From the 42 volunteers recruited for the experiment, 41 runners (33 males, 8 females) were included in the analysis, as one volunteer did not feel comfortable with the experimental equipment. Average characteristics of the participants were as follow: age 42.3 ± 9.8 years, height 176 ± 9 cm and body mass 74.2 ± 12.6 kg. The number of steps analysed per data record was 165 ± 9 steps.
Running kinetics
VIPF was lower in the Stiff shoe version (95% CI: 0.06–0.15 BW; −7.3%; p = 0.009; medium effect, d = 0.42), but the proportion of steps with detectable VIPF was higher (p = 0.009) and the time to VIPF was shorter (95% CI: 1.8–7 milliseconds; −8.7%; p = 0.014; medium effect, d = 0.42). PVF was not affected by shoe version (). No difference was observed in VILR, VALR and Vertical stiffness ().
Figure 1. Ensemble average curves (±1 SD) for vertical (left) and antero-posterior (right) ground reaction force signals in the Soft and Stiff shoe versions during stance phase (n = 41 test participants).
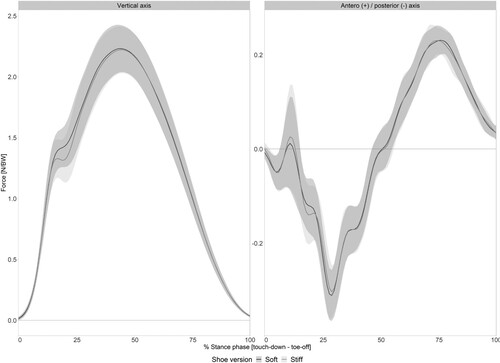
Table 1. Descriptive and inferential statistics for the kinetic variables in both shoe conditions (n = 41).
No difference between shoe conditions was observed for Maximal ankle plantarflexion and dorsiflexion moments, as well as for Maximal knee extension and abduction moments. The Stiff shoe version gave rise to a higher Maximal internal hip extension moment (95% CI: 0.03–0.10 N.m.kg−1; +5.9%; p = 0.009; small effect, d = 0.22), but no shoe version effect was observed on Maximal hip abduction moment.
Greater Ankle negative work was observed in the Stiff shoe version (95% CI: 0.02–0.04 J.kg−1; +5.8%; p = 0.009; small effect, d = 0.32), but no difference was observed in Ankle positive work, nor for work around the knee and hip joints.
Greater Maximal ankle negative power was observed in the Stiff shoe version (95% CI: 0.08–0.43 W.kg−1; +3.6%; p = 0.037; negligible effect, d = 0.13), while Maximal ankle positive power and power around the knee and hip joints were not affected by shoe conditions (see also Supplemental online material 1).
Running kinematics
No shoe effect was observed for Step cadence, Contact time, Step length and Vertical oscillation (). At initial contact, Shoe/ground angle, Ankle dorsiflexion angle, Knee flexion angle and Hip flexion angle were not affected by shoe versions either (see also ). No participant used a forefoot strike, six runners (15%) used a mid-foot strike in both shoe versions, and 35 (85%) used a rearfoot strike in both shoe versions. None of the participants changed their strike pattern between shoe versions (p = 1.000).
Figure 2. Ensemble averaged curves (±1 SD) for Ankle (top), Knee (middle) and Hip (bottom) joint angles in the sagittal (left) and frontal (right) planes in the Soft and Stiff shoe versions during stance phase (n = 41 test participants).
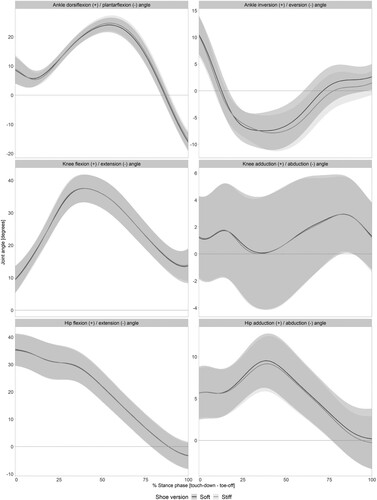
Table 2. Descriptive and inferential statistics for the spatiotemporal and kinematic variables in both shoe conditions (n = 41).
Maximal ankle dorsiflexion angle was greater (95% confidence interval [CI]: 0.4–0.9°; +2.5%; p = 0.009) in the Stiff shoe version, but the effect was small (d = 0.25). Shoe version did not significantly affect the other maximal joint angles (see also ).
No difference was observed in Ankle eversion range of motion during stance phase between the shoe conditions. Ankle eversion maximal velocity tended to be lower in the Stiff shoe version (95% CI: 2–24°.s−1; −4.0%; small effect, d = 0.15), but the difference was not significant (p = 0.099).
Discussion
The present study aimed to investigate the differences in running kinetics and kinematics between two shoe versions with markedly different cushioning stiffness (i.e. Stiff versus Soft versions) in leisure-time runners. In a previous large randomised trial with a 6-month follow-up, the recreational runners who had received the Stiff shoe version were at greater injury risk compared to those using the Soft shoe version (Hazard ratio = 1.52; 95% CI = 1.07–2.16) (Malisoux et al., Citation2020). Additionally, data on impact forces collected at baseline from all 848 participants involved in the trial (Malisoux et al., Citation2017) revealed lower VIPF values in the Stiff shoe version (Malisoux et al., Citation2021). These counterintuitive results suggest that the beneficial effect of softer shoes on injury risk could not be explained by attenuated VIPF, and that functional explanations still have to be uncovered. Therefore, we designed the present intra-subject study on a sub-cohort from the previous trial to analyse in greater depth the running biomechanics induced by the two shoe versions. The present results confirmed that VIPF was lower in the stiffer shoe, in accordance with our first main hypothesis, while no difference was observed for vertical (instantaneous and average) loading rate. Our secondary hypothesis was rejected as no difference was observed for ankle eversion velocity between the two shoe versions. On a mere explorative level, the present study revealed that Maximal ankle dorsiflexion angle, Maximal hip extension moment, Ankle negative work and Maximal ankle negative power were greater with the Stiff shoe version. One may argue that the size of these effects was small but running is characterised by the repetition of many almost identical movements. Thus, any minor alteration in the lower limb net joint kinetics could lead to a clinically relevant difference in the burden for the musculoskeletal system over thousands of steps if these acute adaptations prevail throughout the training session. Finally, we also found a higher proportion of steps with detectable VIPF and shorter time to VIPF in the Stiff shoe version. This observation suggests that these GRF metrics may be more appropriate than VIPF to illustrate the relationship between shoe cushioning and injury risk, as VIPF was lower in the stiffer shoes.
The lower VIPF (−7.3%) observed in the Stiff compared to the Soft shoe version is consistent with the difference observed in a large randomised trial on 800+ recreational runners (−6.9%) comparing the same shoe prototypes (Malisoux et al., Citation2021). A plausible explanation for the lower VIPF observed in Stiff shoe version could be the lower relative contribution of the low-frequency load component to the first peak observed, compared to the Soft version (due to the earlier high-frequency impact peak occurrence) (Shorten & Mientjes, Citation2011). Similarly, other studies reported greater VIPF and/or VILR in highly cushioned shoe (e.g. Hoka One One Conquest or Clifton) compared to conventionally cushioned shoes (Chan et al., Citation2018; Kulmala et al., Citation2018; Pollard, Ter Har, Hannigan, & Norcross, Citation2018). This finding was attributed to a reduced leg compression and centre of mass descent during the stance phase in highly cushioned shoe (Kulmala et al., Citation2018). Greater leg stiffness during the landing phase induces a more rapid deceleration of the runner's body mass compared to more compliant landing with conventional (stiffer) shoes, and therefore lessens the impact attenuation effect provided by additional cushioning. Surprisingly, we did not observe any difference in vertical stiffness between the shoe versions in this study. One may speculate that the tested speed was too low, as the effect of cushioning on leg stiffness was only observed at a higher speed (14.5 km.h−1) (Kulmala et al., Citation2018).
We compared Maximal ankle eversion angle, Ankle eversion range of motion and Ankle maximal eversion velocity between the two shoe versions as these rearfoot kinematic variables have previously been associated with the risk for non-specific lower limb overuse injuries (Dowling et al., Citation2014). No difference was observed for the former two, which is consistent with a previous study where highly cushioned shoes did not influence peak rearfoot eversion compared to conventional cushioned shoes (Pollard et al., Citation2018). Previous studies showed that a greater maximal rearfoot eversion velocity was observed in runners with navicular stress fracture (Becker, James, Osternig, & Chou, Citation2018) and associated with the risk of exercise-related lower-leg pain (Willems et al., Citation2006). However, no difference in ankle eversion maximal velocity was observed between the shoe conditions here. Thus, it seems unlikely that Ankle eversion maximal velocity was related to the higher injury risk in the Stiff shoe version in our parent trial. Actually, rearfoot eversion is part of the normal foot motion when running with a rearfoot strike pattern (Nigg, Behling, & Hamill, Citation2019). One may speculate that a U-shape relationship exists between rearfoot eversion and injury risk, but more research is needed to solve this issue.
Highly cushioned shoes are used in an attempt to lower impact forces by lowering cushioning stiffness or oversizing cushioning material, such as in maximalist shoes. To the best of our knowledge, only few studies have investigated the effect of highly cushioned shoes on lower limb joint kinetics so far. A simulation study demonstrated the large role played by plantar flexors in shock absorption (Gerritsen, van den Bogert, & Nigg, Citation1995). In the present study, we found that Maximal ankle negative power and Ankle negative work were greater in the Stiff shoe version (3.6% and 5.8%, respectively) compared to the Soft version. Collectively, these results suggest greater burden (i.e. sagittal negative work and max power) around the ankle joint and illustrate its important role as an external shock attenuator. Ankle negative work cumulates two phases (see also Supplementary material 1: Ankle power) (Gerritsen et al., Citation1995). After touchdown, a rapid plantar flexion moment occurs, causing a rapid stretching and lengthening of the ankle-dorsiflexor muscle-tendon units and series elastic elements. Then, the ankle moves into greater ankle dorsiflexion, indicating stretching and lengthening of the ankle plantar-flexor muscle-tendon units and series elastic elements (Lai, Lichtwark, Schache, & Pandy, Citation2018). Greater Ankle negative work was previously reported in stiffer shoes when compared with conventional cushioned shoes in runners with a mid-foot or rearfoot strike pattern (Fuller et al., Citation2016). Therefore, there is converging evidence that greater shoe stiffness induces greater ankle negative work. This greater burden observed at the ankle joint in the Stiff shoe version could provide an explanation of a greater risk of musculoskeletal injury to the lower-limb in Stiff shoe version (Malisoux et al., Citation2020), although a specific relationship cannot be established based on the present design. Our observations are in line with a recent simulation study which showed that softer midsoles reduced joint contact forces and loading rates at the ankle, while joint reaction forces differed very little (Meardon, Willson, Kernozek, Duerst, & Derrick, Citation2018). Also, the effect was less consistent at the knee and hip among for the 3 shoe conditions tested.
If a runner with a given body mass runs in two shoe conditions at the same speed, then the net mechanical work is expected to be similar as well. As we observed a difference in ankle negative work between shoe conditions, we may expect some differences at other joints as well to compensate for that, which was not the case. However, a similar net mechanical work between shoe conditions could only be expected if there was no difference in energy dissipation at the foot-shoe-ground interfaces, which is unlikely given the results from the mechanical impact tests performed on the shoes. Furthermore, a compensation may apply at both the knee and the hip joints, with less consistent inter-individual strategies, which would result in non-significant differences between shoe conditions. Also, we only presented results for net joint work in the sagittal plane, while there might also be some differences in the other planes. Finally, there may also be a contribution from upper body movements, e.g. involving arms, trunk and head, which was not measured here.
A greater Maximal internal hip extension moment was observed in the Stiff shoe version (+5.9%), which could also induce higher burden over time and contribute to the greater injury risk observed in that shoe condition. The Maximal hip extension moment is roughly observed at the same time as VIPF (about 20% of the stance phase, and Supplemental online material 1), which was lower in the Stiff version. The greater Maximal hip extension moment can result from a greater GRF, a larger lever arm of the GRF vector in the Stiff version, or both. Future research should prospectively investigate whether Maximal hip extension moment is causally related to injury risk.
It is also important to note that there is a discordance when comparing the results between the shoe conditions presented in the tables and the differences visible in the average curves displayed in the figures. Indeed, the statistics were performed on discrete variables (mostly maximal values), and repeated measures ANOVA compares the means of these discrete variables considering the within-subject effect. The mean peak value for a condition is not similar to the highest value visible on the ensemble-averaged curve because of differences in the timing of these peaks between subjects. Indeed, every runner is unique and may have a specific running style, as suggested by the large standard deviation observed in variables such as cadence, contact time or shoe/ground angle (see ). It may be speculated that this heterogeneity in running style may translate in differences in both the magnitude and timing of peak forces and moments.
The fact that many variables were tested in the present study could be viewed as a main limitation. However, next to our main hypotheses, our aim was precisely to explore many different biomechanical factors that could potentially explain the injury risk difference in our parent study (Malisoux et al., Citation2020). Therefore, the explorative part of the present study should be viewed as hypothesis generating rather than hypothesis testing. To avoid an inflation of type I error, we applied a correction for multiple statistical comparisons (the Benjamini-Hochberg procedure), knowing that this would increase the risk of type II error at the same time. Another limitation is that the tests were conducted on a treadmill, which could have an impact on the results, since the effect of shoe stiffness on running technique may be different during over ground running (Riley et al., Citation2008). Nevertheless, the structure of the treadmill is extremely rigid, so that no additional cushioning was provided by the running surface. Also, the results may only apply to runners with a usual running speed of about 10 km/h. Furthermore, a single running velocity was investigated here, which limits the generalisability of our findings. Previous studies have shown that cushioning properties influenced loading rate at higher running speed only (Kulmala et al., Citation2018), which may be explained by the greater impact forces usually observed at these higher speeds (Nigg, Bahlsen, Luethi, & Stokes, Citation1987). Along the same lines, it is possible that the effect sizes found here may be greater at higher running speeds. This study compared only two shoe versions with a large difference in their stiffness properties, but there could indeed exist a dose–response relationship between shoe stiffness and key kinetic variables.
Conclusion
A lower VIPF was observed in the Stiff compared to the Soft shoe version and no difference was observed for vertical loading rate. These observations are in line with our previous findings that greater injury risk associated with the Stiff shoe version is not related to greater VIPF or VILR. Ankle eversion velocity was not different between the two shoe versions and therefore unlikely related to injury risk. Our explorative analysis revealed that Maximal ankle dorsiflexion angle, Maximal hip extension moment, Ankle negative work and Maximal ankle negative power were greater in the Stiff shoe version, which suggests that shoe stiffness is related to increased mechanical burden for the musculoskeletal system, especially around the ankle joint.
Supplemental Material
Download JPEG Image (1.3 MB)
Disclosure statement
No potential conflict of interest was reported by the author(s).
Additional information
Funding
References
- ASTM International. (2013). ASTM F1976-13 standard test method for impact attenuation of athletic shoe cushioning systems and materials. West Conshohocken, PA: ASTM International.
- Baltich, J., Maurer, C., Nigg, B. M., & Garcia Aznar, J. M. (2015). Increased vertical impact forces and altered running mechanics with softer midsole shoes. PLoS One, 10(4), e0125196.
- Becker, J., James, S., Osternig, L., & Chou, L. S. (2018). Foot kinematics differ between runners with and without a history of navicular stress fractures. Orthopaedic Journal of Sports Medicine, 6(4), 232596711876736.
- Benjamini, Y., & Hochberg, Y. (1995). Controlling the false discovery rate: A practical and powerful approach to multiple testing. Journal of the Royal Statistical Society: Series B (Methodological), 57(1), 289–300.
- Chan, Z. Y. S., Au, I. P. H., Lau, F. O. Y., Ching, E. C. K., Zhang, J. H., & Cheung, R. T. H. (2018). Does maximalist footwear lower impact loading during level ground and downhill running? European Journal of Sport Science, 18(8), 1083–1089.
- Cohen, J. (1988). Statistical power analysis for the behavioural sciences. New York: Academic press.
- Davis, I. S., Bowser, B. J., & Mullineaux, D. R. (2016). Greater vertical impact loading in female runners with medically diagnosed injuries: A prospective investigation. British Journal of Sports Medicine, 50(14), 887–892.
- Derrick, T. R., van den Bogert, A. J., Cereatti, A., Dumas, R., Fantozzi, S., & Leardini, A. (2020). ISB recommendations on the reporting of intersegmental forces and moments during human motion analysis. Journal of Biomechanics, 99, 109533.
- De Wit, B., De Clercq, D., & Lenoir, M. (1995). The effect of varying midsole hardness on impact forces and foot motion during foot contact in running. Journal of Applied Biomechanics, 11(4), 395–406.
- documentation C-MW. (2020, March 3). Tutorial: IOR gait full-body model 2018 [cited 2020]. Retrieved from http://www.c-motion.com/v3dwiki/index.php?title=Tutorial:_IOR_Gait_Full-Body_Model#cite_note-Cappozzo-2
- documentation C-MW. (2021, January 11). Normalized joint angle – Method 2 2013 [cited 2021]. Retrieved from https://www.c-motion.com/v3dwiki/index.php?title=Normalized_Joint_Angle_-_Method_2
- Dowling, G. J., Murley, G. S., Munteanu, S. E., Smith, M. M., Neal, B. S., Griffiths, I. B., … Collins, N. J. (2014). Dynamic foot function as a risk factor for lower limb overuse injury: A systematic review. Journal of Foot and Ankle Research, 7(1), 53.
- Fuller, J. T., Buckley, J. D., Tsiros, M. D., Brown, N. A., & Thewlis, D. (2016). Redistribution of mechanical work at the knee and ankle joints during fast running in minimalist shoes. Journal of Athletic Training, 51(10), 806–812.
- Gerritsen, K. G., van den Bogert, A. J., & Nigg, B. M. (1995). Direct dynamics simulation of the impact phase in heel-toe running. Journal of Biomechanics, 28(6), 661–668.
- Kristianslund, E., Krosshaug, T., & van den Bogert, A. J. (2012). Effect of low pass filtering on joint moments from inverse dynamics: Implications for injury prevention. Journal of Biomechanics, 45(4), 666–671.
- Kulmala, J. P., Kosonen, J., Nurminen, J., & Avela, J. (2018). Running in highly cushioned shoes increases leg stiffness and amplifies impact loading. Scientific Reports, 8(1), 17496.
- Lai, A. K., Lichtwark, G. A., Schache, A. G., & Pandy, M. G. (2018). Differences in in vivo muscle fascicle and tendinous tissue behavior between the ankle plantarflexors during running. Scandinavian Journal of Medicine & Science in Sports, 28(7), 1828–1836.
- Lieberman, D. E., Venkadesan, M., Werbel, W. A., Daoud, A. I., D’Andrea, S., Davis, I. S., … Pitsiladis, Y. (2010). Foot strike patterns and collision forces in habitually barefoot versus shod runners. Nature, 463, 531–535.
- MacLean, C. L., Davis, I. S., & Hamill, J. (2009). Influence of running shoe midsole composition and custom foot orthotic intervention on lower extremity dynamics during running. Journal of Applied Biomechanics, 25(1), 54–63.
- Malisoux, L., Delattre, N., Meyer, C., Gette, P., Urhausen, A., & Theisen, D. (2021). Effect of shoe cushioning on landing impact forces and spatiotemporal parameters during running: Results from a randomized trial including 800+ recreational runners. European Journal of Sport Science, 21(7), 985–993.
- Malisoux, L., Delattre, N., Urhausen, A., & Theisen, D. (2017). Shoe cushioning, body mass and running biomechanics as risk factors for running injury: A study protocol for a randomised controlled trial. BMJ Open, 7(8), e017379.
- Malisoux, L., Delattre, N., Urhausen, A., & Theisen, D. (2020). Shoe cushioning influences the running injury risk according to body mass: A randomized controlled trial involving 848 recreational runners. The American Journal of Sports Medicine, 48(2), 473–480.
- Matijevich, E. S., Branscombe, L. M., Scott, L. R., Zelik, K. E., & Grabowski, A. (2019). Ground reaction force metrics are not strongly correlated with tibial bone load when running across speeds and slopes: Implications for science, sport and wearable tech. PLoS One, 14(1), e0210000.
- Meardon, S., Willson, J., Kernozek, T., Duerst, A., & Derrick, T. (2018). Shoe cushioning affects lower extremity joint contact forces during running. Footwear Science, 10(2), 109–117.
- Milner, C. E., Ferber, R., Pollard, C. D., Hamill, J., & Davis, I. S. (2006). Biomechanical factors associated with tibial stress fracture in female runners. Medicine & Science in Sports & Exercise, 38(2), 323–328.
- Nigg, B., Behling, A.-V., & Hamill, J. (2019). Foot pronation. Footwear Science, 11(3), 131–134.
- Nigg, B. M., Bahlsen, H. A., Luethi, S. M., & Stokes, S. (1987). The influence of running velocity and midsole hardness on external impact forces in heel-toe running. Journal of Biomechanics, 20(10), 951–959.
- Pohl, M. B., Hamill, J., & Davis, I. S. (2009). Biomechanical and anatomic factors associated with a history of plantar fasciitis in female runners. Clinical Journal of Sport Medicine, 19(5), 372–376.
- Pollard, C. D., Ter Har, J. A., Hannigan, J. J., & Norcross, M. F. (2018). Influence of maximal running shoes on biomechanics before and after a 5K run. Orthopaedic Journal of Sports Medicine, 6(6), 232596711877572.
- Richardson, J. T. E. (2011). Eta squared and partial eta squared as measures of effect size in educational research. Educational Research Review, 6(2), 135–147.
- Riley, P. O., Dicharry, J., Franz, J., Croce, U. D., Wilder, R. P., & Kerrigan, D. C. (2008). A kinematics and kinetic comparison of overground and treadmill running. Medicine & Science in Sports & Exercise, 40(6), 1093–1100.
- Serpell, B. G., Ball, N. B., Scarvell, J. M., & Smith, P. N. (2012). A review of models of vertical, leg, and knee stiffness in adults for running, jumping or hopping tasks. Journal of Sports Sciences, 30(13), 1347–1363.
- Shorten, M., & Mientjes, M. (2011). The ‘heel impact’ force peak during running is neither ‘heel’ nor ‘impact’ and does not quantify shoe cushioning effects. Footwear Science, 3(1), 41–58.
- Theisen, D., Malisoux, L., Gette, P., Nührenbörger, C., & Urhausen, A. (2016). Footwear and running-related injuries – Running on faith? Sports Orthopaedics and Traumatology Sport-Orthopädie – Sport-Traumatologie, 32(2), 169–176.
- Willems, T. M., De Clercq, D., Delbaere, K., Vanderstraeten, G., De Cock, A., & Witvrouw, E. (2006). A prospective study of gait related risk factors for exercise-related lower leg pain. Gait & Posture, 23(1), 91–98.