
 ?Mathematical formulae have been encoded as MathML and are displayed in this HTML version using MathJax in order to improve their display. Uncheck the box to turn MathJax off. This feature requires Javascript. Click on a formula to zoom.
ABSTRACT
Wearable temperature sensors offer the potential to overcome several limitations associated with current laboratory- and field-based methods for core temperature assessment; however, their ability to provide accurate data at elevated core temperatures (Tc) has been questioned. Therefore, this investigation aimed to determine the concurrent validity of a wearable temperature sensor (CORE) compared to a reference telemetric temperature pill (BodyCAP) during a team-sport heat training camp prior to the 2020 Olympic Games. Female field hockey players (n = 19) in the Australian national squad completed 4 sessions in hot conditions where their temperature was monitored via CORE and BodyCAP. Concurrent validity of the wearable CORE device was determined with reference to the ingested BodyCAP pill. Lin’s Concordance Correlation Coefficients determined there was “poor” agreement between devices during all sessions. Mean bias demonstrated that CORE underestimated Tc in all sessions (−0.06°C to −0.34°C), with wide mean 95% confidence intervals (±0.35°C to ±0.56°C). Locally estimated scatterplot smoothing regression lines illustrated a non-linearity of error, with greater underestimation of Tc by the CORE device, as Tc increased. The two devices disagreed more than ±0.3°C for 41-60% of all data samples in each session. Our findings do not support the use of the CORE device as a valid alternative to telemetric temperature pills for Tc assessment, particularly during exercise in hot conditions where elevated Tc are expected.
HIGHLIGHTS
The CORE wearable sensor is not a valid alternative to telemetric temperature pills for Tc assessment, particularly during exercise in hot conditions where elevated Tc are expected.
Compared to reference Tc data provided by a validated, ingestible telemetric temperature pill, the CORE device demonstrated “poor” agreement between devices during all sessions in this investigation.
There was a non-linear bias which tended to underestimate Tc to a greater extent as Tc increased (but with wide confidence intervals), with 41-60% of all data exceeding a threshold error of ±0.3°C.
Introduction
The 2020 Olympic Games were predicted to be the hottest on record, held in Tokyo’s summer when conditions regularly reach >30°C and >70% relative humidity (RH) (de Korte et al., Citation2021). Indeed, the mean maximum daily air temperature and RH in Tokyo was 32.7°C and 78.5%, respectively, during the Olympic Games (July 23 – August 8, 2021) (Japan Meteorological Agency, Citation2022). Prolonged exercise in such conditions impairs performance (Périard et al., Citation2021) and can result in mild to severe heat illness (Nichols, Citation2014). As such, many sport practitioners prepared bespoke heat acclimation plans for their athletes leading up to the 2020 Olympic Games (Carr et al., Citation2022; de Korte et al., Citation2021).
The most well accepted method for combatting the physiological stress associated with exercise in the heat is to undergo a heat acclimation or acclimatisation intervention (Racinais et al., Citation2015). While individual rates and magnitudes of physiological adaptations to heat exposure may vary, it is well accepted that interventions should illicit increases in sweating and core body temperature (Tc) (Racinais et al., Citation2015). Traditionally, exercise-based heat exposures resulting in Tc increases to ≥38.5°C have been recommended to induce optimal physiological adaptations (Fox et al., Citation1963), and while several new methods have now been developed, it remains important that the stimulus induces increases in Tc (Daanen et al., Citation2018). To confirm the Tc stimulus applied, the measurement of Tc during heat acclimation interventions is vital, usually performed in laboratory trials using esophageal (Maloney et al., Citation2021) or rectal (Dennis et al., Citation2021) thermometers. However, these invasive procedures are not possible to employ during field-based interventions, and therefore, non-invasive methods for assessing Tc in the sporting environment have received recent attention (Racinais et al., Citation2019; Verdel et al., Citation2021).
Telemetric ingestible pills, which transmit temperature data from within the body, have gained scientific interest in sport (Travers et al., Citation2016), health (Moyen et al., Citation2021), disability sport (Au et al., Citation2019), and aging related (Eggenberger et al., Citation2021) research. Several different telemetric temperature pill products currently exist, which have demonstrated excellent validity and reliability (Bongers et al., Citation2018). The ability to monitor internal body temperatures continuously and remotely has allowed sport practitioners to obtain real-world data from the field, expanding our knowledge of Tc responses during competition held under heat stress (Racinais et al., Citation2019). Despite their many advantages, telemetric temperature pills have several important limitations, including having to correctly time pill ingestion due to the risk of data contamination from food or fluid ingestion, and the high cost of the pills (which are single use). Therefore, several recent investigations have explored the use of wearable sensors as an alternative approach to telemetric pill ingestion, which estimate Tc via input from sources such as heart rate, skin temperature, heat flux, ambient temperature, and humidity (Moyen et al., Citation2021; Verdel et al., Citation2021). However, while non-invasive and re-usable technologies which can be applied in the field present an attractive solution to the issues with other technologies highlighted above, it is imperative that scientists properly assess the reliability and validity of such technology prior to making decisions based upon the data obtained. While these devices have been found to have acceptable mean agreement with reference telemetric temperature pill data during daily living (Moyen et al., Citation2021), and exercise (Verdel et al., Citation2021), their ability to provide accurate data consistently and at elevated Tc has recently been questioned in a laboratory setting (Verdel et al., Citation2021). As such, it is vital that these wearable temperature sensors are tested in ecologically valid sporting settings to inform practitioners whether they accurately estimate the thermal demands in the field. Accordingly, the primary aim of the current investigation was to determine the concurrent validity of a wearable temperature sensor compared to a reference telemetric temperature pill during a team-sport heat training camp prior to the 2020 Olympic Games.
Materials and methods
Participants
This investigation involved 19 female field hockey players (age: 26 ± 4 y, stature: 170 ± 6 cm, body mass: 66 ± 7 kg) from the Australian national squad. Written consent was obtained from each player via a signed data release form as part of the National Sporting Organisation’s athlete scholarship agreement. Institutional ethical approval to analyse this data was obtained prior to manuscript preparation (2021/ET000838).
Research design
Testing was conducted by members of the research team during a national heat training camp in Darwin, Australia (April 2021), while preparing for the Tokyo Olympic Games (July/August 2021). Data was collected from 19 national women’s field hockey squad members during 4 sessions (1x training session and 3x simulated matches). Players ingested a telemetric temperature pill (e-Celsius, BodyCAP, France) ∼12 h prior to the session. Thirty minutes prior to the session, players were then fitted with a wearable temperature sensor (CORE, greenTEG AG, Switzerland) attached to a heart rate chest strap (Garmin, USA). Temperature and heart rate data were recorded continuously throughout each session, as was movement data via a wearable player tracking device (Vector X7, Catapult Sports, Melbourne, Australia) worn in a custom harness situated between the scapulae. All sessions consisted of a 30 min standardised warm up followed by a 90 min main session. Ambient temperature and RH on the pitch was assessed (Kestrel 5500 Weather Meter, Nielsen-Kellerman, USA) at the beginning of the warm-up, and every 30 min throughout each session, with session start time and session average environmental conditions reported:
Session 1 – Training (Day): 9:30am, 31.0°C, 38.5%RH.
Session 2 – Match 1 (Day): 9:30am, 32.2°C, 50.0%RH.
Session 3 – Match 2 (Night): 6:15pm, 27.6°C, 80.0%RH.
Session 4 – Match 3 (Night): 8:45pm, 27.4°C, 74.0%RH.
Ingestible telemetric temperature pill
All telemetric e-Celsius BodyCAP temperature pills were allocated to a specific player, before being activated and then ingested ∼12 h prior to the session. This timing approach was taken to minimise the chances of pills remaining in the stomach where they may be impacted by food and water consumption, or passing through the system entirely. The pill (1.8 × 0.9 cm & < 2 g) continuously records Tc data and was set to a sampling rate of twice per minute. Data was subsequently downloaded to the manufacturer eViewer Performance monitor (version 1.3.2) before being exported for analysis (firmware version 6.1.0). The manufacturer reports the accuracy of the e-Celsius pill to be ±0.20°C when operating in the calibration range of 25–45°C. Independent ex vivo validation of the sensor has reported a mean difference of −0.08°C compared to reference hot water bath temperatures within physiological ranges (33–44°C) (Bongers et al., Citation2018). It has a low standard error of measurement (0.04°C) and excellent reliability indicated by an intraclass correlation coefficient of 1.00 and mean agreement between test and retest trials of −0.01 ± 0.03°C (Bongers et al., Citation2018). As such, it was used as the industry-standard reference in this investigation.
Wearable temperature sensor
Body temperature was measured with the greenTEG CORE sensor paired with a heart rate monitor. The CORE wearable sensor (4 × 5 × 0.8 cm & 12 g) estimates Tc based on the measurement of skin temperature, heat flux, and heart rate. Even though heart rate is an optional input, we measured it in the current investigation as the manufacturer recommends it to improve the estimation of Tc during physical activity. The sensor was positioned according to the manufacturer’s instructions; on the torso/chest approximately 20 cm below the armpit using a heart rate monitor strap. The sensor samples data at 1 Hz, with the recorded Tc estimation updated every minute. Data stored on the device can be downloaded to the Android or iOS CORE app for further analysis, (firmware version 0.3.18 was used for this investigation). The manufacturer reports the accuracy of the CORE sensor to be ±0.21°C mean absolute deviation, ± 0.28°C standard deviation and ±0.56°C 95% confidence interval compared to the ingestible telemetric temperature pill employed in the current investigation (greenTEG, Citation2022).
Time-motion data
Players wore the same tracking device for each session during the investigation, which contained Global Positioning System (GPS) sensors sampling at 10 Hz, and a triaxial accelerometer, gyroscope, and magnetometer each sampling at 100 Hz. Movement data were collected by national team support staff and extracted via proprietary software (OpenField Version 3.3.1, Catapult Sports, Melbourne, Australia) prior to being bulk-exported, and provided to research staff. Only periods of time where players were active on the field were considered for time-motion data analysis, with time on the bench and dead time between periods and drills excluded (“active duration”). Additionally, total distance (m) covered during the active duration was used to determine “relative intensity” during each session, calculated as: total distance (m) / active duration (min).
Data processing
To overcome the different sampling rates between the devices, temperature data was down sampled to once every minute.
Statistical analysis
One-way analysis of variance for mean relative intensity and BodyCAP Tc between sessions was conducted with SPSS (IBM v27). Levene’s test was used to assess equality of variance between sessions and error residuals were assessed for normality via visualising histograms and one-sample Kolmogorov Smirnov tests. Post-hoc analysis was performed via Fisher’s Least Significant Difference. All temperature time series analysis was performed using Matlab (Mathworks, vR2021a). Time series data were assessed for normality using histograms and criteria set out by West et al. (Citation1995) (namely, absolute skewness of <2.1 and kurtosis of <7.1 are indicative of normal distributions). Concurrent validity of the CORE device was determined by comparing temperature data from the CORE device with reference to BodyCAP (). For each player session, we assessed Bland Altman plots, mean bias (EquationEquation 1(1)
(1) ), mean absolute deviation (EquationEquation 2
(2)
(2) ), 95% confidence intervals about the mean bias (CI95%) (EquationEquation 3
(3)
(3) ), 95% limits of agreement (LoA95%) (EquationEquation 4
(4)
(4) ) and standard deviation of difference scores (Bland & Altman, Citation1986). Lin’s Concordance Correlation Coefficient (CCC) (EquationEquation 5
(5)
(5) ) was calculated to assess absolute agreement between the two devices, using McBride’s (Citation2005) recommendations for interpretation: > 0.99, “almost perfect”; 0.95–0.99, “substantial”; 0.90–0.95, “moderate”; and <0.90, “poor”. Finally, Pearson’s correlations (r) were calculated to assess relative agreement. Measurements of agreement were calculated for each player during each session, and then aggregated as the mean, standard deviation, and range across players within each session.
(1)
(1) where
is difference in core temperature (Tc) between the CORE and BodyCAP devices measured at time point t, and N is the number of time points.
(2)
(2) where
is absolute difference in core temperature (Tc) between the CORE and BodyCAP devices measured at time point t, Mean Bias is as described in EquationEq. 1
(1)
(1) , and N is the number of time points.
(3)
(3) where
is the standard deviation of differences between CORE and BodyCAP devices across all timepoints.
(4)
(4) where Mean Bias and CI95% are defined as described in EquationEq. (1
(1)
(1) ) and (Equation3
(3)
(3) ), respectively.
(5)
(5) where CCC is the Lin’s Concordance Correlation Coefficient, r is the is correlation coefficient between CORE and BodyCAP devices,
is the population standard deviation for CORE and BodyCAP devices, respectively, and Mean Bias is as described in EquationEq. (1
(1)
(1) ).
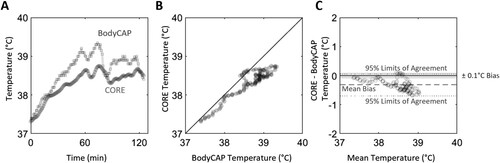
Figure 1. Example of core temperature of a player during a field hockey match measured using a wearable temperature sensor (CORE; circles) and ingestible telemetric temperature pill (BodyCAP; squares) (Panel A); scatter plot of core temperature, with a solid black reference line to indicate perfect agreement (Panel B); and Bland Altman plot illustrating error between the devices (CORE – BodyCAP) as a function of mean core temperature for each time point, with mean bias shown by a dashed line, 95% limits of agreement shown by dotted lines and practically acceptable levels of error (±0.1°C) shown by the shaded area (Panel C).
Initial inspection of Bland Altman plots indicated bias between the devices was not constant as a function of mean temperature, and so, locally estimated scatterplot smoothing (LOESS) regression lines were fitted to scatterplots of CORE and BodyCAP data to more clearly illustrate the non-linearity of error. To address the non-linearity of agreement, we conducted secondary analysis using methods which did not rely on assumptions of linearity of bias or homoscedasticity. First, the mean proportion of time each player spent within different bands of error (CORE – BodyCAP) was calculated for each session. Three bands for temperature error were defined as: low (±0.1°C), moderate (±0.3°C); and high >0.3°C, based on the thresholds established by Gant et al. (Citation2006), which have since been used frequently in assessing the validity of temperature assessment devices (Casa et al., Citation2007; Gosselin et al., Citation2019; Verdel et al., Citation2021). LOESS regression indicated a lack of responsiveness from the CORE device at higher Tc, so error distributions were also calculated for temperatures above 38.5°C, as measured by the BodyCAP device. Furthermore, to address potential error introduced by relative lag between the sensors, we also calculated absolute agreement (bias; Intraclass Correlation Coefficient [ICC2,1]; CI95% about the mean bias) and relative agreement (Pearson’s r coefficient) of time over the whole session that each player spent in hyperthermic temperatures (Tc ≥38.5°C), which is considered necessary to induce heat acclimation (Fox et al., Citation1963; Garrett et al., Citation2009; Verdel et al., Citation2021). For this final analysis, data from across sessions were considered in the same analysis. Alpha was set at α<0.05 to guide interpretation.
Results
After the removal of any files where BodyCAP temperature data was visually impacted by food or fluid consumption (n = 8), or had passed through the player’s system entirely (n = 1), a total of 32 player observations were made across the four sessions in this investigation. Relative intensity during the training session (108.6 ± 6.4 m/min; 31.0°C, 38.5%RH) was lower than in match 1 (121.0 ± 10.7 m/min, p = 0.006; 32.2°C, 50.0%RH) and match 3 (124.0 ± 10.5 m/min, p = 0.004; 27.4°C, 74.0%RH), but not match 2 (117.8 ± 7.8 m/min, p = 0.052; 27.6°C, 80.0%RH). No differences in relative intensity were observed between matches. Using reference BodyCAP data, mean Tc was lower during the training session (38.1 ± 0.22°C) than match 1 (38.4 ± 0.4°C, p = 0.013) and match 2 (38.7 ± 0.3°C, p < 0.001), but not match 3 (38.5 ± 0.2°C, p = 0.058).
Mean bias between devices demonstrated that CORE underestimated Tc measured compared to BodyCAP in all sessions, but was within levels considered to be practically acceptable (±0.1°C; Gant et al., Citation2006) in the training session and match 1, but not match 2 or 3 (). Additionally, CI95% were within manufacturer claims for all sessions (±0.56°C), but were greater than the ±0.3°C declared acceptable by Gant et al. (Citation2006) in all sessions (0.35°C to 0.56°C). Additionally, CCC determined that there was “poor” agreement (<0.90) between devices in all sessions (0.51-0.69), supported by wide LoA95%, which ranged from −0.42°C to 0.29°C for the training session, and as wide as −0.70°C to 0.36°C for Match 2.
Figure 2. Average within-player agreement of core temperature measured using CORE and BodyCAP devices; scatter plot of core temperature, with a solid thin black reference line to indicate perfect agreement, and a thick black line indicating a locally estimated scatterplot smoothing (LOESS) regression line to illustrate non-linearity of bias; and Bland Altman plot illustrating error between the devices (CORE – BodyCAP) as a function of mean core temperature for each time point, with mean bias shown by a dashed line, 95% limits of agreement shown by dotted lines and practically acceptable levels of error (±0.1°C) shown by the shaded area.
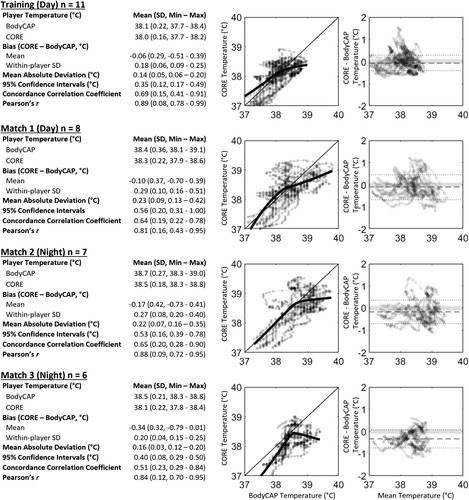
There was considerable variability in estimates of agreement between players within each of the sessions. For example, mean bias in the CORE device ranged from underestimating Tc for one player in Match 3 by 0.79°C to overestimating Tc by 0.41°C in Match 2. Within-player standard deviations also varied greatly, ranging from 0.06°C to 0.51°C, suggesting inconsistent agreement between players and sessions.
The proportion of time that the error between devices (CORE – BodyCAP) was greater than ±0.1°C was 78% for training, and ≥84% for all 3 matches (A). When only hyperthermic temperatures (≥38.5°C) were considered, the proportion of time that error was greater than ±0.1°C was 88% for training and remained high (≥83%) for all 3 matches (B).
Figure 3. Proportion of error between devices (CORE – BodyCAP) within practically acceptable levels of error (±0.1°C), between 0.1°C to 0.3°C and greater than 0.3°C for all available data (Panel A) and data where core temperature estimated by the BodyCAP was greater than 38.5°C (Panel B). Tables for Panels A and B indicate the proportion of data points that error between the devices was ±0.1°C and ±0.3°C. Panel C illustrates a scatter plot of the proportion of time that each device estimated core temperature to be over 38.5°C for each player and session, with the thin black reference line indicating perfect agreement and thick black line indicating a regression line of best fit.
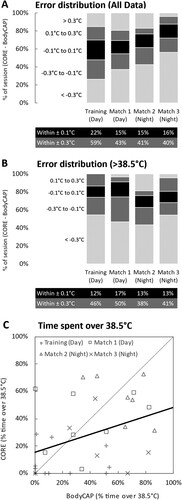
There was poor absolute agreement (ICC2,1: 0.36; mean bias: 10%; CI95%: ± 59%) and relative agreement (r = 0.38) between devices for the proportion of time each player spent ≥38.5°C across a session (C). This was underestimated by the CORE device (CORE mean ± SD: 28 ± 25% vs BodyCAP: 38 ± 29%), although this was not statistically significant (p = 0.07).
Discussion
The primary aim of this investigation was to determine the concurrent validity of the CORE wearable temperature sensor compared to a reference telemetric temperature pill (BodyCAP) during a team-sport heat training camp prior to the 2020 Olympic Games. The main finding was that the CORE device demonstrated “poor” agreement with the reference temperature in all sessions (CCC = 0.51-0.69), where the CI95% exceeded an acceptable threshold of ±0.3°C in all sessions (±0.35°C to ±0.56°C). In total, ≥ 78% of all data exceeded a practically acceptable level of error (±0.1°C), and 41-60% of all data exceeded a threshold error of ±0.3°C, in each session. Our findings do not support the use of the CORE device as a valid alternative to telemetric temperature pills for Tc assessment in elite female team-sport athletes during exercise in the heat.
Poor agreement between CORE and reference rectal temperature has been reported previously in a laboratory-based investigation involving cycling exercise (Verdel et al., Citation2021). Interestingly, the authors of this work noted that CORE systematically overestimated Tc (0.23°C ± 0.35°C) in temperate conditions (∼19°C and ∼32%RH), where mean Tc during exercise ranged from ∼37.4°C to ∼38.4°C. Conversely, these authors also showed that CORE systematically underestimated Tc (−0.10°C ± 0.38°C) in a thermally challenging environment (∼31°C and 39%RH), where mean Tc during exercise ranged from ∼38.0°C to 39.1°C (Verdel et al., Citation2021). These findings are supported by our data, where the CORE underestimated temperature in all sessions conducted during the team-sport heat training camp, and was largest in match 2 and 3 (−0.17°C ± 0.42°C and −0.34°C ± 0.31°C, respectively) where high ambient relative humidity resulted in the highest recorded mean Tc (38.7°C ± 0.27°C and 38.5°C ± 0.21°C, respectively). Additionally, visual inspection of LOESS regression lines confirms that CORE’s negative mean bias worsens as Tc increases in all sessions, with wide confidence intervals (). More extreme underestimation of temperature as Tc increases is of practical significance in applied sport settings. For example, it will impact practioners’ ability to accurately prescribe exercise during a heat acclimation intervention (Schmit et al., Citation2018). It may also misrepresent heat stress when monitoring Tc responses in para-athletes who may be at greater risk of hyperthermia, such as those with cerebral palsy (Maltais et al., Citation2004), an amputation (Crandall & Davis, Citation2010), or a spinal cord injury (Maloney et al., Citation2021). In these scenarios, a misrepresentation of Tc may result in suboptimal heat acclimation or lead to heat illness. Of note, the CORE device’s underestimation of Tc was shown to increase to a greater extent as Tc reaches and surpasses 38.5°C, which was not only demonstrated in this investigation, but also previously supported by laboratory-based studies (Verdel et al., Citation2021). This 38.5°C threshold is a well-recognised point at which physiological adaptations resulting from heat acclimation are realised (Fox et al., Citation1963) and is often used as an exercise prescription guide in controlled hyperthermia interventions (Garrett et al., Citation2009). Therefore, the range of disagreement (mean CI95% ranged from ±0.35 to ±0.56°C in all sessions) during a heat training camp in this investigation promotes the idea that CORE is not a suitable solution for measuring Tc during a heat intervention with athletes, especially when an elevated Tc is expected.
The underestimation of Tc by the CORE device during exercise in the heat was previously reported in male athletes performing continuous aerobic exercise (Verdel et al., Citation2021). In their investigation, the mean difference between CORE and criterion Tc was greater than an acceptable threshold of 0.3°C (Gant et al., Citation2006) in 55% of all measured data (Verdel et al., Citation2021). Our data shows that when considered in female athletes completing intermittent exercise (field hockey training and match simulation) in varying hot and humid ambient conditions, the mean difference between CORE and criterion BodyCAP Tc was greater than 0.3°C in 41-60% of all measured data, in each session. The similarity between our findings and those reported previously (Verdel et al., Citation2021) indicate that exercise mode and sex differences are unlikely to be the cause of error here, but rather, the underestimation of Tc by the CORE device as athletes reach hyperthermic temperatures (Tc ≥38.5°C) is a more likely explanation. This is supported by the current findings where the mean difference between CORE and criterion BodyCAP Tc exceeding 0.3°C rose to 50-62% of all data when only hyperthermic temperatures were considered (B). However, it should be noted that Tc measured at different sites can diverge when Tc is changing rapidly (Teunissen et al., Citation2012), and therefore, the authors of the previous CORE device validation suggested that reference Tc could be measured at multiple sites to improve the accuracy of outcome (Verdel et al., Citation2021). Rectal and esophageal temperatures were not possible to obtain in this field-based investigation, but telemetric pill-derived Tc has been found to be valid and reliable (Bongers et al., Citation2018), and also agree more closely with rectal temperature than esophageal temperature during rapid changes in Tc (Teunissen et al., Citation2012); therefore, we consider this approach a suitable reference Tc value in the current investigation.
In conclusion, our findings do not support the use of the CORE device as a valid alternative to telemetric temperature pills for Tc assessment in the field. We found “poor” agreement between Tc data provided by CORE and a reference telemetric pill during 4 field hockey sessions conducted in hot conditions during this investigation, with 41–60% of all data exceeding a threshold error of ±0.3°C. Importantly, the CORE device demonstrated a non-linear bias which tended to underestimate Tc to a greater extent as Tc increased (but with wide confidence intervals), and therefore, the CORE device is not recommended for use with elite female athletes conducting specific heat training in the field where elevated Tc is expected and requires accurate reporting.
Declaration of interest
The authors report there are no competing interests to declare.
Acknowledgements
The authors would like to thank all players and support staff for their time and cooperation throughout this investigation which was conducted during their preparation for an Olympic Games tournament.
Disclosure statement
No potential conflict of interest was reported by the author(s).
Additional information
Funding
References
- Au, J. S., Kamijo, Y., Goosey-Tolfrey, V. L., Leicht, C. A., MacDonald, M. J., Mukai, Y., & Tajima, F. (2019). Comparison between esophageal and intestinal temperature responses to upper-limb exercise in individuals with spinal cord injury. Spinal Cord, 57(7), 586–593. https://doi.org/10.1038/s41393-019-0257-5
- Bland, J. M., & Altman, D. (1986). Statistical methods for assessing agreement between two methods of clinical measurement. The Lancet, 327(8476), 307–310. https://doi.org/10.1016/S0140-6736(86)90837-8
- Bongers, C. C. W. G., Daanen, H. A., Bogerd, C. P., Hopman, M. T. E., & Eijsvogels, T. M. H. (2018). Validity, reliability, and inertia of four different temperature capsule systems. Medicine & Science in Sports & Exercise, 50(1), 169–175. https://doi.org/10.1249/MSS.0000000000001403
- Carr, A. J., Vallance, B. S., Rothwell, J., Rea, A. E., Burke, L. M., & Guy, J. H. (2022). Competing in hot conditions at the Tokyo Olympic Games: Preparation strategies used by Australian race walkers. Frontiers in Physiology, 13, 836858. https://doi.org/10.3389/fphys.2022.836858
- Casa, D. J., Becker, S. M., Ganio, M. S., Brown, C. M., Yeargin, S. W., Roti, M. W., Siegler, J., Blowers, J. A., Glaviano, N. R., Huggins, R. A., Armstrong, L. E., & Maresh, C. M. (2007). Validity of devices that assess body temperature during outdoor exercise in the heat. Journal of Athletic Training, 42(3), 333–342.
- Crandall, C. G., & Davis, S. L. (2010). Cutaneous vascular and sudomotor responses in human skin grafts. Journal of Applied Physiology, 109(5), 1524–1530. https://doi.org/10.1152/japplphysiol.00466.2010
- Daanen, H. A. M., Racinais, S., & Périard, J. D. (2018). Heat acclimation decay and re-induction: A systematic review and meta-analysis. Sports Medicine, 48(2), 409–430. https://doi.org/10.1007/s40279-017-0808-x
- de Korte, J. Q., Bongers, C. C. W. G., Hopman, M. T. E., Teunissen, L. P. J., Jansen, K. M. B., Kingma, B. R. M., Ballak, S. B., Maase, K., Moen, M. H., van Dijk, J., Daanen, H. A. M., & Eijsvogels, T. M. H. (2021). Performance and thermoregulation of Dutch Olympic and Paralympic athletes exercising in the heat: Rationale and design of the Thermo Tokyo study: The journal temperature toolbox. Temperature, 8(3), 209–222. https://doi.org/10.1080/23328940.2021.1925618
- Dennis, M. C., Goods, P. S. R., Binnie, M. J., Girard, O., Wallman, K. E., Dawson, B. T., & Peeling, P. (2021). Heat added to repeated-sprint training in hypoxia does not affect cycling performance. International Journal of Sports Physiology and Performance, 16(11), 1640–1648. https://doi.org/10.1123/ijspp.2020-0676
- Eggenberger, P., Bürgisser, M., Rossi, R. M., & Annaheim, S. (2021). Body temperature is associated with cognitive performance in older adults with and without mild cognitive impairment: A cross-sectional analysis. Frontiers in Aging Neuroscience, 13, 585904–585904. https://doi.org/10.3389/fnagi.2021.585904
- Fox, R. H., Goldsmith, R., Kidd, D. J., & Lewis, H. E. (1963). Acclimatization to heat in man by controlled elevation of body temperature. The Journal of Physiology, 166(3), 530–547. https://doi.org/10.1113/jphysiol.1963.sp007121
- Gant, N., Atkinson, G., & Williams, C. (2006). The validity and reliability of intestinal temperature during intermittent running. Medicine & Science in Sports & Exercise, 38(11), 1926–1931. https://doi.org/10.1249/01.mss.0000233800.69776.ef
- Garrett, A. T., Goosens, N. G., Rehrer, N. G., Patterson, M. J., & Cotter, J. D. (2009). Induction and decay of short-term heat acclimation. European Journal of Applied Physiology, 107(6), 659–670. https://doi.org/10.1007/s00421-009-1182-7
- Gosselin, J., Béliveau, J., Hamel, M., Casa, D., Hosokawa, Y., Morais, J. A., & Goulet, E. D. B. (2019). Wireless measurement of rectal temperature during exercise: Comparing an ingestible thermometric telemetric pill used as a suppository against a conventional rectal probe. Journal of Thermal Biology, 83, 112–118. https://doi.org/10.1016/j.jtherbio.2019.05.010
- greenTEG. (2022). Core Body Temperature Algorithm. greenTEG. Available online at: https://www.greenteg.com/heat-flux-sensor-technology/core-body-temperature-algorithm/ (accessed October 27, 2022).
- Japan Meteorological Agency. (2022). Historical weather data download. Japan Meteorological Agency. Available online at: https://www.data.jma.go.jp/gmd/risk/obsdl/index.php (accessed November 17, 2022).
- Maloney, P. L., Pumpa, K. L., Miller, J., Thompson, K. G., & Jay, O. (2021). Extended post-exercise hyperthermia in athletes with a spinal cord injury. Journal of Science and Medicine in Sport, 24(8), 831–836. https://doi.org/10.1016/j.jsams.2021.03.005
- Maltais, D., Wilk, B., Unnithan, V., & Bar-Or, O. (2004). Responses of children with cerebral palsy to treadmill walking exercise in the heat. Medicine & Science in Sports & Exercise, 36(10), 1674–1681. https://doi.org/10.1249/01.MSS.0000142312.43629.D8
- McBride, G. B.. (2005). A proposal for strength-of-agreement criteria for Lin’s concordance correlation coefficient. NIWA Client Report: HAM2005-062, 45, 307–310. PMID: 22095112.
- Moyen, N., Bapat, R., Tan, B., Esfahani, M., & Mundel, T. (2021). Accuracy of a wearable device to non-invasively predict continuous core body temperature. The FASEB Journal, 35(S1). doi:10.1096/fasebj.2021.35.S1.03140
- Nichols, A. W. (2014). Heat-related illness in sports and exercise. Current Reviews in Musculoskeletal Medicine, 7(4), 355–365. https://doi.org/10.1007/s12178-014-9240-0
- Périard, J. D., Eijsvogels, T. M. H., & Daanen, H. A. (2021). Exercise under heat stress: Thermoregulation, hydration, performance implications, and mitigation strategies. Physiological Reviews, 101(4), 1873–1979. https://doi.org/10.1152/physrev.00038.2020
- Racinais, S., Alonso, J. M., Coutts, A. J., Flouris, A. D., Girard, O., González-Alonso, J., Hausswirth, C., Jay, O., Lee, J. K. W., Mitchell, N., Nassis, G. P., Nybo, L., Pluim, B. M., Roelands, B., Sawka, M. N., Wingo, J., & Périard, J. D. (2015). Consensus recommendations on training and competing in the heat. British Journal of Sports Medicine, 49(18), 1164–1173. https://doi.org/10.1136/bjsports-2015-094915
- Racinais, S., Moussay, S., Nichols, D., Travers, G., Belfekih, T., Schumacher, Y. O., & Periard, J. D. (2019). Core temperature up to 41.5(C during the UCI road cycling world championships in the heat. British Journal of Sports Medicine, 53(7), 426–429. https://doi.org/10.1136/bjsports-2018-099881
- Schmit, C., Duffield, R., Hausswirth, C., Brisswalter, J., & Le Meur, Y. (2018). Optimizing heat acclimation for endurance athletes: High- versus low-intensity training. International Journal of Sports Physiology and Performance, 13(6), 816–823. https://doi.org/10.1123/ijspp.2017-0007
- Teunissen, L. P. J., de Haan, A., de Koning, J. J., & Daanen, H. A. M. (2012). Telemetry pill versus rectal and esophageal temperature during extreme rates of exercise-induced core temperature change. Physiological Measurement, 33(6), 915–924. https://doi.org/10.1088/0967-3334/33/6/915
- Travers, G. J. S., Nichols, D. S., Farooq, A., Racinais, S., & Périard, J. D. (2016). Validation of an ingestible temperature data logging and telemetry system during exercise in the heat. Temperature, 3(2), 208–219. https://doi.org/10.1080/23328940.2016.1171281
- Verdel, N., Podlogar, T., Ciuha, U., Holmberg, H., Debevec, T., & Supej, M. (2021). Reliability and validity of the core sensor to assess core body temperature during cycling exercise. Sensors (Basel, Switzerland), 21(17), 5932. doi:10.3390/s21175932
- West, S. G., Finch, J. F., & Curran, P. J. (1995). Structural equation models with nonnormal variables: Problems and remedies. In R. H. Hoyle (Ed.), Structural equation modelling: Concepts, issues, and applications (pp. 56–75). Sage Publications, Inc.