
 ?Mathematical formulae have been encoded as MathML and are displayed in this HTML version using MathJax in order to improve their display. Uncheck the box to turn MathJax off. This feature requires Javascript. Click on a formula to zoom.
ABSTRACT
Field hockey players are exposed to high biomechanical loads. These loads often cannot be adequately estimated with global navigational satellite systems (GNSS) since on-field displacements during these movements are often small. Therefore, this study aims to explore the potential of different proxies of biomechanical load in field hockey with use of a simple inertial measurement unit (IMU) system. Sixteen field hockey players performed a range of field hockey specific exercises, including running with stick on the ground, running upright, and different types of shots and passes. All exercises were performed at two different frequencies (i.e. number of actions per minute). A variety of proxies of biomechanical load (time spent with forward tilted pelvis, time spent in lunge position, time spent with flexed thighs, and Hip Load) were obtained using wearable IMUs. In addition, total distance was quantified using a GNSS system. Linear mixed models were constructed to determine the effects of the different exercises and action frequency on all quantified metrics. All metrics increased approximately proportional to the increase in action frequency. Total distance and Hip Load were greatest for the running exercises, but the different types of shots and passes had greater effects on specific on the times spent in the demanding body postures. This shows that these proxies of biomechanical load can be used to estimate field hockey-specific biomechanical loads. The use of these metrics may provide coaches and medical staff with a more complete view of the training load that field hockey players experience.
Highlights
New proxies of biomechanical load derived with inertial measurement units were used to quantify field hockey specific biomechanical loads.
These new biomechanical metrics are complementary to metrics obtained with global navigation satellite systems and increased proportionally to a doubling of the exercise intensity.
The presented biomechanical load metrics can help field hockey coaches to achieve a better balance between load and recovery for their players.
Introduction
An adequate balance between load and recovery may help to optimize performance and reduce the risk of injury (Vanrenterghem et al., Citation2017). To quantify this load, current monitoring systems in field hockey include global navigation satellite systems (GNSS) (Lim et al., Citation2021). These systems mainly focus on the whole-body physiological load players experience (Vanrenterghem et al., Citation2017), whereby total distance covered, and distances covered at high running speeds are commonly used metrics. However, the biomechanical loads (i.e. forces, strains etc.) on specific muscle groups are assumed more important in the aetiology of musculotendinous injuries (Vanrenterghem et al., Citation2017). For example, it has been shown that field hockey players who specialize in drag flicks, which is a short explosive movement whereby players powerfully drag the ball with their stick to shoot on goal, have an increased injury risk compared to other players (Ng et al., Citation2016). However, when executing a drag flick the displacement of the player on the field is limited to a couple of meters and the displacement velocity of the player remains low. Therefore, with the traditional GNSS-based metrics this and other field hockey specific exercises will be categorized as “low intensity”. Thus, GNSS systems are not sensitive and specific enough to register such short field hockey specific exercises that are accompanied by high biomechanical loads on musculoskeletal tissues. Actions that do not involve large or fast displacements of the body should be included in training load monitoring, since these are accompanied with high stresses on muscles, tendons, and joints, and may therefore be crucial in relation injury prevention.
To date, it is impossible to obtain estimates of musculotendinous stresses and strains in the field (Verheul et al., Citation2020). However, it is possible to obtain a player’s lower body kinematics without hindering the player (Wilmes et al., Citation2020). Therefore, it may be possible to derive proxies of biomechanical load by quantifying kinematic patterns, which are known to be accompanied with relatively high muscle forces. Thus, such proxy metrics may be more representative of biomechanical loads than the traditional GNSS-based metrics. In addition, repetitive high forces on muscle tissue can lead to tissue damage accumulation, which may ultimately result in injury (Edwards, Citation2018). Because most injuries in field hockey concern the muscles of the thighs, hips, and lower back (Barboza et al., Citation2018), the main focus of this study is to obtain proxies of biomechanical load for these body parts. For convenience however, we refer to these proxies as biomechanical load metrics. Yet, it should be noted that these do not refer to the strict definition of “load” in the sense of forces.
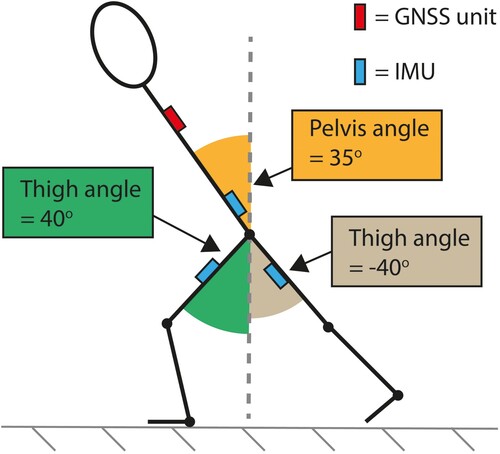
To reach the ball with their stick, field hockey players must flex at least one of their knees and bend their trunk and pelvis forward (see ). This body posture is associated with high gluteal and hamstring muscle activity (Farrokhi et al., Citation2008; Schoenfeld, Citation2010), suggesting high loads on these muscles while playing field hockey. This may also explain the relatively large amount of overuse injuries (Barboza S et al., 2018), with the thigh as the most frequently involved body part (Barboza et al., Citation2018; Cornelissen et al., Citation2020; Rees et al., Citation2020a) and the hamstrings as the most affected muscle group (Rees et al., Citation2021; Rees et al., Citation2020a; Rees et al., Citation2020b). In addition, field hockey players spent a considerable amount of time with their trunk flexed forward (Warman et al., Citation2019). When their trunk is flexed forward, they must counteract the resulting hip and back flexion moments by activating their back and hip extensor muscles. This potentially leads to relatively large biomechanical loads on these tissues in field hockey players compared to other sports. This may also be the reason for the relatively large burden of lower back injuries (Rees et al., Citation2021). In this study, we introduce a range biomechanical load metrics, which capture the time spent in these demanding body postures. Time under tension is an important factor in muscle fatigue. Muscle contractions lead to occlusion of the blood flow (de Ruiter et al., Citation2007), which increases anaerobic energy demands and accelerates muscle fatigue. In turn, fatigue has been shown to relate to injury risk. For example, most hamstring strains are sustained in the later parts each half of football matches (Ekstrand et al., Citation2023). Therefore, these metrics may serve as an indication of the loads on the muscle tissues involved in these postures.
Figure 1. Schematic representation of field hockey player in lunge position with forward flexed trunk and measurement setup with inertial measurement units (IMU) and global navigation satellite system (GNSS). The thigh angle is defined as the angle between the vertical (dashed line) and the thigh, whereby the angle is 0° when standing upright and positive (thigh angle > 0°) when the knee is in front of the hip. The pelvis angle is defined as the angle between the vertical and the pelvis, whereby the angle is 0° when standing upright and positive (pelvis angle > 0°) when the pelvis is tilted forward.
The aims of present study are to explore the potential of different biomechanical load metrics in field hockey that can be obtained with a simple to use inertial measurement unit (IMU) system worn by the players (Wilmes et al., Citation2020), and to compare these to load metrics derived from displacements on the field, which are currently being obtained in practice using GNSS systems. To this end, a range of field hockey specific movements were performed, including running with the stick in the hands but not on the ground, running with the stick on the ground to simulate running with the ball, and different types of hits and passes. In addition, these exercises were performed at two different action frequencies (number of field hockey specific actions per unit time). The latter was done to confirm that the biomechanical load metrics would increase (double) in proportion to the increase in load, which is important for any metric used for load quantification. It was hypothesized that the IMU system can be used to derive metrics that capture biomechanical load of hockey specific actions, which may be missed by GNSS due to the limited on-field displacement during these actions. In addition, it was expected that the IMU-derived biomechanical load metrics would be sensitive to the frequency of these hockey specific actions.
Methods
Participants
Sixteen active field hockey players participated in the study (age: 23.2 ± 4.1 years, weight: 67.9 ± 10.6 kg, height: 1.75 ± 0.11 m) of whom eight were male and eight were female. The sample included five defenders, four midfielders, and seven attackers who played at different levels ranging from trained to elite level (McKay et al., Citation2022). On average, the participants trained 3.9 ± 2.0 h per week, excluding matches.
Equipment
Three time-synchronized (see [ de Ruiter & van Dieën, Citation2019] for synchronization procedure) 9-DOF IMU’s (MPU-9150, Invensense, San Jose, CA, USA), which measure 3D linear acceleration, 3D angular velocity, and 3D magnetic field strength, were attached to the thighs and pelvis of each participant () according to procedures described previously (Wilmes et al., Citation2020). Data was sampled at 500 Hz and stored on a local SD-card, which was embedded in a small casing together with the IMU and a battery (size: 35 × 25 × 15 mm; total weight: 11 gr). Three dimensional orientations of each sensor were continuously estimated using a Madgwick gradient descent algorithm with filter gain β (determines weight between orientation update based on gyroscope measurements and orientation update based on accelerometer and magnetometer measurement) set to 0.043 as recommended for dynamic measurements (Madgwick et al., Citation2011). In addition, participants performed a standard sensor-to-segment calibration procedure (Wilmes et al., Citation2020), so the three-dimensional orientations of each body segment could be obtained. The sensor to segment calibration procedure included a static pose to determine the longitudinal axis of each body segment and a functional calibration (thigh rises and forward bending of the trunk) to determine the sagittal axis of each body segment. The algorithm to determine the body segment kinematics was validated for a variety of football-specific movements (see [ Wilmes et al., Citation2020; Kamstra et al., Citation2022] for details), and was deemed appropriate for this study. Furthermore, participants wore a vest with a GNSS unit (JOHAN V4, JOHAN Sports, Noordwijk, The Netherlands) between their scapulae (), which sampled positional data at a frequency of 10 Hz.
Procedures
Participants performed a self-selected warm up of approximately ten minutes before the experiment, after which the participants were equipped with the IMU and GNSS systems as mentioned above. Subsequently, participants performed seven different field hockey specific actions. These actions included the following: (1) a 23 m run with a stick in the hands but not on the ground, (2) a 23 m run with a stick on the ground to simulate running with a ball, (3) a push shot whereby the ball is dragged along the ground with the stick before it is released, (4) a sweep pass whereby the stick is sweeped parallel to the ground before it hits the ball, (5) a forehand hit whereby the ball is hit on the right side of the body, (6) a backhand hit whereby the ball is hit on the left side of the body, and (7) a drag flick which is a specialized type of shot used with penalty corners whereby the ball is dragged along the ground for a few steps to give the ball maximal speed before it is released. Each of these actions were performed for one minute and executed at two different action frequencies. The two action frequencies were three times per minute and six times per minute. After every minute of exercise, the participants had one minute of standing rest.
Data processing
All data were processed using custom written MATLAB scripts (version 2021a, Mathworks Inc, MA, USA). The three-dimensional body segment orientations were used to compute the angle of each body segment with respect to the vertical () using a “Y-X-Z” Euler decomposition of the orientation quaternions. These angles were then used to calculate several different proxy biomechanical load metrics for each one-minute of exercise, which quantified the time spent in body postures that are known to induce biomechanical loads on specific anatomical structures. The more time spent in such body postures during a training or match, would mean a higher cumulative training load. These proxy biomechanical load metrics included the following: (1) Time spent in a lunge position with forward flexed trunk, whereby this position was defined as a minimum thigh angle of 30° (front leg) with a concurrent minimum pelvis angle of 30°. This was calculated for both the left (Timelunge Left) and right (Timelunge Right) leg. (2) Time spent with a flexed thigh position, which was defined as time spent with a minimum thigh angle of 30°. This was calculated for both the left (Timethighflex Left) and right (Timethighflex Right) leg. (3) Time spent with a forward tilted pelvis (Timepelvictilt), which was defined as a minimum pelvis angle of 30°. In addition, the recently introduced Hip Load metric that has been shown to be a useful proxy metric for biomechanical load in football was calculated for the left (HL Left) and right (HL Right) hip(Bastiaansen et al., Citation2022; Wilmes et al., Citation2022). Hip Load is expressed in arbitrary units (A.U.) and is the squared magnitude of hip angular acceleration () divided by a scale factor to improve readability (see Equationequation 1(1)
(1) ). The angular acceleration the hip is related to the total joint moment, and in the HL metric it is squared to give higher intensity bouts a greater weight in the load estimate.
(1)
(1) Furthermore, the total covered distance (m) was obtained using the GNSS signals.
Statistics
Separate linear mixed models were used to quantify the effects of different field hockey specific movement and action frequency on each load metric. The models were constructed using the “lme4” package (Bates et al., Citation2014) in R version 2022.02.3-492 (Team RC, Citation2021). To allow for comparison between the different load metrics, each load metric was scaled to its respective standard deviation across all testing conditions. The type of movement and action frequency were modeled as fixed factors together with an interaction term between the type of movement and action frequency. In addition, the models included a random intercept for each participant to account for inter-individual differences in baseline values for the different load metrics. Differences in outcomes between the different exercises for each load metric were assessed separately for each level of action frequency using Turkey contrasts for multiple pairwise comparisons. Results were regarded as significant when p < 0.05.
Results
The results of the different load metrics for all exercises and exercise frequencies are shown in . It can be observed that all load metrics increased roughly proportionately to the increase in action frequency. The expected values resulting from the linear mixed models and their respective 95% confidence intervals are shown in . Parameter estimates of the linear mixed models and their respective confidence intervals are shown in supplementary materials.
Figure 2. Expected Values Linear Mixed Models. Each bar colour signifies a different exercise and the two action frequencies (3x, 6x) at which these exercises were performed are on the x-axis. The error bars show the 95% confidence intervals of the expected values. Before the linear mixed models were constructed, each load metric was normalized to its respective standard deviation across all conditions.
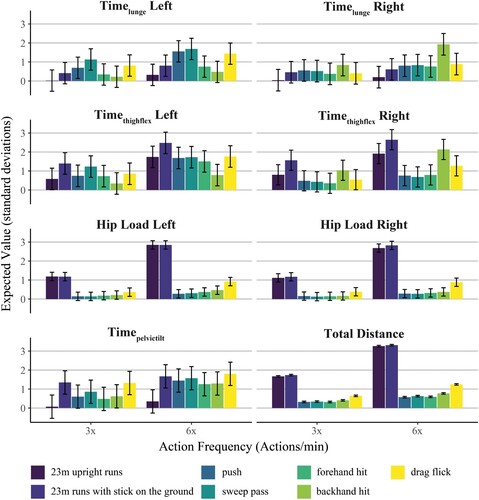
Table 1. Results load metrics. Results are presented as means ± standard deviations.
Timelunge Left was highest in the sweep pass for both action frequencies. In addition, Timelunge Left was significantly higher in the push, and sweep pass compared to the forehand and backhand hit (p < 0.001 – p = 0.015), and the 23 m runs (p < 0.001 – p = 0.029) for the highest action frequency. Timelunge Right was higher in the backhand hit compared to all other exercises (p < 0.001) for the highest action frequency, but only compared to the 23 m upright runs for the low action frequency (p = 0.031). Furthermore, Timethighflex Left and Timethighflex Right were higher during the 23 m runs with stick on the ground compared to all other exercises (p < 0.001) performed at the highest action frequency, except Timethighflex Right compared to the backhand hits (p = 0.077). Timepelvictilt was highest in the 23 m runs with stick on the ground and the drag flick. In addition, in accordance with the hypothesis, HL Left, HL Right, and total distance were higher in the 23 m runs compared to all other exercises (p < 0.001), but there were no differences between the 23 m runs with stick and the 23 m upright runs (p = 0.962 – p = 1.000).
Discussion
The aims of present study were to explore the potential of different biomechanical load metrics in field hockey that can be obtained with a simple IMU system worn by players, and to compare these biomechanical load metrics with covered distance. To that end, different proxies of biomechanical load that were expected to capture the hockey specific load were obtained for a variety of field hockey specific exercises performed at two different exercise frequencies. All the tested metrics approximately doubled when the action frequency doubled (). Total distance and Hip Loads were relatively high for the running exercises, but low for the different types of shots and passes. Moreover, the biomechanical load metrics that quantified the time spent in demanding body positions were generally higher for the different types of shots and passes, especially compared to running with the stick not on the ground.
In accordance with our hypothesis, all load metrics approximately doubled when the action frequency doubled, which is an important prerequisite for every load metric since the value of a load metric should increase proportionally to the increase in load that it aims to measure. Furthermore, the values of Hip Loads and total distance were greater for the running exercises compared to the different types of shots and passes. These results indicate that for exercises performed in this study, Hip Loads and total distance capture training load resulting from running-based activities but fail to capture biomechanical loads resulting from demanding body postures, which occur during the different types of shots and passes. Because these movements are frequently performed during field hockey training and matches, a considerable amount of biomechanical load may be missed when only GNSS systems are used for training load monitoring. Therefore, the present results highlight the potential value of training load monitoring systems capable of quantifying the biomechanical loads endured by field hockey players.
To be able to play the ball, field hockey players must flex their trunk forward and bend one of their knees, such that they can reach the ground with the end of their stick. When the trunk is flexed forward, the centre of mass of the upper body is in front of the hips. Therefore, hip extension and back extension moments generated by the hip and back extensor muscles are required to maintain this posture (Faber et al., Citation2016; Leinonen et al., Citation2000; Takahashi et al., Citation2006), leading to biomechanical loads on these tissues and the spine (Takahashi et al., Citation2006). As shown before, field hockey players spent a considerable amount of time with their trunk flexed forward (Warman et al., Citation2019), which is also reflected by present results. Compared to running upright, Timepelvictilt was higher in all exercises that required the stick to be on the ground for at least some amount of time. Although the pelvic tilt angle cannot be directly compared to the trunk angle, they both indicate the centre of mass of the upper body being in front of the hips, and thus the required hip extension and back extension moments. This aspect of biomechanical load is unique to sports that are being played with a stick and is overlooked with the training load monitoring systems that are currently available. Importantly, these loads may also be the reason for the relatively large burden of lower back injuries in field hockey compared to other sports (Rees et al., Citation2021). Although the dynamics of a movement are not captured with Timepelvictilt, it serves as rough indication of the cumulative loads and time under tension on the lower back muscles. Therefore, we think that including this metric leads to a more complete view of the total training load in field hockey players, which might help practitioners to reduce injury occurrence.
Besides the loads resulting from the forward flexion of the trunk, movements with the ball, such as a drag flick, also cause biomechanical loads on the lower limbs that may not be captured with GNSS systems because they do not involve large displacements of the body. Timelunge Left was higher in all types of shots and passes whereby the execution requires the stick to be at least somewhat parallel to the ground (push, sweep pass, and drag flick) compared to the running exercises, except the backhand hit. However, Timelunge Right was higher in the backhand hit compared to all other exercises. All these different types of hits and passes are complex coordinative movements, which are characterized by a proximal-to-distal transfer of kinetic energy from the trunk to the ball (Ibrahim et al., Citation2017). Field hockey players “step out” with their lead leg, which acts as the braking leg to allow for the forward acceleration of the trunk (Van Trigt et al., Citation2018), and thus the transfer of kinetic energy to the ball. As a result, field hockey players end up in a lunge position with a forward flexed trunk, whereby the lead leg must absorb most of the braking force. The time spent in this demanding body position is quantified with Timelunge. Because players are only allowed to play the ball with the flat side of the hockey stick, the ball is always played on the right side on the body with the push, sweep pass, and drag flick, whereas this is mostly on the left side with the backhand hit. Therefore, the lead leg that absorbs the braking forces is the left leg in the push, sweep pass, and drag flick but usually the right leg in case of a backhand hit. This is also reflected by the results presented in , indicating a higher Timelunge for the left leg during the push, sweep pass, and drag flick, and thus a higher estimated cumulative load on the left leg compared to the right leg. All in all, Timelunge is a metric that is aimed to reflect the cumulative biomechanical loads on the lead leg during the various types of passes and hits and can be used to distinguish between the loads on the left and right leg.
This study was not without limitations. First, there are no gold standard methods for measuring biomechanical load on body tissues (i.e. muscle forces, joint forces, muscle strains, etcetera) in the field (Verheul et al., Citation2020). Therefore, the time spent in body postures that are known to induce biomechanical loads on specific anatomical structures were used as proxies. Although the presented approach is a simplification of the actual biomechanical loads, it does allow coaches and medical staff to get an idea on the magnitude of these loads, which can otherwise not be quantified in the field. Second, a short explosive action is arguably associated with greater mechanical loads than a longer period in a static position. Practitioners should be aware that the biomechanical load metrics presented in this paper do not take these dynamical aspects of the executed movements into account. Further studies that consider the dynamic aspects of the field hockey specific movements are therefore suggested. For example, IMU-based estimations of ground reaction forces (Johnson et al., Citation2020) could be used in combination with the metrics presented in this paper. Third, in some exercises some of the participants leaned on their stick during the recovery periods between movements. When a player leans on the stick, the force through the stick generates a back extension and hip extension moment, which reduces the required muscle forces to maintain this posture. Some participants leaning on their stick during the recovery periods has led to slightly higher values and standard deviations for some of the biomechanical load metrics. However, this did not alter the conclusions of the study. Finally, this study only included well defined and separate field hockey specific movements. While this does provide valuable insights for the use of IMU-derived biomechanical load metrics, it remains to be seen how these load metrics would compare to GNSS-derived load metrics during actual play. In addition, similarly to GNSS-derived load metrics (Jennings et al., Citation2012), the biomechanical load may be different between the different player positions and between playing styles. Therefore, future research should be aimed at quantifying (proxies of) biomechanical loads of field hockey during exercises representative of training sessions and matches. Moreover, further work is required to establish to what extent the different metrics presented explain changes in injury risks.
Practical applications
The proxies of biomechanical load metrics in this paper can help field hockey coaches to quantify the biomechanical loads to which their players are exposed. Although in this study separate sensors were used, current developments in the integration of IMUs and electronics in wearables will make the presented methods accessible for daily practice (Steijlen et al., Citation2021).
Conclusions
The insights gained from this study may be of assistance to training load monitoring in field hockey. All proxies of biomechanical load increased proportionally to the increase in action frequency, which confirms that these metrics can quantify increases in load. Moreover, the presented IMU-derived proxies of biomechanical load can be used estimate field hockey specific biomechanical loads, which cannot be measured or captured using GNSS systems. This allows coaches and medical staff to get a more complete view of the training load of their field hockey players.
Supplemental Material
Download MS Word (21.7 KB)Acknowledgements
The authors would like to Doris van der Laan for her help in recruiting participants. In addition, we would like to thank Marc Jansen from HC Bloemendaal for lending their JOHAN GNSS system.
Disclosure statement
No potential conflict of interest was reported by the author(s).
Additional information
Funding
References
- Bastiaansen, B. J., Vegter, R. J., Wilmes, E., de Ruiter, C. J., Lemmink, K. A., & Brink, M. S. (2022). Biomechanical load quantification using a lower extremity inertial sensor setup during football specific activities. Sports Biomechanics, 1–16. https://doi.org/10.1080/14763141.2022.2051596
- Bates, D., Mächler, M., Bolker, B., & Walker, S. (2014). Fitting linear mixed-effects models using lme4. arXiv preprint arXiv:14065823.
- Cornelissen, M., Kemler, E., Verhagen, E., & Gouttebarge, V. (2020). A systematic review of injuries in recreational field hockey: From injury problem to prevention. Journal of Sports Sciences, 38(17), 1953–1974. https://doi.org/10.1080/02640414.2020.1764898
- Delfino Barboza, S., Joseph, C., Nauta, J., Van Mechelen, W., & Verhagen, E. (2018). Injuries in field hockey players: A systematic review. Sports Medicine, 48(4), 849–866. https://doi.org/10.1007/s40279-017-0839-3
- de Ruiter, C. J., Goudsmit, J. F., Van Tricht, J. A., & de Haan, A. (2007). The isometric torque at which knee-extensor muscle reoxygenation stops. Medicine & Science in Sports & Exercise, 39(3), 443–453. https://doi.org/10.1249/mss.0b013e31802dd3cc
- de Ruiter, C. J., & van Dieën, J. H. (2019). Stride and step length obtained with inertial measurement units during maximal sprint acceleration. Sports, 7(9), 202. https://doi.org/10.3390/sports7090202
- Edwards, W. B. (2018). Modeling overuse injuries in sport as a mechanical fatigue phenomenon. Exercise and Sport Sciences Reviews, 46(4), 224–231. https://doi.org/10.1249/JES.0000000000000163
- Ekstrand, J., Bengtsson, H., Waldén, M., Davison, M., Khan, K. M., & Hägglund, M. (2023). Hamstring injury rates have increased during recent seasons and now constitute 24% of all injuries in men’s professional football: The UEFA Elite Club Injury Study from 2001/02 to 2021/22. British Journal of Sports Medicine, 57, 292–298. https://doi.org/10.1136/bjsports-2021-105407.
- Faber, G. S., Chang, C., Kingma, I., Dennerlein, J., & Van Dieën, J. (2016). Estimating 3D L5/S1 moments and ground reaction forces during trunk bending using a full-body ambulatory inertial motion capture system. Journal of Biomechanics, 49(6), 904–912. https://doi.org/10.1016/j.jbiomech.2015.11.042
- Farrokhi, S., Pollard, C. D., Souza, R. B., Chen, Y.-J., Reischl, S., & Powers, C. M. (2008). Trunk position influences the kinematics, kinetics, and muscle activity of the lead lower extremity during the forward lunge exercise. Journal of Orthopaedic & Sports Physical Therapy, 38(7), 403–409. https://doi.org/10.2519/jospt.2008.2634
- Ibrahim, R., Faber, G. S., Kingma, I., & van Dieën, J. H. (2017). Kinematic analysis of the drag flick in field hockey. Sports Biomechanics, 16(1), 45–57. https://doi.org/10.1080/14763141.2016.1182207
- Jennings, D. H., Cormack, S. J., Coutts, A. J., & Aughey, R. J. (2012). International field hockey players perform more high-speed running than national-level counterparts. Journal of Strength and Conditioning Research, 26(4), 947–952. https://doi.org/10.1519/JSC.0b013e31822e5913
- Johnson, W. R., Mian, A., Robinson, M. A., Verheul, J., Lloyd, D. G., & Alderson, J. A. (2020). Multidimensional ground reaction forces and moments from wearable sensor accelerations via deep learning. IEEE Transactions on Biomedical Engineering, 68(1), 289–297. https://doi.org/10.1109/TBME.2020.3006158
- Kamstra, H., Wilmes, E., & van der Helm, F. C. (2022). Quantification of error sources with inertial measurement units in sports. Sensors, 22(24), 9765. https://doi.org/10.3390/s22249765
- Leinonen, V., Kankaanpää, M., Airaksinen, O., & Hänninen, O. (2000). Back and hip extensor activities during trunk flexion/extension: Effects of low back pain and rehabilitation. Archives of Physical Medicine and Rehabilitation, 81(1), 32–37. https://doi.org/10.1016/s0003-9993(00)90218-1
- Lim, J. Z., Sim, A., & Kong, P. W. (2021). Wearable technologies in field hockey competitions: A scoping review. Sensors, 21(15), 5242. https://doi.org/10.3390/s21155242
- Madgwick, S. O., Harrison, A. J., & Vaidyanathan, A. (2011). Estimation of IMU and MARG orientation using a gradient descent algorithm. Ieee International Conference on Rehabilitation Robotics, 2011, 5975346. https://doi.org/10.1109/ICORR.2011.5975346
- McKay, A. K., Stellingwerff, T., Smith, E. S., Martin, D. T., Mujika, I., Goosey-Tolfrey, V. L., Sheppard, J., & Burke, L. M. (2022). Defining training and performance caliber: A participant classification framework. International Journal of Sports Physiology and Performance, 17(2), 317–331. https://doi.org/10.1123/ijspp.2021-0451
- Ng, L., Sherry, D., Loh, W. B., Sjurseth, A. M., Iyengar, S., Wild, C., & Rosalie, S. (2016). The prevalence and severity of injuries in field hockey DraG flickers: A retrospective cross-sectional study. Journal of Sports Sciences, 34(18), 1746–1751. https://doi.org/10.1080/02640414.2015.1136072
- Rees, H., McCarthy Persson, U., Delahunt, E., Boreham, C., & Blake, C. (2020a). Epidemiology of injuries in senior men’s field hockey: A two-season prospective observational injury surveillance study. Journal of Sports Sciences, 38(24), 2842–2849. https://doi.org/10.1080/02640414.2020.1802094
- Rees, H., McCarthy Persson, U., Delahunt, E., Boreham, C., & Blake, C. (2021). The burden of injury in field hockey: A secondary analysis of prospective cohort data. Scandinavian Journal of Medicine & Science in Sports, 31(4), 884–893. https://doi.org/10.1111/sms.13904
- Rees, H., Shrier, I., McCarthy Persson, U., Delahunt, E., Boreham, C., & Blake, C. (2020b). Transient injuries are a problem in field hockey: A prospective one-season cohort study. Translational Sports Medicine, 3(2), 119–126. https://doi.org/10.1002/tsm2.126
- Schoenfeld, B. J. (2010). Squatting kinematics and kinetics and their application to exercise performance. The Journal of Strength & Conditioning Research, 24(12), 3497–3506. https://doi.org/10.1519/JSC.0b013e3181bac2d7
- Steijlen, A., Burgers, B., Wilmes, E., Bastemeijer, J., Bastiaansen, B. J. C., French, P., Bossche, A., Jansen. (2021). Smart sensor tights: Movement tracking of the lower limbs in football. Wearable Technology, 2, e17. http://doi.org/10.1017/wtc.2021.16
- Takahashi, I., Kikuchi, S.-i., Sato, K., & Sato, N. (2006). Mechanical load of the lumbar spine during forward bending motion of the trunk–A biomechanical study. Spine, 31(1), 18–23. https://doi.org/10.1097/01.brs.0000192636.69129.fb
- Team RC. (2021). R: A language and environment for statistical computing. Vienna, Austria.
- Vanrenterghem, J., Nedergaard, N. J., Robinson, M. A., & Drust, B. (2017). Training load monitoring in team sports: A novel framework separating physiological and biomechanical load-adaptation pathways. Sports Medicine, 47(11), 2135–2142. https://doi.org/10.1007/s40279-017-0714-2
- Van Trigt, B., Schallig, W., Van der Graaff, E., Hoozemans, M. J., & Veeger, D. (2018). Knee angle and stride length in association with ball speed in youth baseball pitchers. Sports, 6(2), 51. https://doi.org/10.3390/sports6020051
- Verheul, J., Nedergaard, N. J., Vanrenterghem, J., & Robinson, M. A. (2020). Measuring biomechanical loads in team sports–from lab to field. Science and Medicine in Football, 4(3), 246–252. https://doi.org/10.1080/24733938.2019.1709654
- Warman, G. E., Cole, M. H., Johnston, R. D., Chalkley, D., & Pepping, G.-J. (2019). Using microtechnology to quantify torso angle during match-play in field hockey. Journal of Strength and Conditioning Research, 33(10), 2648–2654. https://doi.org/10.1519/JSC.0000000000003238
- Wilmes, E., Bastiaansen, B. J. C., de Ruiter, C. J., Vegter, R. J. K., Brink, M. S., Weersma, H., Goedhart, E. A., Lemmink, K. A. P. M., & Savelsbergh, G. J. P. (2022). Construct validity and test–retest reliability of hip load compared with playerload during football-specific running, kicking, and jumping tasks. International Journal of Sports Physiology and Performance, 1, 3–10. https://doi.org/10.1123/ijspp.2022-0194. In press.
- Wilmes, E., de Ruiter, C. J., Bastiaansen, B. J., Zon, J. F. J. A. v., Vegter, R. J. K., Brink, M. S., Goedhart, E. A., Lemmink, K. A. P. M., & Savelsbergh, G. J. P. (2020). Inertial sensor-based motion tracking in football with movement intensity quantification. Sensors, 20(9), 2527. https://doi.org/10.3390/s20092527