
ABSTRACT
Personal space regulation ensures the maintenance of a margin of safety between the individual and the surrounding world. However, little is known about the specific neural mechanisms implicated in regulating the distance from conspecifics versus non-social stimuli. Here, we investigated the neural correlates of personal space intrusions by social versus non-social stimuli. Thirty volunteers underwent fMRI scanning while viewing approaching or withdrawing faces (Social) and insects/arachnids (Non-social). Preferred distance to the stimuli was assessed behaviourally in a computerized task, and in real life. Results showed that approaching social and non-social stimuli of varying threat levels elicited activation of frontoparietal regions previously linked to peripersonal space, as well as of the midbrain periaqueductal gray, suggesting the engagement of defensive mechanisms by personal space intrusions. However, functional connectivity patterns of the midbrain differed for social and non-social stimuli, with enhanced coupling with the premotor cortex to approaching social stimuli. Additionally, connectivity strength between the midbrain and the premotor cortex was associated with preferred interpersonal distance. These findings highlight a common defensive architecture implicated in personal space regulation to social and non-social stimuli, and the specific neural mechanisms involved in regulating the distance from conspecifics.
Introduction
Personal space serves a general defensive purpose by maintaining a margin of safety around the body that allows for the selection of appropriate responses to interact with the physical and social worlds. In social interactions specifically, the distance kept from other individuals constitutes an important communication cue, and prevents feelings of discomfort that typically arise when one’s personal space is breached (Hayduk, Citation1978, Citation1983). However, it is unknown whether specific neural mechanisms are in place for regulating personal space in social contexts as opposed to biological non-social contexts for humans.
Animal (Clery, Guipponi, Wardak, & Ben Hamed, Citation2015) and human (e.g., Bartolo et al., Citation2014; Ferri et al., Citation2015; Grivaz, Blanke, & Serino, Citation2017; Holt et al., Citation2014) studies have pointed to a frontoparietal network that creates a multisensory representation of the reachable space around the body (peripersonal space; PPS), and drives appropriate motor responses (Di Pellegrino & Ladavas, Citation2015; Graziano & Cooke, Citation2006; Grivaz et al., Citation2017). In humans, neuroimaging studies have identified a bilateral PPS network encompassing superior parietal, premotor, and temporoparietal regions (Grivaz et al., Citation2017). The ventral premotor cortex (PMv) and intraparietal sulcus (IPS), particularly, were shown to respond preferentially to faces moving towards the individual (Holt et al., Citation2014; Vieira, Tavares, Marsh, & Mitchell, Citation2017), a bias that was not observed for objects (Holt et al., Citation2014). This suggests, in humans, those structures might privilege personal space intrusions by conspecifics, but the extent to which this mechanism directly overlaps with that associated with approaching non-social biological stimuli (e.g., non-human organisms) has not been formally tested.
Brain regions like the amygdala and insula have also shown a bias towards approaching relative to static or receding faces (Schienle, Wabnegger, Leitner, & Leutgeb, Citation2017; Schienle, Wabnegger, Schongassner, & Leutgeb, Citation2015; Vieira et al., Citation2017; Wabnegger, Leutgeb, & Schienle, Citation2016). In addition to their involvement in other processes relevant for social behaviour (e.g., social cognition, empathy, reward processing), both these regions are part of a graded defensive system that respond more generally to threat proximity (McNaughton & Corr, Citation2004; Mobbs, Hagan, Dalgleish, Silston, & Prevost, Citation2015; Wendt, Low, Weymar, Lotze, & Hamm, Citation2017). Proximal and looming threatening stimuli (in previous studies, geometric figures associated with a shock, or a tarantula) preferentially engaged the midbrain periaqueductal gray (PAG), amygdala, and dorsal anterior cingulate cortex (dACC), whereas distal and retreating threats activated the ventromedial prefrontal cortex (vmPFC), posterior cingulate and hippocampus (Mobbs et al., Citation2009, Citation2010). These findings suggest the involvement of a widespread defensive system in the response to threats. Although defensive regions (such as the amygdala and insula) have been shown to respond to faces, it has never been formally assessed how the complete defensive system responds to looming social versus non-social stimuli. Critically, it has never been examined how those threat responses may be involved in responding to personal space intrusions.
In this study, we directly compared the neural responses to personal space intrusions by conspecifics versus non-social biological stimuli, and determined the contribution of the defensive system, in addition to fronto-parietal structures, to personal space regulation. We used an fMRI paradigm wherein social (human faces) and non-social (insects/arachnids) stimuli of varying threat levels appeared to either approach or withdraw from the participant. We predicted that independent of direction and threat level, social relative to non-social stimuli would elicit greater activity in face processing regions (Fusiform face area; Ghuman et al., Citation2014; Grill-Spector, Weiner, Kay, & Gomez, Citation2017), and regions implicated in inferring mental states (temporoparietal junction (TPJ) and medial prefrontal cortex (MPFC); Koster-Hale et al., Citation2017; Molenberghs, Johnson, Henry, & Mattingley, Citation2016; Thye, Murdaugh, & Kana, Citation2018). However, personal space intrusions by both stimulus categories would engage defensive regions, in addition to the PPS system. Specifically, whereas near and approaching stimuli would be associated with increased activation in the midbrain PAG, dACC and amygdala (Mobbs et al., Citation2009, Citation2010; Qi et al., Citation2018), as well as in the PMv and IPS (Holt et al., Citation2015; Vieira et al., Citation2017), far and withdrawing stimuli would recruit the vmPFC, posterior cingulate and hippocampus (Mobbs et al., Citation2009, Citation2010; Qi et al., Citation2018). We also predicted that functional connectivity patterns of defensive regions during personal space intrusions would differ for social and non-social stimuli, with the former showing greater engagement of regions involved in mental state inference (e.g., TPJ and MPFC; Vieira et al., Citation2017). Finally, we assessed the association between functional connectivity patterns and preferred interpersonal distance.
Materials and methods
Participants
Thirty healthy volunteers, recruited through advertisements posted in the University of Western Ontario, participated in the study (24 F, Age = 21.90, SD = 3.51). All participants were right-handed, had a normal or corrected-to-normal vision, and reported having no history of psychiatric or neurological diagnoses, brain injuries or substance abuse. The study was approved by the Health Sciences Research Ethics Board at the University of Western Ontario (London, ON, Canada). Participants provided written informed consent and were compensated for their time.
Stimuli
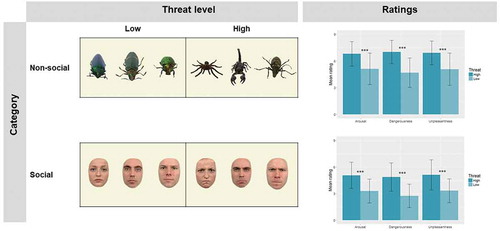
Social and non-social stimuli of varying threat levels were used in the experimental tasks. Social stimuli were pictures of faces displaying either angry (high threat) or neutral (low threat) facial expressions (). Six faces (three angry and three neutral) from three Caucasian actors (2 M, 1 F) were selected from the Radboud Faces Database (Langner et al., Citation2010). Images were cropped to remove extraneous features around the face, and the edges smoothed. Non-social stimuli were high-resolution photographs taken from rehydrated entomological specimens. These included a tarantula, a scorpion and a longhorn beetle (high threat), and three different colorful beetles (low threat; ). All stimuli were rated by an independent sample (N = 24) that provided ratings of valence (“unpleasantness”), arousal, and dangerousness on 9-point scales inspired by the Self-Assessment Manikin (Bradley & Lang, Citation1994). These data showed high threat stimuli, both social and non-social, were perceived as significantly more unpleasant, more arousing and more dangerous than the low threat stimuli (all ps <.001; ; full stats are available in Supplemental Material). Pictures were edited to remove the background, and the edges smoothed. A light background (RGB 245, 245, 220) was added to all images (social and non-social) to improve their visibility in the scanner. Also, to increase the number of unique stimuli presented in the task, all images were flipped horizontally based on previous work (Connolly et al., Citation2016), resulting in a total of 12 social and 12 non-social images. Image size was balanced across category and threat level (more detailed information will be provided in the task descriptions below).
Figure 1. On the left panel, stimuli used in the experimental tasks. All stimuli were flipped horizontally, resulting in 24 unique images (12 non-social and 12 social, 12 high threats and 12 low threats). On the right panel, ratings of Arousal, Dangerousness, and Unpleasantness provided by an independent sample (N = 24). Error bars represent the standard deviation from the mean. *** p < .001.
fMRI task
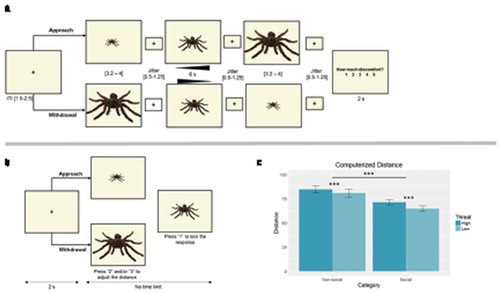
To investigate BOLD responses associated with personal space intrusions, participants underwent fMRI scanning while they viewed social and non-social stimuli that either increased or decreased in size, appearing to move towards the observer (Approach) or away from them (Withdrawal), respectively ((a)). In approach trials, participants viewed a static image displayed in its minimum size (Far; 3.2 – 4 s) that subsequently increased by a factor of 1.13 (Approach; 20 frames over 6 s), followed by another static presentation in its maximum size (Near; 3.2 – 4 s). Withdrawal trials followed the same sequence and timing, but the initial image was presented in its maximum size (Near), which subsequently decreased by the same factor, terminating with a far static presentation. Jittered intervals (0.5–1.5) were added between all events (first image, approach/withdrawal, second image, response slide), in order to more reliably capture the variability of the BOLD response and improve temporal and spatial resolution (Watanabe, Bartels, Macke, Murayama, & Logothetis, Citation2013). Participants were instructed to stay focused on the image and, at the end of each trial, rated their level of discomfort (2 s) using a 5-point scale. Responses were made on a five-button response box.
Figure 2. (a). Schematic representation of the fMRI task, wherein participants passively viewed non-social and social stimuli of different threat levels move towards (Approach) or away (Withdrawal) from them, and rated their discomfort level. Non-social condition is displayed. (b). Schematic representation of the computerized distance task, wherein participants manipulated the distance from social and non-social stimuli by adjusting their size on the screen. Non-social condition is displayed. (c). Behavioral responses in the computerized distance task showed greater distances for high relative to low threat stimuli, and for non-social relative to social stimuli. *** p< .001.
Participants completed eight functional runs of 24 trials each (≈ 8 min per run). Each run included four randomly presented social and non-social blocks (two approaches and two withdrawals of each category). Each block comprised three high threats and three low threats randomly presented trials. The order of functional runs was randomized across participants. The task was programmed and delivered using E-prime 2.0 (Psychology Software Tools Inc.). All stimuli were presented in the scanner using a Silent VisionTM Extended Range XR Fiber Optic Visual System (SV-7021), which allowed for binocular two-dimensional stimulus presentations with little extraneous visual information. Stimuli were presented within a 30° (horizontal) by 23° (vertical) field of view.
Computerized distance task
In addition to examining BOLD responses to personal space intrusions, we were also interested in assessing the association between those responses and interpersonal distance regulation. The purpose of the computerized distance task was to assess the preferred interpersonal distance to the stimuli used in the fMRI paradigm. In this task, participants adjusted the distance from social and non-social stimuli by changing their size on a computer screen, outside the scanner. They were instructed to keep in mind the distance they would normally keep from those objects (i.e., strangers and insects/arachnids) in real life. The task comprised 48 Approach trials (stimuli were initially small, simulating greater distance), and 48 Withdrawal trials (stimuli were initially bigger, simulating closer distance), presented randomly. For each 48, 24 were social (12 high and 12 low threats), and 24 were non-social (12 high and 12 low threats; (b)). In each trial, participants pressed “2” on the keyboard to bring the image closer (size increased by a factor of 1.13), and “3” to push it back (size decreased by a factor of 1.13). They were given unlimited time to press the buttons as many times as necessary to achieve the desired distance, upon which they pressed “1” to lock their response and move on to the next trial. The task was programmed and delivered using E-prime 2.0 (Psychology Software Tools Inc.), running on a Lenovo ThinkPad W540 (1920 X 1080 pixels, refresh rate 60 Hz). Image size was balanced across category and threat level. Non-social images ranged from 2.5 to 25 cm (width) and 2 to 20 cm (height); social images ranged from 2 to 20 cm (width) and 2 to 20 cm (height). Stimuli were presented within a 28° (horizontal) by 23° (vertical) field of view.
“Stop-distance” task
As in our prior work (Vieira et al., Citation2017), we were interested in confirming that performance in the computerized task predicted distance preferences in real-life. We therefore also asked participants to complete a “Stop-distance task” akin to that used in prior studies (Kennedy, Glascher, Tyszka, & Adolphs, Citation2009; Vieira & Marsh, Citation2014; Vieira et al., Citation2017), which provided a more ecologically valid measure of preferred interpersonal distance. Participants performed this task outside of the scanner in a social and non-social condition (order counterbalanced across participants). In the social condition, they adjusted the distance between themselves and an experimenter across a series of trials. Four trials were completed with a male experimenter, and four with a female experimenter, and the order was counterbalanced across participants. In each trial, the experimenter stood 3 m away and walked towards the participant at a natural gait (approximately 1m/s). Participants were instructed to tell the experimenter to stop at their preferred distance (i.e., the distance at which they felt “the most comfortable”, using as a reference the distance they would keep to have a conversation with a stranger). Chin-to-chin distance was recorded in each trial using a digital laser tape measure (Bosch GLM 15). In the non-social condition, participants adjusted the distance between themselves and the tarantula specimen across four trials. In each trial, the tarantula was placed on a table, 3 m away from the participant and then slowly moved across the table in their direction. Participants sat at the other end of the table, with their chin on a chin-rest, and were instructed to tell the experimenter to stop moving the tarantula at the distance they thought they would start to feel uncomfortable “if it was actually alive and crawling in their direction”. Distance between the chin of the participant and the tarantula was recorded using the same laser tape measure. Of note, while chin-to-chin distance is an ecologically valid measure in social contexts, that is not necessarily the case towards non-social stimuli (i.e., humans frequently encounter spiders approaching other parts of the body). However, the same metric was adopted in order to match the social and non-social conditions as much as possible, as well as to parallel the way social and non-social stimuli were presented in the computerized and fMRI tasks.
Table 1. Descriptive statistics (mean and standard deviation in brackets) for discomfort ratings during the fMRI task, distance in the computerized task, and preferred distance (m) in the “Stop-distance” task. Discomfort ratings were provided in a 1–5 scale; distance in the computerized task was operationalized as the inverse of the percentage of maximum image size (such that values vary from 0 to 100 and greater values represent greater distance); distance in the “stop-distance” task is provided in meters.
Table 2. Brain regions displaying greater activation for moving (A) and static (B) social relative to non-social stimuli, and non-social relative to social stimuli, controlling for level of discomfort. (FDR p < .05; MNI coordinates of the peak voxel are reported).
Table 3. Brain regions displaying greater activation for Approach > Withdrawal, and Withdrawal > Approach (A), and results of the conjunction analyses (B) (FDR p < .05; MNI coordinates of the peak voxel are reported).
Procedures
Functional neuroimaging took place in one session at Western’s Center for Functional and Metabolic Mapping (University of Western Ontario). After providing written consent, participants either started with the MRI scan or with the behavioral portion of the study (comprising the computerized distance task and the “Stop-distance” task), and the order was counterbalanced across participants.
fMRI acquisition, preprocessing, and analysis
Subjects were scanned in a single session using a 3T Siemens Scanner with a 32-channel head coil. Functional images were taken with an echo-planar T2*-weighted imaging sequence with whole-brain coverage while participants performed the fMRI task (TR = 1250 ms, TE = 30 ms, FoV = 192 mm, flip angle = 40°, 57 interleaved slices of 2.00 mm isovoxels, 390 volumes per run, multiband acceleration factor (M) of 3). Scan parameters were chosen to optimize the signal-to-noise ratio for the amygdala based on recent recommendations (Morawetz et al., Citation2008; Robinson, Windischberger, Rauscher, & Moser, Citation2004). After four functional runs, a high resolution T1-weighted anatomical scan was obtained (TR = 2300 ms, TE = 2.98 ms; FoV = 256 mm, flip angle = 9°, 192 axial slices of 1 mm isovoxels), followed by four more functional runs.
Preprocessing of fMRI data was done using SPM12 (Wellcome Trust Centre for Neuroimaging, www.fil.ion.ucl.ac.uk). After slice timing correction, images were realigned to the volume acquired immediately before the anatomical scan, using six parameter rigid-body transformations. They were then coregistered with the structural data, normalized to standard space using the Montreal Neurological Institute (MNI) template with a voxel size of 2 x 2 × 2 mm, and smoothed using a Gaussian kernel with an isotropic full-width-half-maximum of 4 mm. Small to moderate kernel sizes are recommended to detect activation in small structures such as the amygdala and the midbrain PAG (Skudlarski, Constable, & Gore, Citation1999). Our acquisition parameters (namely slice thickness and TE) and spatial smoothing kernel were further based on recommendations by Morawetz et al. (Citation2008) and Robinson et al. (Citation2004) to optimize signal-to-noise ratio in the amygdala: the use of 2 mm slices has been associated with fewer susceptibility artifacts, and moderate smoothing has been recommended to balance sensitivity and specificity. Additionally, a high-pass filter cutoff of 128 s was applied to remove slow signal drifts.
First-level analysis was based on the general linear model. Time-series of each voxel was normalized by dividing the signal intensity of a given voxel at each point by the mean signal intensity of that voxel for each run and multiplying it by 100. Resulting regression coefficients thus represent a percent signal change from the mean. Regressors were created by convolving the train of stimulus events with a canonical hemodynamic response function. Twenty-four events of interest were modeled, corresponding to both the 6-s approaching/withdrawing epoch, and to the static images at the beginning and end of each trial (3.2 – 4 s). For the former, events were modeled as a function of Category (Social or Nonsocial), Threat level (High or Low) and Direction of movement (Approach or Withdrawal), resulting in eight regressors; for the start and end images, events were modeled as a function of Category, Threat level, Direction and Distance (Near or Far), resulting in 16 regressors. An additional regressor of no interest was created, including all response slides (2 s). The six motion parameters estimated during realignment were also included in the model as regressors of no interest.
Statistical analysis
Behavioral data
Our behavioral measures included the distance set in the computerized distance task, which were operationalized as [100 – percentage of stimulus maximum size] and discomfort ratings in the fMRI task. For the computerized distance, we performed a 2 (Social, Non-social) by 2 (High, Low threat) repeated-measures ANOVA. One participant was removed from all analyses involving computerized distance due to an insufficient number of valid responses in that task. Specifically, this participant set his preferred distance shorter than the closest possible starting distance (i.e., the maximum size of the image on the screen), leading to negative distance values. For the discomfort ratings, we performed a 2 (Social, Non-social) by 2 (High, Low threat) by 2 (Approach, Withdrawal) repeated-measures ANOVA. Because discomfort distributions for non-social stimuli were skewed and deviated from normality, all values (social and non-social) were log-transformed before entered in the ANOVA. To confirm that performance in the computerized task was related to real-life distance preferences, we performed correlations between: (1) distance to neutral faces in the computerized task and averaged preferred distance in the “Stop-distance” task; and, (2) distance to high threat non-social stimuli in the computerized task, and to the tarantula specimen in the “Stop-distance” task. Finally, we also examined the correlation between preferred distance to social and non-social stimuli within the computerized and real-life tasks. Three outliers identified in the distribution of computerized distances to non-social stimuli (>2 SDs above the mean) were removed from the analyses. Greenhouse-Geisser correction was used for departures from sphericity when needed. Sidak correction was used to adjust for multiple comparisons to follow-up on ANOVA main effects and interactions. All behavioral analyses were carried out in SPSS version 23 (IBM Corp), and the threshold for statistical significance was set at p< .05 two-tailed.
fMRI data
To quantify the main effects of our three task variables (Category, Threat and Direction) and identify potential interactions in hypothesized brain regions, we performed a whole-brain 2 (Social, Non-social) by 2 (High, Low threat) by 2 (Approach, Withdrawal) repeated-measures ANOVA, followed by targeted contrasts to address our specific predictions. As stated in our hypotheses, we were mainly interested in the response of defensive brain regions (midbrain PAG, amygdala, dACC, vmPFC, PCC and hippocampus), peripersonal space regions (PM and IPS) and mentalizing regions (TPJ and MPFC). However, given the novelty of our paradigm, a whole-brain approach was adopted to allow for the exploration of additional potentially relevant regions not considered in the hypotheses (full ANOVA results are available in Supplemental Material).
To examine neural responses associated with the distance of static stimuli, we analyzed the first image of each trial using the same strategy described above [whole-brain 2 (Social, Non-social) by 2 (High, Low threat) by 2 (Near, Far) repeated-measures ANOVA, followed by targeted contrasts]. The decision to use the first slide instead of the last was motivated by our desire to minimize the potential cognitive impact of having already experienced the stimuli approaching/withdrawing prior to processing the last slide.
First, to identify brain regions that responded preferentially to social versus non-social stimuli, independent of direction/distance and threat level, we examined Social > Non-social and Non-social > Social contrasts. To control for differences in discomfort level elicited by social and non-social stimuli, discomfort ratings collected in the fMRI task were entered as a covariate.
Then, to test whether personal space intrusions by social and non-social stimuli recruited defensive and PPS regions, we took two different approaches. We first examined the clusters displaying a main effect of direction and, specifically, the brain regions responding preferentially to approaching (Approach > Withdrawal) or withdrawing (Withdrawal > Approach) stimuli. In addition, to confirm whether social and non-social threats specifically recruited similar brain regions, we performed two-conjunction analyses using the minimum statistic compared to the conjunction null (Nichols, Brett, Andersson, Wager, & Poline, Citation2005). In one, we assessed the overlap between regions engaged in approaching relative to withdrawing non-social threats and approaching relative to withdrawing social threats [(Non-social high threat Approach > Withdrawal) ˄ (Social high threat Approach > Withdrawal)]. The other examined the overlap between withdrawing relative to approaching non-social threats and withdrawing relative to approaching social threats [(Non-social high threat Withdrawal > Approach) ˄ (Social high threat Withdrawal > Approach)]. Because near and approaching stimuli were previously shown to elicit comparable neural responses (Mobbs et al., Citation2010), we performed parallel contrasts and conjunction analyses using the first static image in each trial [Near > Far; Far > Near; (Non-social high threat Near > Far) ˄ (Social high threat Near > Far); (Non-social high threat Far > Near) ˄ (Social high threat Far > Near)].
We then performed Psychophysiological Interaction (PPI) analyses to examine whether the functional connectivity patterns of hypothesized defensive regions differed for social and non-social stimuli. PPI analysis in a non-directional technique that aims to identify voxels in the brain that show functional coupling (i.e., correlated activity) with a seed region of interest in a given task condition (O’Reilly, Woolrich, Behrens, Smith, & Johansen-Berg, Citation2012). Given our focus on personal space intrusions, and in line with prior studies (Mobbs et al., Citation2009, Citation2007, Citation2010; Qi et al., Citation2018), we examined the functional connectivity of the midbrain PAG social versus non-social stimuli. To define the seed region, we used a functional approach akin to Mobbs et al. (Citation2009), wherein the MNI coordinates of the peak midbrain PAG voxel identified in whole-group Approach > Withdrawal (xyz = 6, −30, −4) were used to define a standardized 6 mm sphere across all participants. This approach extends the previous whole-brain analysis by inquiring directly what regions are functionally coupled with the midbrain PAG during personal space intrusions. PPI analysis included three steps. First, we extracted the time series of preprocessed BOLD signal from the seed. We then estimated the interaction between the time course of the seed (physiological variable) and the task contrast of interest (psychological variable; in our case, Social > Non-social), and convolved it with the canonical hemodynamic response function. In the final step, a new GLM was estimated for each participant, modeling the time series of the seed, the contrast of interest, and the psycho-physiological interaction. Individual PPI maps were then analyzed through one sample T-tests to estimate group effects. To control for differences in the discomfort elicited by social and non-social stimuli, discomfort ratings were entered as a covariate in the analyses. To examine potential associations between connectivity strength and distance preferences, parameter estimates from significant clusters in the PPI analyses were extracted and correlated with computerized distance and Stop-distance using SPSS.
As stated above, the main objective of the PPI analysis was to assess the functional connectivity patterns of defensive regions during personal space intrusions. We, therefore, focused on midbrain PAG functional connectivity during the approach, for Social versus Non-social stimuli. For completion, we also explored the functional connectivity of the vmPFC during withdrawal trials for social versus non-social stimuli, based on prior work (Mobbs et al., Citation2009, Citation2010). Since these analyses were exploratory, and for the sake of conciseness, the results are presented in the Supplemental material.
To minimize Type I errors in the analyses, only results found at a cluster-forming threshold of p< .001 uncorrected, and a False Discovery Rate (FDR)-corrected p< .05 at the cluster-level are reported.
Results
Behavioral results
For computerized distance, results showed main effects of category (F (1, 24) = 37.158, p < .001; distance non-social > social), and threat (F (1, 24) = 24.006, p < .001; high > low threat), but no category by threat interaction (; (c)).
For discomfort ratings, results showed main effects of category (F (1, 29) = 11.87, p = .002; discomfort non-social > social), threat (F (1, 29) = 68.61, p < .001; high threat > low threat), and direction (F (1, 29) = 26.70, p < .001; approach > withdrawal). No significant interactions were found ().
The correlation analysis revealed a significant association between distance to pictures of neutral faces during the computerized task and average preferred distance to real-people in the Stop-distance task (r = .377, p = .044). For non-social stimuli, results showed a correlation between distance to pictures of threatening specimens during the computerized task and distance to the real tarantula (r = .584, p = .002).
We found no significant correlations between preferred distance to social and non-social stimuli in the computerized task (r = −.049, p = .812), nor in the real-life task (r = .052, p = .784).
fMRI results
Brain regions responding to social stimuli versus non-social stimuli
For the approach/withdrawal event, irrespective of threat level and direction, and after controlling for discomfort, social stimuli elicited greater activation than non-social stimuli in the right FFA, bilateral TPJ, and left MPFC (, (a)). Conversely, non-social stimuli were associated with higher bilateral activation in the middle occipital cortex and fusiform gyrus.
Figure 3. (a). Brain regions showing increased activation for social relative to non-social stimuli (left), and for non-social relative to social stimuli (right), irrespective of threat level and direction of movement. (b). Brain regions showing increased activation for social relative to non-social stimuli (left), and to non-social relative to social stimuli (right), irrespective of threat level and distance. TPJ = temporoparietal junction; FFA = face fusiform area; MPFC = medial prefrontal cortex. Activation threshold set at cluster-forming p< .001 uncorrected, and FDR-corrected p< .05 at the cluster level. Results in the figure are displayed at p< .005 uncorrected for visualization purposes, but only clusters surviving at the predefined threshold are highlighted.
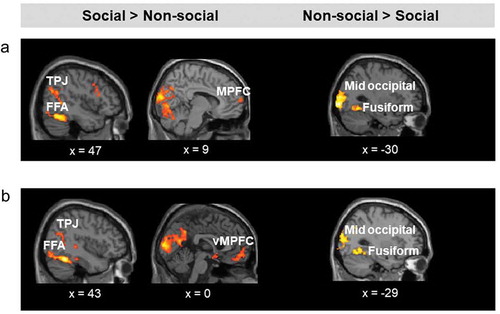
Similarly, during the first static image of each trial, irrespective of threat level and distance, social relative to non-social stimuli was associated with increased activation in the right TPJ, bilateral FFA, and vmPFC, whereas non-social relative to social stimuli was associated with increased activation in the bilateral middle occipital gyrus and fusiform gyrus (, (b)).
Recruitment of defensive regions by approaching versus withdrawing, and near versus far stimuli
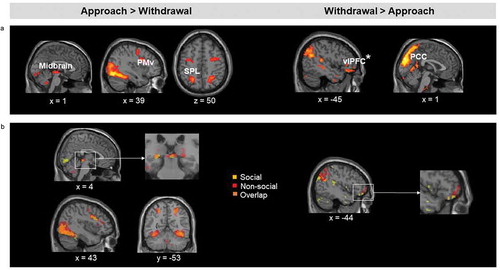
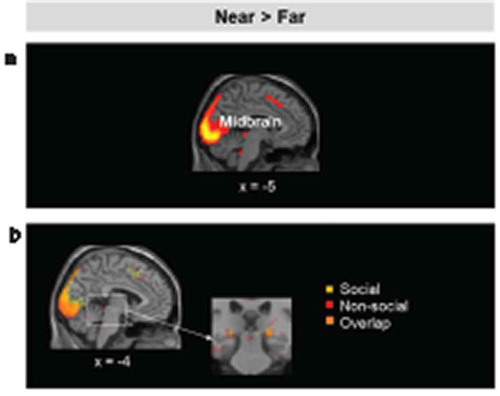
Approaching stimuli (Approach > Withdrawal) elicited increased activation in the right midbrain PAG. However, no significant effects were found in the amygdala or dACC. Other regions showing increased activation for approach compared to withdrawal included the right insula, the right PMv extending to the dorsolateral prefrontal cortex, and bilateral superior parietal lobule (; (a)). Additionally, a conjunction analysis showed overlapping activation for approaching non-social and social threatening stimuli in the midbrain, right PMv and bilateral superior parietal lobule ((b)). Since no threat by direction interaction was found in any of the hypothesized regions, these effects did not vary significantly as a function of the level of threat in our task.
Figure 4. (a). Brain regions showing increased activation for approaching relative to withdrawing stimuli (left), and for withdrawing relative to approaching stimuli (right), irrespective of stimulus category and threat level. (b). Left: Results of the conjunction analysis showing the overlap on the midbrain between (non-social threats approach > withdrawal) and (social threats approach > withdrawal). Right: Results of the conjunction analysis showing the overlap on the vlPFC between (non-social threats withdrawal > approach) and (social threats withdrawal > approach). PMv = ventral premotor cortex; SPL = superior parietal lobule; vlPFC = ventrolateral prefrontal cortex (*significant at p< .005 uncorrected, FDR-corrected p< .05); PCC = posterior cingulate Activation threshold set at cluster-forming p< .001 uncorrected, and FDR-corrected p< .05 at the cluster level. Results in the figure are displayed at p< .005 uncorrected for visualization purposes, but only clusters surviving at the predefined threshold are highlighted.
Similarly, near stimuli (Near > Far) recruited the midbrain PAG (, (a)). Conjunction analyses examining the overlap between social and non-social threats in the Near > Far and Far > Near contrasts revealed no clusters with significant overlap in the hypothesized regions, although both categories recruited voxels in the midbrain (Near > Far) ().
Table 4. Brain regions displaying greater activation for Near > Far, and Far > Near (FDR p < .05; MNI coordinates of the peak voxel are reported).
Figure 5. (a). Brain regions showing increased activation for near relative to far stimuli (left), and for far relative to near stimuli, irrespective of stimulus category and threat level. (b). Left: Results of the conjunction analysis showing the overlap on the midbrain between (non-social threats near > far) and (social threats near > far). Activation threshold set at cluster-forming p< .001 uncorrected, and FDR-corrected p< .05 at the cluster level. Results in the figure are displayed at p< .005 uncorrected for visualization purposes, but only clusters surviving at the predefined threshold are highlighted.
Contrary to our hypothesis, we did not find evidence of increased activation in the vmPFC to withdrawing relative to approaching stimuli, but activation was increased in the posterior cingulate (; (a)). Conjunction analysis revealed an overlap in the posterior cingulate for withdrawing (relative to approaching) non-social and social threatening stimuli ((b)).
Far stimuli (Far > Near) did not engage the vmPFC (, (a)). Conjunction analyses examining the overlap between social and non-social threats in the Far > Near contrast, revealed no clusters with significant overlap in the vmPFC ((b)).
Of note, no significant interactions were found in our hypothesized regions of interest. However, Category by Direction and Category by threat by direction interactions were observed in other regions for which there were no a priori predictions, including the precuneus and visual areas (for details on these results, please see the Supplementary material).
Dissociable functional connectivity patterns in response to personal space intrusions by social versus non-social stimuli
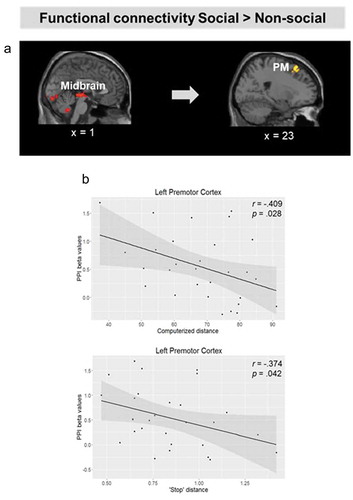
To identify regions with increased functional coupling to the midbrain in response to personal space intrusions by social versus non-social stimuli, we ran a PPI analysis for Approach Social > Approach Non-social using a midbrain PAG seed. For approaching social relative to non-social stimuli, we found increased functional connectivity between the midbrain and bilateral premotor cortex and right dorsolateral prefrontal cortex (; ). Furthermore, correlation analysis showed that individual differences in connectivity strength between the midbrain and the left premotor cortex were associated with preferred distance to social stimuli in the computerized task (PM: r = −.456, p = .013) and in the stop-distance task (PM: r = −.374, p = .042; , ); specifically, increased functional coupling was associated with shorter preferred distances in both tasks. No regions showed significantly greater coupling with the midbrain in response to approaching non-social versus social stimuli.
Table 5. Results of the PPI analysis, showing brain regions with increased functional connectivity with the midbrain PAG in response to approaching social versus non-social stimuli (FDR p < .05; MNI coordinates are reported).
Figure 6. (a). Brain regions showing increased functional connectivity with the midbrain for approaching social relative to non-social stimuli. (b). Scatter plot depicting the correlation between preferred distance to social stimuli in the computerized task, and connectivity strength between the midbrain and the left PMd. Activation threshold set at cluster-forming p< .001 uncorrected, and FDR-corrected p< .05 at the cluster level. Results in the figure are displayed at p< .005 uncorrected for visualization purposes, but only clusters surviving at the predefined threshold are highlighted.
Discussion
The main goal of this study was to examine whether personal space intrusions by conspecifics versus non-social biological stimuli engaged the PPS and defensive systems to the same extent. We found that approaching stimuli from both categories recruited fronto-parietal structures previously linked to personal space (PMv and IPS), as well as defensive regions sensitive to threat proximity (midbrain PAG). However, personal space intrusions by social relative to non-social stimuli were associated with increased functional coupling between the midbrain and the premotor cortex, a key region implicated in personal space regulation. Moreover, functional connectivity strength between the midbrain and the premotor cortex correlated with computerized and real-life interpersonal distance. These findings directly demonstrate the involvement of defensive mechanisms in personal space intrusions and suggest that the interaction between defensive and peripersonal space regions might be critically implicated in the regulation of personal space in social interactions.
PPS and defensive system contributions to personal space regulation
Consistent with prior studies (Holt et al., Citation2014; Vieira et al., Citation2017), the PMv and margins of the IPS showed an approach-bias, responding preferentially to approaching versus withdrawing faces. Our findings showed that this approach-bias extended to non-social biological stimuli. Taken together with reports that such a bias was not observed for objects (Holt et al., Citation2014), our results suggest the mechanisms described here may, in humans, be preferentially recruited by living organisms that are capable of acting upon the individual. This interpretation is in line with an evolutionary account that equates human personal space to the “flight zone” of animals, assigning it a basic protective function against potential attacks by predators (Graziano & Cooke, Citation2006).
Following this view, we hypothesized defensive regions sensitive to threat proximity would also be engaged by personal space intrusions. Our results confirmed this prediction by showing an approach bias in the midbrain PAG. The midbrain PAG has been implicated in both passive (e.g., freezing) and active (e.g., escape) defensive responses in animals (Carrive, Citation1993; Koba, Inoue, & Watanabe, Citation2016), and in fear and anxiety in humans (Hermans, Henckens, Roelofs, & Fernandez, Citation2013; Nashold, Wilson, & Slaughter, Citation1969). Notably, it has been shown to respond to threat proximity or imminence, exhibiting increased BOLD activation to looming and proximal threats (Coker-Appiah et al., Citation2013; Mobbs et al., Citation2009, Citation2007, Citation2010). In our task, approaching social and non-social stimuli were both associated with increased activation in this region. Interestingly, this effect extended to low and high threat stimuli. This suggests the engagement of defensive mechanisms may be a fundamental component of the response to personal space intrusions, as any organism entering our personal space represents a potential threat. In this context, regions sensitive to threat proximity may be recruited to monitor danger cues or coordinate behavioral responses during personal space regulation. An alternative explanation is that perhaps our low threat stimuli were not neutral or innocuous enough, resulting in overlapping neural activation patterns in response to high and low threat levels. This might be particularly applicable to personal space intrusions by neutral faces, given their inherent ambiguity. It should be noted, however, that we found the main effect of threat in the ventrolateral prefrontal cortex at a more lenient threshold (p< .005 uncorrected and FDR-corrected p < .05), a region previously implicated in threat processing (Gold, Morey, & McCarthy, Citation2015; Mujica-Parodi, Cha, & Gao, Citation2017; Tupak et al., Citation2014). Furthermore, ratings collected from an independent sample showed self-reported differences in perceived valence, arousal, and dangerousness of high and low threat stimuli. Future research should incorporate stimuli of more varied threat levels and also stimuli of positive valence (e.g., happy faces) to ascertain if personal space intrusions by innocuous or appetitive stimuli recruit defensive mechanisms to the same extent.
Contrary to our predictions, no approach bias was observed in the amygdala and dACC, nor a withdraw bias in the vmPFC. Previous studies have also failed to find direction-related effects in the vmPFC (Coker-Appiah et al., Citation2013). However, we found the midbrain PAG, bilateral amygdala, dACC and insula were more active for near versus far stimuli at a more lenient statistical threshold (p< .005 uncorrected and FDR-corrected p < .05). At the same threshold, we found increased activity in the vmPFC for far relative to near stimuli. Although these results did not survive the predefined statistical threshold for significance, they are worth mentioning given the remarkable overlap with those reported in prior work (Mobbs et al., Citation2009, Citation2007, Citation2010).
Neural specificities in response to personal space intrusions by social and non-social stimuli
Although personal space intrusions by both social and non-social stimuli recruited overlapping defensive (midbrain PAG) and PPS (IPS and PM) regions, our results pointed to dissociable functional connectivity patterns between stimulus categories. Our results revealed increased functional connectivity between the midbrain PAG and premotor regions in response to social relative to non-social stimuli. Moreover, connectivity strength between the midbrain and the premotor cortex was significantly associated with interpersonal distance in the computerized and Stop-distance tasks. In primates, both ventral and dorsal portions of the premotor cortex are specialized in controlling hand and limb movements, through their outputs to M1 (Cote, Hamadjida, Quessy, & Dancause, Citation2017). In humans, specifically, fMRI research has confirmed these regions respond to multisensory information presented around one’s own (Bremmer et al., Citation2001; Brozzoli, Gentile, Petkova, & Ehrsson, Citation2011; Gentile, Petkova, & Ehrsson, Citation2011; Lloyd, Shore, Spence, & Calvert, Citation2003), and a conspecific’s hand (Brozzoli, Gentile, Bergouignan, & Ehrsson, Citation2013), suggesting a role of these structures in the shared representation of space around oneself and others. On the other hand, the midbrain PAG has been shown to be involved in active defensive behaviors (Assareh, Sarrami, Carrive, & McNally, Citation2016; Bandler, Price, & Keay, Citation2000). Taken together with these findings, our results suggest the midbrain PAG and premotor cortex might work in concert to guide appropriate motor action in social interactions and, particularly, during personal space regulation. Such mechanisms are presumably also necessary to guide action towards other types of stimuli. However, our results suggest they might be strengthened for social information, perhaps due to the higher complexity of motor programs typically initiated towards conspecifics versus the type of organisms used in this study.
In addition to dissociable connectivity patterns, our results demonstrated neural differences between social and non-social stimuli that were independent of direction, distance and threat level. In particular, our data showed social relative to non-social stimuli were associated with augmented activity in the FFA, medial prefrontal cortex and temporoparietal junction. These results are consistent with numerous studies suggesting a role of these structures in face processing, and inference of mental and emotional states (for reviews, see Bernstein & Yovel, Citation2015; Collins & Olson, Citation2014; Molenberghs et al., Citation2016; Spunt & Adolphs, Citation2017), providing further support for the role of these structures in social cognition, and, particularly, in personal space regulation. One potential limitation of these analyses is that social and non-social stimuli were not perfectly matched in terms of arousal, unpleasantness and perceived dangerousness (non-social stimuli were rated by an independent sample of subjects as more arousing, unpleasant and dangerous than social stimuli; full results of this analysis are available in Supplemental material). To control for potential confounds brought on by differences in subjective ratings between stimulus categories, we used discomfort ratings as a covariate in all comparisons between social and non-social categories, including in the connectivity analysis.
Finally, of note, our sample was mostly composed of female participants. Although the investigation of sex differences was out of the scope of the present study, we cannot exclude the possibility that they may impact interpersonal distance preferences, as well as their neural correlates.
Conclusions
This study directly compared the neural correlates of personal space intrusions by social versus non-social stimuli. Our findings are novel in demonstrating a common defensive architecture implicated in the regulation of distance from other organisms (conspecifics or not), including the midbrain PAG, and frontoparietal structures that represent peripersonal space. Although some of our conclusions remain tentative, these findings bring important new insights into the neural substrates of personal space regulation, particularly in the context of social interactions.
Supl_Material_revised.docx
Download MS Word (715.7 KB)Acknowledgments
The authors would like to thank Wildwood Insect Farming & Trading of Waterloo Ontario Canada for their advice and assistance regarding the selection and acquisition of the entomological specimens. We would also like to thank Ian Jones for his assistance with photography.
Disclosure statement
No potential conflict of interest was reported by the authors.
Supplementary material
Supplemental data for this article can be accessed here.
Additional information
Funding
References
- Assareh, N., Sarrami, M., Carrive, P., & McNally, G. P. (2016). The organization of defensive behavior elicited by optogenetic excitation of rat lateral or ventrolateral periaqueductal gray. Behavioral Neuroscience, 130(4), 406–414. Retrieved from https://www.ncbi.nlm.nih.gov/pubmed/27243807
- Bandler, R., Price, J. L., & Keay, K. A. (2000). Brain mediation of active and passive emotional coping. Progress in Brain Research, 122, 333–349. Retrieved from https://www.ncbi.nlm.nih.gov/pubmed/10737069
- Bartolo, A., Coello, Y., Edwards, M. G., Delepoulle, S., Endo, S., & Wing, A. M. (2014). Contribution of the motor system to the perception of reachable space: An fMRI study. The European Journal of Neuroscience, 40(12), 3807–3817. Retrieved from https://www.ncbi.nlm.nih.gov/pubmed/25308823
- Bernstein, M., & Yovel, G. (2015). Two neural pathways of face processing: A critical evaluation of current models. Neuroscience and Biobehavioral Reviews, 55, 536–546. Retrieved from https://www.ncbi.nlm.nih.gov/pubmed/26067903
- Bradley, M. M., & Lang, P. J. (1994). Measuring emotion: The self-assessment manikin and the semantic differential. Journal of Behavior Therapy and Experimental Psychiatry, 25(1), 49–59. Retrieved from https://www.ncbi.nlm.nih.gov/pubmed/7962581
- Bremmer, F., Schlack, A., Shah, N. J., Zafiris, O., Kubischik, M., Hoffmann, K., … Fink, G. R. (2001). Polymodal motion processing in posterior parietal and premotor cortex: A human fMRI study strongly implies equivalencies between humans and monkeys. Neuron, 29(1), 287–296. Retrieved from http://www.ncbi.nlm.nih.gov/pubmed/11182099
- Brozzoli, C., Gentile, G., Bergouignan, L., & Ehrsson, H. H. (2013). A shared representation of the space near oneself and others in the human premotor cortex. Current Biology : CB, 23(18), 1764–1768. Retrieved from http://www.ncbi.nlm.nih.gov/pubmed/24012310
- Brozzoli, C., Gentile, G., Petkova, V. I., & Ehrsson, H. H. (2011). FMRI adaptation reveals a cortical mechanism for the coding of space near the hand. The Journal of Neuroscience : the Official Journal of the Society for Neuroscience, 31(24), 9023–9031. Retrieved from https://www.ncbi.nlm.nih.gov/pubmed/21677185
- Carrive, P. (1993). The periaqueductal gray and defensive behavior: Functional representation and neuronal organization. Behavioural Brain Research, 58(1–2), 27–47. Retrieved from https://www.ncbi.nlm.nih.gov/pubmed/8136048
- Clery, J., Guipponi, O., Wardak, C., & Ben Hamed, S. (2015). Neuronal bases of peripersonal and extrapersonal spaces, their plasticity and their dynamics: Knowns and unknowns. Neuropsychologia, 70, 313–326. Retrieved from https://www.ncbi.nlm.nih.gov/pubmed/25447371
- Coker-Appiah, D. S., White, S. F., Clanton, R., Yang, J., Martin, A., & Blair, R. J. (2013). Looming animate and inanimate threats: The response of the amygdala and periaqueductal gray. Social Neuroscience, 8(6), 621–630. Retrieved from http://www.ncbi.nlm.nih.gov/pubmed/24066700
- Collins, J. A., & Olson, I. R. (2014). Beyond the FFA: The role of the ventral anterior temporal lobes in face processing. Neuropsychologia, 61, 65–79. Retrieved from https://www.ncbi.nlm.nih.gov/pubmed/24937188
- Connolly, A. C., Sha, L., Guntupalli, J. S., Oosterhof, N., Halchenko, Y. O., Nastase, S. A., … Haxby, J. V. (2016). How the human brain represents perceived dangerousness or “predacity” of animals. The Journal of Neuroscience : the Official Journal of the Society for Neuroscience, 36(19), 5373–5384. Retrieved from https://www.ncbi.nlm.nih.gov/pubmed/27170133
- Cote, S. L., Hamadjida, A., Quessy, S., & Dancause, N. (2017). Contrasting modulatory effects from the dorsal and ventral premotor cortex on primary motor cortex outputs. The Journal of Neuroscience : the Official Journal of the Society for Neuroscience, 37(24), 5960–5973. Retrieved from http://www.ncbi.nlm.nih.gov/pubmed/28536271
- Di Pellegrino, G., & Ladavas, E. (2015). Peripersonal space in the brain. Neuropsychologia, 66, 126–133. Retrieved from https://www.ncbi.nlm.nih.gov/pubmed/25448862
- Ferri, F., Costantini, M., Huang, Z., Perrucci, M. G., Ferretti, A., Romani, G. L., & Northoff, G. (2015). Intertrial variability in the premotor cortex accounts for individual differences in peripersonal space. The Journal of Neuroscience : the Official Journal of the Society for Neuroscience, 35(50), 16328–16339. Retrieved from http://www.ncbi.nlm.nih.gov/pubmed/26674860
- Gentile, G., Petkova, V. I., & Ehrsson, H. H. (2011). Integration of visual and tactile signals from the hand in the human brain: An FMRI study. Journal of Neurophysiology, 105(2), 910–922. Retrieved from http://www.ncbi.nlm.nih.gov/pubmed/21148091
- Ghuman, A. S., Brunet, N. M., Li, Y., Konecky, R. O., Pyles, J. A., Walls, S. A., … Richardson, R. M. (2014). Dynamic encoding of face information in the human fusiform gyrus. Nature Communications, 5, p 5672. Retrieved from https://www.ncbi.nlm.nih.gov/pubmed/25482825
- Gold, A. L., Morey, R. A., & McCarthy, G. (2015). Amygdala-prefrontal cortex functional connectivity during threat-induced anxiety and goal distraction. Biological Psychiatry, 77(4), 394–403. Retrieved from https://www.ncbi.nlm.nih.gov/pubmed/24882566
- Graziano, M. S., & Cooke, D. F. (2006). Parieto-frontal interactions, personal space, and defensive behavior. Neuropsychologia, 44(13), 2621–2635. Retrieved from http://www.ncbi.nlm.nih.gov/pubmed/17128446
- Grill-Spector, K., Weiner, K. S., Kay, K., & Gomez, J. (2017). The functional neuroanatomy of human face perception. Annual Review of Vision Science, 3, 167–196. Retrieved from https://www.ncbi.nlm.nih.gov/pubmed/28715955
- Grivaz, P., Blanke, O., & Serino, A. (2017). Common and distinct brain regions processing multisensory bodily signals for peripersonal space and body ownership. Neuroimage, 147, 602–618. Retrieved from https://www.ncbi.nlm.nih.gov/pubmed/28017920
- Hayduk, L. A. (1978). Personal space: An evaluative and orienting overview. Psychological Bulletin, 85(1), 117–134.
- Hayduk, L. A. (1983). Personal space: Where we now stand. Psychological Bulletin, 94(2), 293–335.
- Hermans, E. J., Henckens, M. J., Roelofs, K., & Fernandez, G. (2013). Fear bradycardia and activation of the human periaqueductal grey. Neuroimage, 66, 278–287. Retrieved from https://www.ncbi.nlm.nih.gov/pubmed/23110885
- Holt, D. J., Boeke, E. A., Coombs, G., 3rd, DeCross, S. N., Cassidy, B. S., Stufflebeam, S., … Tootell, R. B. (2015). Abnormalities in personal space and parietal-frontal function in schizophrenia. NeuroImage Clinical, 9, 233–243. Retrieved from http://www.ncbi.nlm.nih.gov/pubmed/26484048
- Holt, D. J., Cassidy, B. S., Yue, X., Rauch, S. L., Boeke, E. A., Nasr, S., … Coombs, G., 3rd. (2014). Neural correlates of personal space intrusion. The Journal of Neuroscience : the Official Journal of the Society for Neuroscience, 34(12), 4123–4134. Retrieved from http://www.ncbi.nlm.nih.gov/pubmed/24647934
- Kennedy, D. P., Glascher, J., Tyszka, J. M., & Adolphs, R. (2009). Personal space regulation by the human amygdala. Nature Neuroscience, 12(10), 1226–1227. Retrieved from http://www.ncbi.nlm.nih.gov/pubmed/19718035 http://www.nature.com/neuro/journal/v12/n10/pdf/nn.2381.pdf
- Koba, S., Inoue, R., & Watanabe, T. (2016). Role played by periaqueductal gray neurons in parasympathetically mediated fear bradycardia in conscious rats. Physiological Reports, 4(12). Retrieved from https://www.ncbi.nlm.nih.gov/pubmed/27335434
- Koster-Hale, J., Richardson, H., Velez, N., Asaba, M., Young, L., & Saxe, R. (2017). Mentalizing regions represent distributed, continuous, and abstract dimensions of others’ beliefs. Neuroimage, 161, 9–18. Retrieved from https://www.ncbi.nlm.nih.gov/pubmed/28807871
- Langner, O., Dotsch, R., Bijlstra, G., Wigboldus, D. H. J., Hawk, S. T., & van Knippenberg, A. (2010). Presentation and validation of the radboud faces database. Cognition & Emotion, 24(8), 1377–1388.
- Lloyd, D. M., Shore, D. I., Spence, C., & Calvert, G. A. (2003). Multisensory representation of limb position in human premotor cortex. Nature Neuroscience, 6(1), 17–18. Retrieved from https://www.ncbi.nlm.nih.gov/pubmed/12483217
- McNaughton, N., & Corr, P. J. (2004). A two-dimensional neuropsychology of defense: Fear/anxiety and defensive distance. Neuroscience and Biobehavioral Reviews, 28(3), 285–305. Retrieved from https://www.ncbi.nlm.nih.gov/pubmed/15225972
- Mobbs, D., Hagan, C. C., Dalgleish, T., Silston, B., & Prevost, C. (2015). The ecology of human fear: Survival optimization and the nervous system. Frontiers in Neuroscience, 9, p 55. Retrieved from https://www.ncbi.nlm.nih.gov/pubmed/25852451
- Mobbs, D., Marchant, J. L., Hassabis, D., Seymour, B., Tan, G., Gray, M., … Frith, C. D. (2009). From threat to fear: The neural organization of defensive fear systems in humans. The Journal of Neuroscience : the Official Journal of the Society for Neuroscience, 29(39), 12236–12243. Retrieved from http://www.ncbi.nlm.nih.gov/pubmed/19793982
- Mobbs, D., Petrovic, P., Marchant, J. L., Hassabis, D., Weiskopf, N., Seymour, B., … Frith, C. D. (2007). When fear is near: Threat imminence elicits prefrontal-periaqueductal gray shifts in humans. Science, 317(5841), 1079–1083. Retrieved from http://www.ncbi.nlm.nih.gov/pubmed/17717184
- Mobbs, D., Yu, R., Rowe, J. B., Eich, H., FeldmanHall, O., & Dalgleish, T. (2010). Neural activity associated with monitoring the oscillating threat value of a tarantula. Proceedings of the National Academy of Sciences of the United States of America, 107(47), 20582–20586. Retrieved from http://www.ncbi.nlm.nih.gov/pubmed/21059963
- Molenberghs, P., Johnson, H., Henry, J. D., & Mattingley, J. B. (2016). Understanding the minds of others: A neuroimaging meta-analysis. Neuroscience and Biobehavioral Reviews, 65, 276–291. Retrieved from https://www.ncbi.nlm.nih.gov/pubmed/27073047
- Morawetz, C., Holz, P., Lange, C., Baudewig, J., Weniger, G., Irle, E., & Dechent, P. (2008). Improved functional mapping of the human amygdala using a standard functional magnetic resonance imaging sequence with simple modifications. Magnetic Resonance Imaging, 26(1), 45–53. Retrieved from http://www.ncbi.nlm.nih.gov/pubmed/17574366
- Mujica-Parodi, L. R., Cha, J., & Gao, J. (2017). From anxious to reckless: A control systems approach unifies prefrontal-limbic regulation across the spectrum of threat detection. Frontiers in Systems Neuroscience, 11, 18. Retrieved from http://www.ncbi.nlm.nih.gov/pubmed/28439230
- Nashold, B. S., Jr., Wilson, W. P., & Slaughter, D. G. (1969). Sensations evoked by stimulation in the midbrain of man. Journal of Neurosurgery, 30(1), 14–24. Retrieved from https://www.ncbi.nlm.nih.gov/pubmed/4885810
- Nichols, T., Brett, M., Andersson, J., Wager, T., & Poline, J. B. (2005). Valid conjunction inference with the minimum statistic. Neuroimage, 25(3), 653–660. Retrieved from <Go to ISI>WOS:000228383500001
- O’Reilly, J. X., Woolrich, M. W., Behrens, T. E., Smith, S. M., & Johansen-Berg, H. (2012). Tools of the trade: Psychophysiological interactions and functional connectivity. Social Cognitive and Affective Neuroscience, 7(5), 604–609. Retrieved from https://www.ncbi.nlm.nih.gov/pubmed/22569188
- Qi, S., Hassabis, D., Sun, J., Guo, F., Daw, N., & Mobbs, D. (2018). How cognitive and reactive fear circuits optimize escape decisions in humans. Proceedings of the National Academy of Sciences of the United States of America, 115(12), 3186–3191. Retrieved from https://www.ncbi.nlm.nih.gov/pubmed/29507207
- Robinson, S., Windischberger, C., Rauscher, A., & Moser, E. (2004). Optimized 3 T EPI of the amygdalae. Neuroimage, 22(1), 203–210. Retrieved from http://www.ncbi.nlm.nih.gov/pubmed/15110010
- Schienle, A., Wabnegger, A., Leitner, M., & Leutgeb, V. (2017). Neuronal correlates of personal space intrusion in violent offenders. Brain Imaging and Behavior, 11(2), 454–460. Retrieved from https://www.ncbi.nlm.nih.gov/pubmed/26935553
- Schienle, A., Wabnegger, A., Schongassner, F., & Leutgeb, V. (2015). Effects of personal space intrusion in affective contexts: An fMRI investigation with women suffering from borderline personality disorder. Social Cognitive and Affective Neuroscience, 10(10), 1424–1428. Retrieved from http://www.ncbi.nlm.nih.gov/pubmed/25809402
- Skudlarski, P., Constable, R. T., & Gore, J. C. (1999). ROC analysis of statistical methods used in functional MRI: Individual subjects. Neuroimage, 9(3), 311–329. Retrieved from https://www.ncbi.nlm.nih.gov/pubmed/10075901
- Spunt, R. P., & Adolphs, R. (2017). The neuroscience of understanding the emotions of others. Neuroscience Letters. Retrieved from https://www.ncbi.nlm.nih.gov/pubmed/28624265
- Thye, M. D., Murdaugh, D. L., & Kana, R. K. (2018). Brain mechanisms underlying reading the mind from eyes, voice, and actions. Neuroscience, 374, 172–186. Retrieved from https://www.ncbi.nlm.nih.gov/pubmed/29406267
- Tupak, S. V., Dresler, T., Guhn, A., Ehlis, A. C., Fallgatter, A. J., Pauli, P., & Herrmann, M. J. (2014). Implicit emotion regulation in the presence of threat: Neural and autonomic correlates. Neuroimage, 85(Pt 1), 372–379. Retrieved from https://www.ncbi.nlm.nih.gov/pubmed/24096027
- Vieira, J. B., & Marsh, A. A. (2014). Don’t stand so close to me: Psychopathy and the regulation of interpersonal distance. Frontiers in Human Neuroscience, 7, 907. Retrieved from http://www.ncbi.nlm.nih.gov/pubmed/24454284
- Vieira, J. B., Tavares, T. P., Marsh, A. A., & Mitchell, D. G. (2017). Emotion and personal space: Neural correlates of approach-avoidance tendencies to different facial expressions as a function of coldhearted psychopathic traits. Human Brain Mapping, 38(3), 1492–1506. Retrieved from https://www.ncbi.nlm.nih.gov/pubmed/27859920.
- Wabnegger, A., Leutgeb, V., & Schienle, A. (2016). Differential amygdala activation during simulated personal space intrusion by men and women. Neuroscience, 330, 12–16. Retrieved from https://www.ncbi.nlm.nih.gov/pubmed/27246442
- Watanabe, M., Bartels, A., Macke, J. H., Murayama, Y., & Logothetis, N. K. (2013). Temporal jitter of the BOLD signal reveals a reliable initial dip and improved spatial resolution. Current Biology : CB, 23(21), 2146–2150. Retrieved fromhttps://www.ncbi.nlm.nih.gov/pubmed/24139737
- Wendt, J., Low, A., Weymar, M., Lotze, M., & Hamm, A. O. (2017). Active avoidance and attentive freezing in the face of approaching threat. Neuroimage, 158, 196–204. Retrieved from https://www.ncbi.nlm.nih.gov/pubmed/28669911