
ABSTRACT
Introduction: Platelet granule deficiencies lead to bleeding disorders, but their specific diagnosis typically requires whole mount transmission electron microscopy, which is often not available and has a number of important limitations. We recently proposed the use of advanced forms of fluorescence microscopy – the so-called ‘super-resolution’ microscopies – as a possible solution.
Areas covered: In this special report, we review the diagnosis of platelet granule deficiencies, and discuss how recent developments in fluorescence microscopy may be useful in improving diagnostic approaches to these and related disorders. In particular, we conclude that super-resolution fluorescence microscopy may have advantages over transmission electron microscopy in this application.
Expert commentary: The value of the super-resolution microscopies has been amply demonstrated in research; however, their potential in diagnostic applications is ripe for further exploration. Hematology is a field particularly likely to benefit because of the relative simplicity of sample preparation. We anticipate that the costs of the necessary instrumentation will continue to fall rapidly, making these technologies widely accessible to clinicians.
1. Introduction
1.1. Platelet structure and function
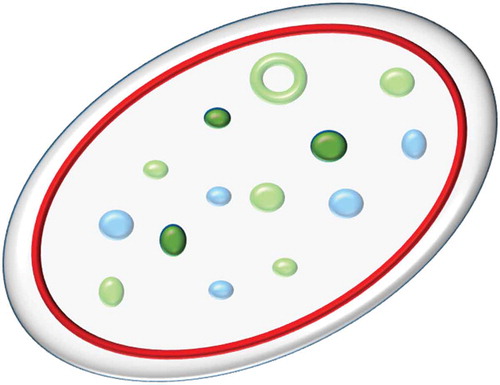
Platelets are circulating cell fragments which are best known for their critical role in hemostasis, although they perform a variety of other functions [Citation1,Citation2]. In humans, platelets are typically 2–5 µm in diameter and have a discoid shape due to the presence of a peripheral ring of microtubules [Citation3]. They are produced by budding from megakaryocytes and are described as cell fragments because they do not contain a nucleus. Instead platelets contain a set of specialized organelles dedicated to their various functions (illustrated schematically in ).
Figure 1. Schematic of platelet structure.
A simplified schematic of the key structural features of the platelet relevant to this article. The platelet membrane, shown in pale grey, encloses internal structures including the tubulin ring (red); α-granules (pale blue); dense granules (dark green) and CD63+ structures (green). Note that all dense granules are CD63+ but that other structures are also CD63+; there is no unique marker for dense granules. Structures not shown for clarity include actin filaments, mitochondria, lysosomes, peroxisomes, T-granules and the canalicular system. Full color available online.
These include a number of types of storage vesicles (also known as granules) whose contents are released into the plasma on platelet activation. They are traditionally divided into dense (or δ-) granules and α-granules [Citation2]. Recent work has suggested that this binary division is overly simplistic, identifying an additional granule type [Citation4] and apparent subdivisions within α-granules [Citation5]. Dense granules get their name for their appearance in whole mount transmission electron micrographs; that is to say that they are electron dense (due to the presence of a high concentration of calcium).
1.2. Platelet granule deficiencies
A variety of platelet disorders – collectively known as storage pool disorders – are known to be associated with deficiencies in platelet granules; α-granule deficiencies in α storage pool disorder (gray platelet syndrome); dense granule deficiencies in δ-storage pool disorder, Chediak–Higashi, and Hermansky–Pudlak syndromes; and deficiencies of both types in αδ-storage pool disorder [Citation2]. The deficiencies in these secretory granules result in a corresponding reduction in the release of their contents during platelet activation, causing an impaired clotting response.
1.3. Diagnosis
In many cases, to correctly diagnose these disorders, transmission electron microscopy (TEM) is required to elucidate the structural defects in the platelets but is often not readily available. Various functional assays are available, but these do not identify the structural deficit underlying a platelet disorder. Apart from the requirement for the instrumentation and associated sample preparation requirements, skilled interpretation of the images obtained is needed, as the dense granules appear on a complex background that would challenge automated image analysis [Citation6,Citation7]. Furthermore, the samples must be imaged on the day of preparation [Citation8].
Vital staining with mepacrine is also possible, but this requires that the platelets be imaged on the same day. Similarly, flow cytometry approaches may be used, but also require immediate analysis, and will not reveal defects of protein localization. To improve the specificity of diagnosis for these patients, it would be useful if an alternative approach could be developed that would be more widely available.
1.4. Limits of resolution
An obvious alternative to TEM would be to use some form of light microscopy. In particular, fluorescence microscopy would allow staining for specific markers that would enable structures of interest within the platelet to be visualized and counted. However, platelets are only 2–5 µm in diameter; dense granules are 150 nm and alpha granules only 200–400 nm [Citation9]. Since the resolution of conventional light microscopy is only ~200–250 nm, platelet granules cannot be visualized with sufficient clarity to permit accurate quantification and diagnosis using such a microscope (see ). A potential solution to this conundrum is the newly developed family of super-resolution microscopies, which are fluorescence microscopes that can achieve spatial resolutions 2–10-fold higher than conventional light microscopy ().
Box 1. What is super-resolution microscopy?
Box 2. Super-resolution microscopy methods
2. Super-resolution imaging of platelets
2.1. Motivation
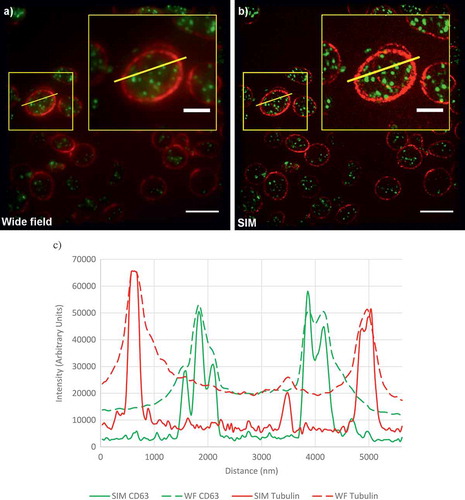
In a recent study, we set out to demonstrate the principle of using super-resolution microscopy to diagnose platelet granule disorders [Citation7]. From the methods listed in , we chose to evaluate the use of SIM because the spatial resolution (~120 nm) is sufficient for our purposes and the method is fast enough to be practical in a diagnostic scenario. Additionally, the sample preparation is relatively straightforward compared to the other approaches. As can be seen from the example images shown in , SIM not only improves the resolution of the images but also the contrast, providing much clearer images that are readily suited to automated analysis.
Figure 2. Comparison of diffraction-limited and super-resolution images of a platelet.
(a) A wide-field image of platelets from a healthy control. Platelets are stained for tubulin (red) and CD63 (green). (b) A SIM reconstruction of the same field of view. Yellow boxes indicate the position of the enlarged inset image. (c) Line profiles of intensity, plotted for the yellow lines shown in (a,b). Note the much higher contrast and detail in the SIM images. All these images are calculated from the same data. Scale bars: main figures 5 µm; insets 2 µm. Full color available online.
One of the challenges we encountered is that there is currently no well-established and unique and specific protein marker for which antibodies are widely available that can be used for dense granules. We therefore chose to use as a marker the integral membrane protein CD63 which has previously been found to be correlated with dense granule deficiency [Citation16]; however, it should be noted that this is not a unique marker for dense granules and is also localized to lysosomes. Therefore, it is important to distinguish between dense granules (defined by electron density in TEM images) and CD63+ structures (defined by fluorescence intensity in SIM images); the former are believed to be a subset of the latter.
Hermansky–Pudlak syndrome (HPS) is a well-studied disease, which in addition to dense granule deficiency is associated with a range of other symptoms including albinism that are believed to be related to deficiencies in the formation of vesicular organelles including melanosomes and lysosomes [Citation17]. The genetics of the disease is also fairly well understood; 10 genes have been identified to date [OMIM #203300 http://omim.org/entry/203300] [Citation18]. It therefore makes an ideal test case for this new diagnostic approach, as an unambiguous diagnosis can be made.
2.2. Technical approach
To evaluate the use of super-resolution microscopy in the diagnosis of this condition, we analyzed samples from seven healthy controls and three patients with different forms of HPS [Citation7]. As a reference point, we first imaged the samples using the current gold standard whole mount TEM approach ()). By TEM, we found that control platelets had an average of 3.5 dense granules, whereas very few platelets from the HPS patients contained any dense granules (average 0.07). (Please refer to the original paper [Citation7] for further details of our methodology.)
Figure 3. Granules in platelets from healthy controls and HPS patients.
(a) Whole mount TEM images showing typical platelets from a control and three HPS patients. Dense granules are indicated with yellow arrowheads. Three are seen in the control platelet, none in the HPS platelets.
(b) SIM images (typical platelets from images shown in ). Yellow arrowheads indicate the most intense CD63+ objects. The control platelet has more, and brighter, CD63+ structures. Note the variable morphology, size and intensity of the structures, which necessitates an automated algorithm to achieve consistent counting of granules. All scale bars are 1 µm.
(a) Adapted from [Citation7] under the Creative Commons Licence. Full color available online.
![Figure 3. Granules in platelets from healthy controls and HPS patients.(a) Whole mount TEM images showing typical platelets from a control and three HPS patients. Dense granules are indicated with yellow arrowheads. Three are seen in the control platelet, none in the HPS platelets.(b) SIM images (typical platelets from images shown in Figure 4). Yellow arrowheads indicate the most intense CD63+ objects. The control platelet has more, and brighter, CD63+ structures. Note the variable morphology, size and intensity of the structures, which necessitates an automated algorithm to achieve consistent counting of granules. All scale bars are 1 µm.(a) Adapted from [Citation7] under the Creative Commons Licence. Full color available online.](/cms/asset/745db47d-0e2f-4f2b-b609-dcf686215c52/ierr_a_1315302_f0003_oc.jpg)
For SIM, the platelets were collected as platelet-rich plasma and attached to a cover slip at a moderate density to facilitate the collection of adequate statistics. The platelets were stained with antibodies to CD63 and tubulin. Visual inspection of the resulting images shows how the tubulin ring acts as a clear marker for the platelet periphery. Multiple CD63-positive organelles are clearly seen within each platelet ()). Differences between the HPS and control samples are readily apparent; in the HPS patients, there are fewer CD63-positive organelles; the staining is fainter; and there appears to be additional CD63 at the platelet periphery ().
Figure 4. Comparison of platelets from healthy controls and HPS patients.
Top left, a healthy control; top right through bottom right, HPS patients. Scale bars all 5 µm. Note the markedly more abundant and brightly stained CD63-positive granules in the platelets of the healthy control.
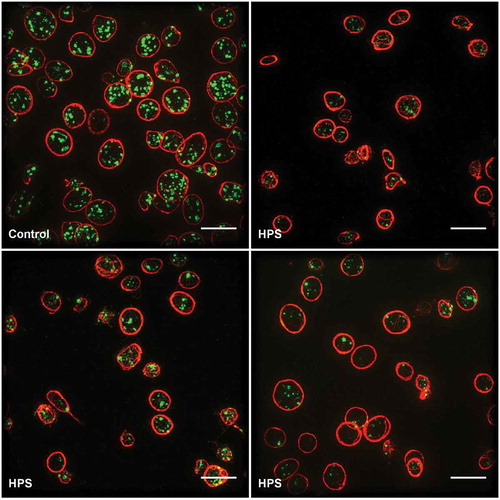
Importantly, these impressions were confirmed by an automated image processing pipeline and statistical analysis, which we used to count the number of organelles and make comparisons between the control and HPS samples. We found that the controls had an average of 6.8 CD63-positive structures per platelet, whilst the HPS patients had only 2.4. While these numbers are higher than seen for the TEM approach, this was expected as CD63 is known not to be confined to dense granules. The use of the automated analysis meant that the control and patient samples could be distinguished with a 99% confidence level. We feel that this shows the power of the super-resolution imaging approach. The ease of differentiating patient from control, plus the potential low cost and possibly centralized facility of this approach, giving a low threshold for usage, could allow for shortening the time to definitive diagnosis for this rare disease. Furthermore, this imaging approach could be extended by the use of additional markers to create a detailed profile of platelet structures that could be used for diagnosis of a wide range of platelet disorders. For example, by adding a marker for α-granules, it would be possible to identify a range of disorders including gray platelet syndrome and αδ-storage pool disorder. However, while the published research has established proof of principle, it is clear that more research is needed to validate its clinical application. In particular, more information is needed on the variation of granule counts within healthy subjects, and on the granule counts typical of a range of granule deficiencies, to establish the wider utility of this approach.
2.3. Other approaches
A recent paper used a different super-resolution technique, STED (see ), to image the distribution of a number of proteins which are all believed to be located in the α-granules [Citation5]. STED has a higher resolution than SIM (as fine as ~20 nm compared to ~120 nm) but is typically somewhat slower to acquire an image [Citation15]. Interestingly, with the higher resolution microscopy, it was shown that these proteins had different distributions, suggesting that these proteins were localized to sub-compartments within the α-granules. This reinforces our view that the detailed structural information obtained by super-resolution microscopy is an important tool for understanding platelet function and potentially for diagnosing a variety of disease-associated states of the platelet. In particular, the markers studied show the potential for investigating aspects of platelet function beyond clotting.
3. Future prospects
We believe that the papers described above show that super-resolution microscopy has some unique advantages as a method for investigating platelet structure and function, and potentially diagnosing structural platelet disorders. Interestingly, another recent paper described the use of super-resolution microscopy in the diagnosis of kidney disorders [Citation19]. As with the diagnosis of platelet granule deficiencies, TEM is normally required to diagnose nephrotic disease, where the structure of the podocyte cells of the glomerulus may be disturbed. However, here the process is even more challenging, requiring a kidney biopsy and embedding and thin sectioning of the sample. Pullman et al. show that SIM is valuable here too, with less extensive sample preparation requirements giving a faster result and also the ability to image at high resolution in 3D. Another recent paper [Citation20] demonstrated the use of SIM in the diagnosis of kidney cancer. Taken together with the work on platelets described above, it seems likely that there is a niche of applications in disease diagnosis and pathology where super-resolution microscopy can replace TEM, potentially reducing costs and increasing the level of detailed information available to clinicians.
Of course it is true that the first commercial super-resolution instruments were rather expensive (in the £1M plus price bracket) – but costs are likely to continue to come down rapidly, and we anticipate the introduction of a new generation of low-cost super-resolution devices. SIM is a technology which seems particularly suited to diagnostic applications because of its relatively high throughput, its ease of use, simple sample preparation, and a lack of technical obstacles to the production of relatively inexpensive instruments. Another advantage of SIM, at least for its application to platelets, is that samples can be fixed and imaged days or weeks after preparation so that not every hospital or clinic would require its own instrument.
Other advantages of SIM over TEM include the facility with which multiple markers can be imaged in parallel, the ability to image structures in 3D at high resolution without sectioning, and the ease of automating the analysis of immunofluorescent images.
For platelet disease in particular, it is likely that genetic testing will be increasingly used in diagnosis of hereditary platelet disorders. However, as new loci are still being discovered [Citation18] and the effects of mutations vary between individuals, determining phenotype as well as genotype will continue to be important for the foreseeable future.
4. Expert commentary
While super-resolution microscopy has rapidly achieved awareness and increasing adoption in the cell biology and neurobiology research communities, and in related fields, there is as yet little awareness of these methodologies and their potential applications among clinicians. We feel that their potential is clear, but much more work needs to be undertaken to demonstrate their utility in the clinic. In particular, those niche areas where a subcellular structural detail is invaluable for phenotyping and potentially for diagnosis and/or stratification should be more fully explored. Different super-resolution techniques will be applicable in different scenarios. Here, we adopted SIM because although it does not give the highest spatial resolution, it is adequate to quantify platelet granules and rapidly acquired high-contrast fluorescence images. Blood cells are a particularly attractive target for super-resolution imaging because they are relatively easily obtained and sample preparation is more straightforward than other tissue types.
5. Five-year view
Although super-resolution microscopes are currently expensive, we anticipate that lower cost systems will soon become widely available. This will enable applications beyond pure research, including their use in the diagnosis of some types of disease. The rich information that super-resolution methods can provide on disease phenotypes at a subcellular level will complement the increasing availability of genomic data for patients.
Key issues
There are about 3,600 patients registered in the UK with an inheritable platelet dysfunction, representing about 14% of all registered patients with a bleeding disorder. The rarity of these disorders leads to slow initial diagnosis.
Structural platelet disorders often involve deficiencies in certain types of granule (organelle) within the platelet.
Because platelets are typically 2 µm to 5 µm in diameter, and the dense granules are approximately 150 nm, conventional light microscopy may not accurately measure the number of organelles within a platelet. Therefore transmission electron microscopy has been required to be able to image them.
Structured Illumination Microscopy can resolve these structures. Although its resolution is lower than TEM, it is sufficient to accurately count granules and has the potential to be extended to observe multiple markers simultaneously, and therefore enabling the diagnosis of multiple types of granule deficiency.
The high contrast, and the presence within the platelet of the distinctive ring of microtubules, facilitates the automation of the counting process, giving very statistically robust discrimination between patients and controls. This would be much more challenging with TEM images.
The automated counting enables the granule counts to be obtained rapidly from many platelets per patient. This gives robust statistics which can give high confidence in diagnosing platelet disorders.
The images contain rich information on platelet structure, beyond just the granule counts, which may be helpful in understanding platelet function and disease.
Hermansky Pudlak Syndrome provides a good demonstration of the strengths of this approach, but this work needs to be extended to other platelet disorders – in particular those that are harder to diagnose and discriminate. To be truly comprehensive, this will acquire the use of additional markers and multi-colour imaging.
SIM may be useful in the diagnosis of other disorders, and might represent a new platform for diagnosis in a certain subset of disorders. In particular, it also shows promise in the diagnosis of kidney disorders.
With instrumentation costs likely to reduce, and the breadth and flexibility of application, this technology has the potential to become widely adopted in the next 5–10 years.
Declaration of interest
A Knight was supported by the BEIS (NMS/BIO16). D Cutler was supported by the MRC (MC-UU-12018/2). The authors have no other relevant affiliations or financial involvement with any organization or entity with a financial interest in or financial conflict with the subject matter or materials discussed in the manuscript apart from those disclosed.
Additional information
Funding
References
- Coller BS. Historical perspective and future directions in platelet research. J Thromb Haemost. 2011;9(1 S):374–395.
- Simon D, Kunicki T, Nugent D. Platelet function defects. Haemophilia [Internet]. 2008;14(6):1240–1249. Available from: http://www.ncbi.nlm.nih.gov/pubmed/19141164
- Schwer HD, Lecine P, Tiwari S, et al. A lineage-restricted and divergent β-tubulin isoform is essential for the biogenesis, structure and function of blood platelets. Curr Biol [Internet]. 2001;11(8):579–586. Available from: http://www.ncbi.nlm.nih.gov/pubmed/11369202
- Thon JN, Peters CG, Machlus KR, et al. T granules in human platelets function in TLR9 organization and signaling. J Cell Biol. 2012;198(4):561–574.
- Rönnlund D, Yang Y, Blom H, et al. Fluorescence nanoscopy of platelets resolves platelet-state specific storage, release and uptake of proteins, opening up future diagnostic applications. Adv Healthc Mater [Internet]. 2012;1(6):707–713. Available from: http://www.ncbi.nlm.nih.gov/pubmed/23184821
- Hayward CPM, Moffat KA, Spitzer E, et al. Results of an external proficiency testing exercise on platelet dense-granule deficiency testing by whole mount electron microscopy. Am J Clin Pathol [Internet]. 2009;131(5):671–675. Available from: http://www.ncbi.nlm.nih.gov/pubmed/19369626
- Westmoreland D, Shaw M, Grimes W, et al. Super-resolution microscopy as a potential approach to diagnosis of platelet granule disorders. J Thromb Haemost. 2016;14(4):839–849.
- White JG. Use of the electron microscope for diagnosis of platelet disorders. Semin Thromb Hemost [Internet]. 1998;24(2):163–168. Available from: http://europepmc.org/abstract/med/9579638
- Rumbaut RE, Thiagarajan P. Platelet-vessel wall interactions in hemostasis and thrombosis. Colloq Ser Integr Syst Physiol From Mol Funct [Internet]. 2010;2(1):1–75. Available from: http://www.morganclaypool.com/doi/abs/10.4199/C00007ED1V01Y201002ISP004
- Abbe E. Beiträge zur Theorie des Mikroskops und der mikroskopischen Wahrnehmung. Arch für Mikroskopische Anat [Internet]. 1873;9(1):413–418. Available from: http://link.springer.com/10.1007/BF02956173
- Hell SW. Microscopy and its focal switch. Nat Methods [Internet]. 2009;6(1):24–32. Available from: http://scholar.google.com/scholar?hl=en&btnG=Search&q=intitle:Microscopy+and+its+focal+switch#0
- Hell SW, Sahl SJ, Bates M, et al. The 2015 super-resolution microscopy roadmap. J Phys D Appl Phys [Internet]. 2015;48(44):443001. Available from: http://stacks.iop.org/0022-3727/48/i=44/a=443001?key=crossref.64b10c5e92be3dbad6191dbfa3f07386
- Ehrenberg M. Super-resolved fluorescence microscopy. R Swed Acad Sci. 2014;50005. Available from: http://www.nobelprize.org/nobel_prizes/chemistry/laureates/2014/advanced-chemistryprize2014.pdf
- Van Noorden R. Insider view of cells scoops Nobel. 2014;514(7522):286.
- Schermelleh L, Heintzmann R, Leonhardt H. A guide to super-resolution fluorescence microscopy. J Cell Biol [Internet]. 2010;190(2):165–175. Available from: http://www.jcb.org/cgi/doi/10.1083/jcb.201002018
- Nishibori M, Cham B, McNicol A, et al. The protein CD63 is in platelet dense granules, is deficient in a patient with hermansky-pudlak syndrome, and appears identical to granulophysin. J Clin Invest. 1993;91(4):1775–1782.
- Huizing M, Anikster Y, Gahl WA. Hermansky-Pudlak syndrome and related disorders of organelle formation. Traffic. 2000;1(11):823–835.
- Ammann S, Schulz A, Krägeloh-Mann I, et al. Mutations in AP3D1 associated with immunodeficiency and seizures define a new type of Hermansky-Pudlak syndrome. Blood [Internet]. 2016;127(8):997–1006. Available from: http://www.ncbi.nlm.nih.gov/pubmed/26744459
- Pullman JM, Nylk J, Campbell EC, et al. Visualization of podocyte substructure with structured illumination microscopy (SIM): a new approach to nephrotic disease. Biomed Opt Exp [Internet]. 2016;7(2):302. Available from: http://www.osapublishing.org/viewmedia.cfm?uri=boe-7-2-302&seq=0&html=true
- Liu J, Wang M, Tulman D, et al. Non-destructive diagnosis of kidney cancer on 18-gauge core needle renal biopsy using dual-color fluorescence structured illumination microscopy. Urology [Internet]. 2016;98:195–199. Available from: http://www.ncbi.nlm.nih.gov/pubmed/27597632