
ABSTRACT
Background
In patients with relapsed/refractory multiple myeloma (RRMM) previously receiving 1–3 therapy lines, newer agents demonstrated improved outcomes versus older agents. Real-world treatment pattern data are limited. We assessed real-world treatment patterns and outcomes in patients with RRMM (≥2 prior therapy lines).
Research design and methods
An electronic medical record (EMR) analysis and chart review were conducted using International Oncology Network (ION) EMR data. Patients ≥18 years old initiating first-line MM treatment 1 January 2011, to 31 May 2017, were stratified into older/newer treatment cohorts (approval date before vs during/after 2012). Treatment patterns and outcomes were described; no statistical tests were performed.
Results
In the EMR analysis (n = 1601) and chart review (n = 456), bortezomib, lenalidomide, and bortezomib-lenalidomide combinations dominated first-line treatment. Median real-world progression-free survival (rwPFS) was 12.0 to 3.5 months (first- to fifth-line), and median real-world overall survival (rwOS) was 48.2 to 5.8 months. A trend for increased rwPFS/rwOS with newer versus older treatments was observed. Most common AEs were fatigue, bone pain, and anemia.
Expert opinion
Real-world data describing treatment patterns in relapsed/refractory multiple myeloma are limited. Evaluation of new treatments on patient outcomes will influence treatment patterns and patient outcomes in the real-world setting.
Conclusions
Although a trend for improved rwPFS and rwOS with newer versus older treatments was suggested, additional treatment options to improve patient outcomes are needed.
1. Introduction
Multiple myeloma (MM) is a hematologic malignancy characterized by an excess of monoclonal bone marrow plasma cells [Citation1]. In the United States (US) in 2018, an estimated 30,700 new cases of MM were diagnosed (1.8% of all new cancer cases) and 12,770 individuals will die because of the disease (approximately 2.1% of all cancer deaths) [Citation2]. National Comprehensive Cancer Network (NCCN) treatment guidelines recommend bortezomib, lenalidomide, and dexamethasone as the preferred treatment regimen for first-line therapy of MM [Citation3]. Most patients will relapse after first-line treatment and require further treatment [Citation4], with only 50.7% of US patients expected to survive for 5 years from diagnosis [Citation2].
Since 2012, the treatment landscape in relapsed/refractory MM (RRMM) has changed significantly, with the advent of several agents with novel mechanisms of action alongside the approval of new-generation immunomodulatory drugs [Citation5–10]. In patients with RRMM who have had 1–3 previous lines of therapy, improved outcomes have been demonstrated with the use of newer agents compared with older ones [Citation11–16]. Given these advances, guideline recommendations following first-line therapy are varied, with treatment options including combinations of novel agents with existing standard-of-care regimens, and triplet and quadruplet regimens, creating a complex treatment landscape [Citation3].
Limited data exist to describe the real-world utilization, treatment patterns, and outcomes of the therapy options available in RRMM. The adoption of electronic medical records (EMRs), among other technologies, has provided a large body of information that enables researchers to better understand how therapies are utilized clinically. This is particularly important in oncology given the need to evaluate the impact new treatments have in broader patient populations. This study evaluated EMRs and charts from US community oncology practices, using programmatic extraction of data from standardized fields and a manual analysis of unstructured data, to assess recent treatment patterns and real-world outcomes of patients with RRMM who had received ≥2 lines of therapy.
1.1. Patients and methods
1.1.1. Study design
This was a retrospective, longitudinal, two-phase study using data from the International Oncology Network (ION) practices and the ION EMR data warehouse, a comprehensive store of data from over 650,000 patients from 350 providers within 25 geographically diverse community medical practices in the US [Citation17]. Approximately half of the private-practice oncologists in the US are members of the ION network [Citation17].
1.1.2. Objectives
Phase 1 evaluated patients with RRMM using structured EMR variables only. The objectives were: to describe the sequence of treatments or treatment regimens, including the most common sequences and the duration of each sequence; to evaluate time between treatments and the proportion of patients who received bortezomib or lenalidomide and were re-treated with these agents.
Phase 2 evaluated a subpopulation of patients from Phase 1, using data captured via review of patient charts. The objectives were: to describe the lines of therapy, including the most common lines of therapy and the duration of each line; to evaluate time to next treatment, reasons for treatment discontinuation, and the proportion of patients who received bortezomib or lenalidomide and were re-treated with these agents. Adverse events (AEs) were also assessed. Treatment outcomes were measured by median real-world progression-free survival (rwPFS) and median real-world overall survival (rwOS) across lines of therapy and stratified by older versus newer treatments based on Food and Drug Administration approval dates (before 2012 vs during/after 2012).
As daratumumab is the most recently approved mono-clonal antibody with clinical activity in MM, the proportion of patients receiving daratumumab monotherapy or combination therapy by sequence was assessed in both study parts.
1.1.3. Patient selection criteria
In the EMR analysis (Phase 1), patients were selected through programmatic queries of standardized elements contained within structured fields available through the ION EMR management software. Data were extracted from medical records for patients who were diagnosed with MM (based on International Classification of Disease-9 codes), and who initiated first-line treatment between 1 January 2011, and 31 May 2017, had received ≥2 different treatment regimens, were ≥18 years of age at initiation of first-line treatment, had no evidence of other primary malignancy during the study period, and had ≥90 days of follow-up after initiation of first-line treatment. No distinction was made between patients receiving treatment as part of a clinical trial or as standard of care.
In the chart review (Phase 2), 1005 patients from the EMR analysis were screened and selected through a combination of programmatic queries of standardized fields and comprehensive electronic chart reviews by clinical personnel, including physicians and oncology nurses. Selection of patients was based on the distribution of demographic characteristics, clinical characteristics, and sequence of treatments received among patients included in Phase I to ensure that the chart review (Phase 2) population was representative of the entire population. Patients were excluded if they did not have active MM, were diagnosed or treated for MM outside the ION network, had a diagnosis of any other malignancy, did not start second-line therapy for MM, or were missing physician notes.
1.1.4. Data analysis
Patient data were examined from the date of initiation of first-line therapy for MM until death, loss to follow-up, or study end date, whichever came first. This study provided a descriptive view of treatment patterns and outcomes in patients with RRMM; thus, no statistical tests were performed.
Length of therapy was defined as the interval between the start of a line of therapy and the last date of administration of that same line; time to next treatment was defined as the start of one line of therapy until death or the subsequent line of therapy, whichever occurred first. Patients lost to follow-up or who did not receive a subsequent line of therapy were censored.
In the EMR analysis, treatment sequencing described the order in which treatment regimens were received. However, as reasons for switching (i.e. disease progression or drug toxicity) were not known, the line of therapy could not be accurately assigned.
In the chart review, treatments were described by line of therapy, whereby a new line was defined as a change in regimen due to progression and not due to toxicity or other reasons. Thus, a patient may have received several different regimens during a single line should they have switched due to drug toxicity.
Real-world PFS for each line of therapy was defined as the length of time from the date of treatment initiation to the date of disease progression recorded in the patient’s chart. Disease progression was defined as documented disease progression (i.e. increasing disease severity, new disease site), initiation of hospice care, or death. Patients without a recorded date of progression during their last therapy line were censored for rwPFS at their last visit date or the end of the study period, whichever came first. Real-world OS for each therapy line was defined as time from the date of treatment initiation to the date of death recorded in the patient’s chart. Patients without a recorded death date were censored for rwOS at their last visit date or the end of the study period, whichever came first. Progression-free survival, OS, and time to next treatment were estimated using the Kaplan–Meier method.
For analysis of AEs, charts were searched for specific mention of anemia, bone pain, fatigue, infusion-related reactions/hypersensitivity, leukopenia, neutropenia, peripheral edema, peripheral neuropathy, pneumonia, or thrombocytopenia. If the AE was not noted, it was assumed that the AE was not experienced.
1.1.5. Ethics
An exemption from Institutional Review Board approval was granted for this study.
2. Results
2.1. Clinical and demographic characteristics
Overall, 7261 patients with a diagnosis of MM were identified in the ION EMR database between 1 January 2011, and 31 May 2017. More than half of patients were excluded due to initiating first-line treatment for MM outside of the study period. Overall, 1601 patients met the criteria for inclusion in the EMR analysis.
The first 1005 charts were reviewed, of which 456 met the criteria for inclusion. The most common reasons for exclusion were diagnosis/treatment outside of the ION network (n = 113) and not initiating second-line treatment (n = 390). Baseline clinical and demographic characteristics are shown in .
Table 1. Clinical and demographic characteristics
2.2. EMR analysis
2.2.1. Treatment sequencing
In total, 696/1601 (43.5%) patients received three treatments in the study period, 294/1601 (18.4%) received four, 125/1601 (7.8%) received five, and 46/1,601 (2.9%) received six treatments. Line of therapy could not be defined based on EMR only; therefore, the term ‘treatment sequence’ is used here to describe treatment patterns. Proteasome inhibitor-based regimens were the most commonly received for the first through fifth treatments in any sequence. Immunomodulatory ± proteasome inhibitor-based regimens were used either as first or second treatment in different sequences and were the second-most and third-most commonly received regimens, respectively, in the third through fifth treatments in any sequence. Daratumumab use became more frequent in later sequences, with 2/1601 (0.1%) of patients receiving daratumumab in their first and 9/46 (19.6%) receiving daratumumab in their sixth sequence. The majority (77.4–100.0%) of patients treated with daratumumab received daratumumab as monotherapy, regardless of sequence; however, combination therapy did increase in later sequences, most often in combination with pomalidomide.
2.2.2. Length of therapy and time to next treatment
The median (minimum, maximum) length of therapy was 3.0 (0.0, 59.3) months during the first treatment sequence and 3.3 (0.0, 61.7), 2.7 (0.0, 39.0), 2.4 (0.0, 41.6), 1.6 (0.0, 21.3), and 1.6 (0.0, 14.7) months during the second, third, fourth, fifth, and sixth sequences, respectively. In general, patients receiving bortezomib + lenalidomide ± other components had the longest median therapy duration during the first three treatment sequences, while patients receiving pomalidomide ± other components had the longest therapy duration during the fourth sequence.
The median time to next treatment was 5.7 months from sequence one to two. Thereafter, this value reduced with each sequence: 9.2 months from sequence two to three, 6.9 from sequence three to four, 5.7 months from sequence four to five, and 3.7 months from sequence five to six.
2.2.3. Re-treatment
For first-line treatment, 54% received bortezomib, 19.6% received lenalidomide and 18.6% received bortezomib in combination with lenalidomide as part of their initial treatment regimen. A significant proportion of the patients receiving bortezomib or lenalidomide as initial treatment were re-treated with a regimen containing one of the same agents: 66.2% of patients receiving bortezomib in their initial treatment regimen were re-treated with bortezomib; 53.4% of patients receiving lenalidomide in their initial treatment regimen were re-treated with lenalidomide; of the patients who received combined lenalidomide and bortezomib in their initial treatment regimen, 58.7% were re-treated with bortezomib ± lenalidomide and 54.0% were re-treated with lenalidomide ± bortezomib.
2.3. Chart review
2.3.1. Treatment patterns
Patient characteristics of the chart review population are provided in . During the study period, 183/456 (40.1%) patients received three lines, 75/456 (16.4%) four lines, 29/456 (6.4%) five lines, and 13/456 (2.9%) six lines of therapy. Consistent with findings in the EMR analysis, bortezomib and lenalidomide were the most commonly received agents during first-line treatment, 357/456 (78.3%) and 278/456 (61.0%) patients, respectively; the number of patients receiving these agents decreased in subsequent lines as greater use of newer treatments was noted in third, fourth, and fifth lines (). It should also be noted that few patients in clinical practice received chemotherapy in this study. Instead, use of immunomodulatory imide drugs (IMiDs) and proteasome inhibitors was much more commonly observed. Ongoing analyses (data on file) demonstrate similar trends relating to chemotherapy use.
Table 2. Percentage of patients receiving each agent (indicated as anti-MM treatment) by line of therapya (chart review)
Thirty-seven patients used daratumumab during the study period: 8 in second-line treatment, 12 in third-line, 10 in fourth-line, 5 in fifth-line, and 2 in sixth-line. The majority (28/37; 75.7%) used daratumumab as monotherapy, but 3/37 (8.1%) patients used a daratumumab-lenalidomide combination and 8/37 (21.6%) used a daratumumab-pomalidomide combination.
2.3.2. Length of therapy and time to next treatment
The median (minimum, maximum) length of therapy was 7.5 (0.1, 56.7) months during first-line therapy and decreased thereafter, with medians of 4.7 (0.0, 64.7), 3.5 (0.0, 36.8), 2.3 (0.0, 19.6), 2.2 (0.2, 10.9), and 2.3 (0.2, 9.5) months in second-, third-, fourth-, fifth-, and sixth-lines of treatment. The median time to next treatment ranged from a maximum of 14.3 months (from first- to second-line treatments) to a minimum of 3.9 months (from fourth- to fifth-line treatments). The median time from second- to third-line, third- to fourth-line, and fifth- to sixth-line treatments was 10.0 months, 6.9 months, and 4.1 months, respectively.
2.3.3. Re-treatment
As in the EMR analysis, a significant proportion of patients who received bortezomib or lenalidomide treatment during their first line were re-treated with the same drug in subsequent lines: 90/162 (55.6%) patients who received bortezomib therapy in their first line were re-treated with bortezomib, 39/83 (47.0%) patients who received first-line lenalidomide therapy were re-treated with lenalidomide. For patients who received combined lenalidomide and bortezomib in their first line, 100/195 (51.3%) were re-treated with bortezomib ± lenalidomide and 90/195 (46.2%) were re-treated with lenalidomide ± bortezomib.
2.3.4. Adverse events
The most commonly reported AEs across all lines of therapy were fatigue (71.6–78.3%), bone pain (38.5–69.1%), and anemia (53.8–69.3%). Rates of bone pain (first-line: 69.1%; sixth-line: 38.5%), anemia (first-line: 30.3%; sixth-line: 15.4%), and neuropathy (first-line: 48.5%; sixth-line: 38.5%) decreased by therapy line, while rates of other AEs, including fatigue, were generally constant across therapy lines. The most common reasons for treatment discontinuation were disease progression or drug toxicity.
2.3.5. Treatment outcomes
illustrates rwPFS and rwOS for the overall population and for newer and older treatment subpopulations. Median rwPFS (95% confidence interval [CI]) declined from 12.0 months (10.9, 13.4) at first-line to 2.9 months (2.3, 4.0) at fourth-line. Median rwOS (95% CI) declined from 48.2 months (39.7, 57.2) to 7.8 months (5.1, 12.4) from first- to fourth-line. For those who went on to receive third-line therapy (n = 183), median rwPFS and rwOS in second-line was 5.2 and 25.0 months, respectively; in those who did not go on to receive third-line therapy (n = 273), median rwPFS and rwOS in second-line was 15.3 months and 25.1 months.
Figure 1. Real-world progression-free survival (rwPFS) and real-world overall survival (rwOS) by line of therapy (chart review). a: all treatments; b: rwPFS newer (left) versus older (right) treatments; c: rwOS newer (left) versus older (right) treatments
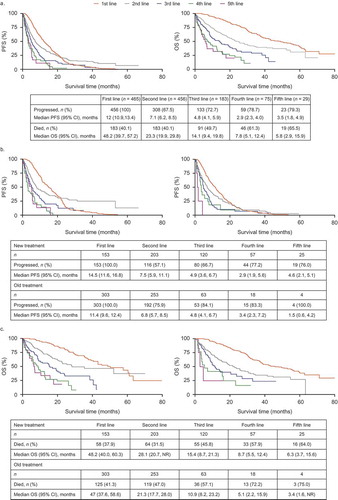
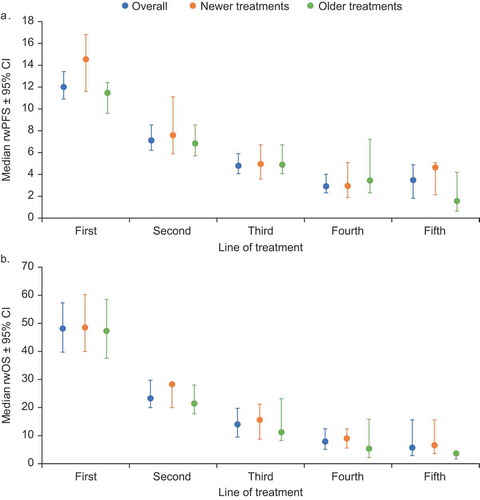
Results for treatment outcomes were stratified into sub-populations of patients receiving newer and older treatments. Newer treatments were pomalidomide, carfilzomib, elotuzumab, panobinostat, daratumumab, ixazomib, and bortezomib-lenalidomide combination. In first and second lines, median rwPFS was numerically higher with newer agents versus older agents; however, 95% CIs overlapped: first-line, 14.5 (11.6, 16.8) versus 11.4 (9.6, 12.4) months; second-line, 7.5 (5.9, 11.1) versus 6.8 (5.7, 8.5) months. However, in later lines there was no clear trend in median rwPFS (95% CI) for newer versus older agents: third-line, 4.9 (3.6, 6.7) versus 4.8 (4.1, 6.7) months; fourth-line, 2.9 (1.9, 5.6) versus 3.4 (2.3, 7.2) months; fifth-line, 4.6 (2.1, 5.1) versus 1.5 (0.6, 4.2) months (). For rwOS, newer treatments generally provided numerically higher outcomes compared with older treatments across all lines; however, 95% CIs overlapped: first-line, 48.2 (40.0, 60.3) versus 47.0 (37.6, 58.6) months; second-line, 28.1 (20.7, not evaluable) versus 21.3 (17.7, 28.0); third-line, 15.4 (8.7, 21.3) versus 10.9 (8.2, 23.2) months; fourth-line, 8.7 (5.5, 12.4) versus 5.1 (2.2, 15.9) months; fifth-line, 6.3 (3.7, 15.6) versus 3.4 (1.6, not reached) months (). Sample size in sixth-line therapy was insufficient to provide reliable rwPFS and rwOS data. In patients receiving carfilzomib, pomalidomide, or daratumumab in third-line therapy, median rwPFS and rwOS (95% CI) was 11.4 (9.6, 12.4) and 15.4 (8.7, 21.3) months, respectively.
Figure 2. Median real-world progression-free (a) and overall (b) survival by line of therapy overall and by newer and older treatments (this figure was originally presented at the American Society of Hematology 60th Annual Meeting, 2018, and published in Blood. Willson J, Bruno A, Opalinska J et al. Current Real-World Treatment Patterns and Outcomes in Patients with Relapsed/Refractory Multiple Myeloma. Blood. 2018;132:3290.© the American Society of Hematology)
3. Discussion
In this retrospective, longitudinal database study, 40% of patients with RRMM received therapy beyond two lines, demonstrating an unmet need in this patient group. Bortezomib and lenalidomide remain the backbone of treatment during first- and second-line therapy. During later lines, there was no single treatment or regimen dominating the landscape. This is consistent with NCCN guidelines [Citation3], but highlights a lack of defined treatment pathways as the disease recurs. The use of novel agents, including carfilzomib, pomalidomide, and daratumumab, has rapidly increased since their introduction. The rate at which these agents are used increases with treatment line from third-line and beyond, which may be a reflection of their initial approved indication. The use of bortezomib and lenalidomide was extensive in earlier lines, decreasing in later lines as patients began to experience disease progression, and possibly develop resistance [Citation19,Citation20]. In this study, therapy duration and time to next treatment generally decreased in later treatment lines, suggesting that clinical benefit decreases over time. Our findings indicate that there may be a lack of therapeutic choices that increase survival and decrease progression following the initial established therapies. Improved outcomes in RRMM have been demonstrated with the use of newer agents compared with older ones [Citation11–16]; however, these must be incorporated into clinical practice so that their benefits are available to a broader range of patients.
Similar to a previous study conducted with these data before the recent therapy approvals [Citation21], substantial variation in rwPFS and rwOS was observed by line of therapy, with treatments beyond second-line offering shorter benefit. Real-world PFS and rwOS were shorter for those who did not go onto later lines. Newer agents provided a median rwPFS of 2.9–4.9 months and median rwOS of 6.3–15.4 months from third-line onwards. While these values are similar to other real-world studies in similar populations [Citation22], overall they are lower than clinical outcomes observed in recent clinical trials for these agents in third and later lines: median PFS 3.7–8.8 months [Citation12,Citation23,Citation24], median OS 12.7–17.5 months [Citation13,Citation23,Citation24]. However, in patients receiving carfilzomib, pomalidomide, or daratumumab in third-line therapy, median rwPFS was 11.4 months and rwOS was 15.4 months. Real-world PFS in fourth-line treatment was lower than PFS observed in clinical trials for newer agents [Citation12,Citation23,Citation24].
A comparison of clinical trials and the real-world data presented here is challenging, as clinical trials occur in a more controlled environment. As per guidance from the US Food and Drug Administration (FDA), rwPFS and rwOS are typically defined in this way to distinguish them from outcomes assessed in clinical trials [Citation25]. However, both the descriptions and definitions of these outcomes can vary between clinical and community settings. For example, selinexor, which was approved in 2019, was criticized by the FDA regarding how the initial point (index date) of a patient’s survival interval across treatment arms directly impacted differences in OS estimates [Citation26]. The FDA argued that, as OS was defined as the time from the index date until death by any cause, the definition of the index date had a direct effect on OS. Therefore, index date determination across treatment arms and the way OS is defined may be sources of bias in real-world studies. Comparatively, in clinical trials, randomization eliminates selection bias and any confounding differences associated with the index date. In addition, in our study, both rwPFS and rwOS were defined by the physician and, therefore, differences between physicians’ definitions may have occurred. Furthermore, as is typical in real-world studies, clinical assessments determining progression were not as frequent as in clinical trials. Therefore, the possibility remains that rwPFS and rwOS may be overestimated compared with PFS and OS reported in clinical trials.
Additionally, clinical trials involving newly approved agents conducted after the data cutoff in the current study would not be included in these analyses. However, only one new agent has been approved since 2017, which is not captured by this study. Selinexor was granted FDA approval in 2019 for the treatment of RRMM [Citation26]. Despite this, our study captures key therapies in the RRMM treatment landscape, including ‘older’ therapies such as lenalidomide and bortezomib, which have been considered backbone therapies in RRMM for many years now, and ‘newer’ treatments such as carfilzomib, a second-generation proteasome inhibitor; pomalidomide, a second-generation IMiD; and novel antibodies elotuzumab and daratumumab. Nonetheless, the results of our analysis indicate that the number of patients who experience disease relapse in the real world is likely greater than shown in clinical trials, confirming the need for additional treatment options. Furthermore, since 2012, the treatment landscape in RRMM has changed significantly, with approval of several new agents and new-generation immunomodulatory drugs. Although published studies detailing treatment patterns and outcomes of the therapy options available in RRMM exist, these studies were performed in a clinical setting. Our study identified a lack of published community-setting studies and, therefore, provides a novel assessment of rwOS and rwPFS with newer versus older treatments.
Results from this analysis also suggest that newer treatments may result in a greater rwPFS and rwOS benefit compared with older treatments, particularly in earlier lines; however, this finding is based on preliminary data trends with small numbers of patients in later lines. A study with larger patient numbers is warranted to better determine the benefit of newer versus older agents across treatment lines.
There are various limitations associated with the conduct of real-world studies. Firstly, available information is limited to what is collected in the selected database; in the case of clinical charts, this is typically dictated by clinical practice assessments. This means that attempting to assess the impact of potential confounders is restricted to the variables available in charts, and availability of these variables may differ from one participating site to another. For example, treatments were not categorized by stem cell transplant status in this study. This also means that older therapies such as melphalan chemotherapy may have been administered as part of the transplant regimen, but this is not captured in our data. Secondly, bias and confounding factors may occur in real-world studies, which cannot be controlled in the way they are in randomized, blinded trials (e.g. through missing data or inconsistencies within or across abstractors who collect and maintain the data). Systematic registry or reporting of study variables may also result in bias. Missing information from clinical charts cannot exclude absence of events, treatments, etc. Therefore, the use of clinical charts can result in a lower reported frequency of events or risk factors. Finally, in retrospective observational studies conducted in routine clinical practice settings, assessment is not necessarily performed on a uniform schedule and response and disease progression criteria are not dictated by an interventional protocol. A lower frequency of follow-up visits to assess progressive disease can thus result in later identification of progressive disease than in patients included in a clinical trial. In addition, physicians treating RRMM may use varying and possibly subjective criteria to assess clinical response. To minimize the potential bias relating to treatment response in our study, we included some specific questions about the frequency of visits and criteria to assess progressive disease and limited it to sites assessing progressive disease using the International Myeloma Working Group criteria. It should be noted that differences in treatment discontinuation criteria can also lead to bias, as the criteria used in clinical practice may differ from those defined in clinical trials.
Despite these limitations, real-world studies generate hypotheses that can be investigated further in randomized controlled trials and can provide insights that may not be apparent in clinical trials [Citation27and Citation28].
4. Conclusions
While bortezomib and lenalidomide predominated in first- and second-line therapy, substantial fragmentation was seen in third and later lines, highlighting the lack of defined treatment pathways for patients with RRMM. Although median rwPFS and rwOS have improved in later lines of therapy since the introduction of newer agents, real-world survival outcomes remain below those seen in clinical trials, and there is still a need for newer agents in later lines. The development of further novel agents in the RRMM setting is expected to continue to improve outcomes; however, this study highlights the importance of ensuring that these new treatments are incorporated into early treatments in the real-world setting so that their benefits are available to a wide range of patients.
Author contributions
All authors contributed toward the study design, data analysis and interpretation, and preparation of the manuscript; approved the final submitted version; and met all ICMJE criteria.
Declarations of interests
J Willson, J Opalinska and J Nelson are employees of and own stocks/shares in GSK. A Bruno was a GSK employee and stockholder at the time of study conduct. O Lanucsek, D Stafkey-Mailey, and J Willey are employees of Xcenda, a health economics and outcomes organization commissioned by GSK to conduct the research described in this manuscript. The authors have no other relevant affiliations or financial involvement with any organization or entity with a financial interest in or financial conflict with the subject matter or materials discussed in the manuscript apart from those disclosed.
Reviewer disclosures
Peer reviewers on this manuscript have no relevant financial or other relationships to disclose.
Data availability
GSK makes available anonymized individual participant data and associated documents from interventional clinical studies which evaluate medicines, upon approval of proposals submitted to www.clinicalstudydatarequest.com. To access data for other types of GSK sponsored research, for study documents without patient-level data and for clinical studies not listed, please submit an enquiry via the website.
Acknowledgments
Beth Elam, PhD and Gillian Wallace, MSc, of Fishawack Indicia Ltd, UK, provided medical writing support in the form of developing drafts based on author input, editorial assistance, and submission of the final manuscript, which was funded by GSK, but did not contribute to the study design, collection, analysis, or interpretation of data.
Additional information
Funding
References
- Papers of special note have been highlighted as either of interest (•) or of considerable interest (••) to readers.
- Anderson KC. Progress and paradigms in multiple myeloma. Clin Cancer Res. 2016;22(22):5419.
- Surveillance Epidemiology and End Results (SEER). SEER cancer stat facts: myeloma 2018 [ cited 2018 Aug 23]. Available from: http://seer.cancer.gov/statfacts/html/mulmy.html
- National Comprehensive Cancer Network (NCCN) NCCN clinical practice guidelines in oncology. Multiple Myeloma. Version 2. 2019;2018. Available from: https://www.nccn.org/store/login/login.aspx?ReturnURL=https://www.nccn.org/professionals/physician_gls/pdf/myeloma.pdf
- Sonneveld P, Broijl A. Treatment of relapsed and refractory multiple myeloma. Haematologica. 2016;101(4):396–406.
- FDA. Pomalidamide (POMALYST) prescribing information 2013 [ cited 2018 Sept 4]. Available from: https://www.fda.gov/Drugs/informationOnDrugs/ApprovedDrugs/ucm530249.htm
- FDA. Elotuzumab (EMPLICITI) prescribing information 2015 [ cited 2018 Sept 4]. Available from: https://www.fda.gov/Drugs/informationOnDrugs/ApprovedDrugs/ucm530249.htm
- FDA. Panobinostat (FARYDAK) prescribing information 2016 [ cited 2018 Sept 4]. Available from: https://www.fda.gov/Drugs/informationOnDrugs/ApprovedDrugs/ucm530249.htm
- FDA. Daratumumab (DARZALEX) prescribing information 2018 [ cited 2018 Oct 2]. Available from: https://www.accessdata.fda.gov/drugsatfda_docs/label/2018/761036s013lbl.pdf
- FDA. Ixazomib (NINLARO) prescribing information 2015 [ cited 2018 Sept 4]. Available from: https://www.fda.gov/Drugs/informationOnDrugs/ApprovedDrugs/ucm530249.htm
- FDA. Highlights of prescribing information KYPROLIS(R) (carfilzomib) 2016 [ cited 2018 Nov 19]. Available from: https://www.accessdata.fda.gov/drugsatfda_docs/label/2016/202714s015lbl.pdf
- Dimopoulos MA, Moreau P, Palumbo A, et al. Carfilzomib and dexamethasone versus bortezomib and dexamethasone for patients with relapsed or refractory multiple myeloma (ENDEAVOR): a randomised, phase 3, open-label, multicentre study. Lancet Oncol. 2016;17(1):27–38.
- Lonial S, Dimopoulos M, Palumbo A, et al. Elotuzumab therapy for relapsed or refractory multiple myeloma. N Engl J Med. 2015;373(7):621–631.
- Miguel JS, Weisel K, Moreau P, et al. Pomalidomide plus low-dose dexamethasone versus high-dose dexamethasone alone for patients with relapsed and refractory multiple myeloma (MM-003): a randomised, open-label, phase 3 trial. Lancet Oncol. 2013;14(11):1055–1066.
- Moreau P, Masszi T, Grzasko N, et al. Oral ixazomib, lenalidomide, and dexamethasone for multiple myeloma. N Engl J Med. 2016;374(17):1621–1634.
- Stewart AK, Rajkumar SV, Dimopoulos MA, et al. Carfilzomib, lenalidomide, and dexamethasone for relapsed multiple myeloma. N Engl J Med. 2015;372(2):142–152.
- Weisel K, Lentzsch S, Mateos MV, et al. Efficacy and safety of daratumumab, bortezomib and dexamethasone (DVD) versus bortezomib and dexamethasone (VD) in relapsed or refractory multiple myeloma (RRMM): updated analysis of CASTOR. European Hematology Association 22nd Annual Congress; June 24; Madrid, Spain. 2017.
- Gordan L. Site of care cost analysis true value of community oncology. 2018 Community Oncology Conference; April 12; Washington, DC. 2018.
- Bureau of Labor Statistics. Local area unemployment statistics 2005 [ cited 2019 Jun 27]. Available from: https://www.bls.gov/lau/laurdqa.htm#Q1
- Ruschak AM, Schimmer AD, Kay LE, et al. Novel proteasome inhibitors to overcome bortezomib resistance. J Natl Cancer Inst. 2011;103(13):1007–1017.
- Zhu YX, Shi C-X, Bruins LA, et al. Identification of lenalidomide resistance pathways in myeloma and targeted resensitization using cereblon replacement, inhibition of STAT3 or targeting of IRF4. Blood Cancer J. 2019;9(2):19.
- Jagannath S, Roy A, Kish J, et al., Real-world treatment patterns and associated progression-free survival in relapsed/refractory multiple myeloma among US community oncology practices. Expert Rev Hematol. 2016;9(7): 707–717.
- Gandhi UH, Cornell RF, Lakshman A, et al. Outcomes of patients with multiple myeloma refractory to CD38-targeted monoclonal antibody therapy. Leukemia. 2019;33(9):2266–2275.
- Chari A, Suvannasankha A, Fay JW, et al. Daratumumab plus pomalidomide and dexamethasone in relapsed and/or refractory multiple myeloma. Blood. 2017;130(8):974–981.
- Lonial S, Weiss BM, Usmani SZ, et al. Daratumumab monotherapy in patients with treatment-refractory multiple myeloma (SIRIUS): an open-label, randomised, phase 2 trial. Lancet. 2016;387(10027):1551–1560.
- Friends of Cancer Research (FOCR). 8th annual Blueprint for Breakthrough forum: validating real-world endpoints for an evolving regulatory landscape 2019 [ updated 2019 Sept 18; cited 2020 Mar 25]. Available from: https://www.focr.org/sites/default/files/pdf/8th_Friends-Alexandria_RWE.pdf
- FDA. FDA grants accelerated approval to selinexor for multiple myeloma 2019 [ updated 2019 Jul 3; cited 2020 Mar 25]. Available from: https://www.fda.gov/drugs/resources-information-approved-drugs/fda-grants-accelerated-approval-selinexor-multiple-myeloma
- Blonde L, Khunti K, Harris SB, et al. Interpretation and impact of real-world clinical data for the practicing clinician. Adv Ther. 2018;35:1763–1774.