
Abstract
Public policies can lead to deforestation and forest fragmentation depending on the particular land uses policies seek to promote. In turn, sequences of distinct policy incentives can generate nonlinear trajectories in deforestation and habitat fragmentation. This article takes up the case of Peru, where successive presidential administrations have promoted very different land uses. I focus on Madre de Dios, a frontier region in the southeastern Peruvian Amazon, to evaluate deforestation and fragmentation from 1986 to 2007, which covers several distinct policy periods. I draw on classified Landsat TM, ETM+, and Aster images in 5-year intervals from 1986 to 2001 and bi-annual images from 2001 to 2007 to observe trajectories in forest, crops and pasture, and regrowth. The analysis permits observation of nonlinearities in changes in the land cover classes, as well as fragmentation metrics related to size, density, connectivity, and configuration of the land cover classes over time. Distinct policies show different deforestation trajectories and fragmentation values. These findings bear implications for the study of public policies and spatiotemporal land cover dynamics and offer new monitoring tools to understand the complexity of environmental change.
1. Introduction
Tropical regions have been the most vulnerable to land use and land cover change (LULCC) in the form of deforestation, accounting for the highest total forest clearing, and notably in Amazonia (FAO, Citation2006; Kaimowitz, Citation2002; Lambin & Geist, Citation2006; Skole, Chomentowski, Sallas, & Nobre, Citation1994). In the Amazon basin, shifting cultivation by small farmers, pasture formation by cattle ranchers, and logging activities by sawmill operators have been the drivers of deforestation (Arima, Walker, Sales, Souza, & Perz, Citation2008; Ferraz, Vettorazzi, Theobald, & Ballester, Citation2005; Lambin & Geist, Citation2003; Macedo, DeFries, Morton, Galford, & Shimabukuro, Citation2012; Nepstad et al., Citation2001; Walker et al., Citation2009; Wood & Porro, Citation2002). Economic factors that are related to credit and economic opportunities for extensive cattle ranching operations and production of crops such as soybeans in the Brazilian Amazon have played a role in forest conversion to cropland and pasture (Fearnside, Citation2001; Morton et al., Citation2006; Walker et al., Citation2009).
Research addressing deforestation in the Amazon includes many studies with a policy perspective that situates market incentives within broader political circumstances (Caldas et al., Citation2007; Walker, Citation2003), as via attention to roads and market accessibility as driven by policies and as drivers of migration and economic development (Arima, Walker, Perz, & Caldas, Citation2005). Construction and improvements of roads require large-scale investments by governments, and infrastructure upgrades cut transportation costs and thus expand land areas that can be profitably exploited. Hence, policies promoting regional integration via infrastructure often result not only in the expansion of deforestation for agriculture and ranching, but also the intensification of land use (Binswanger, Citation1991; Cropper, Puri, & Griffiths, Citation2001; Kaimowitz, Mendez, Puntodewo, & Vanclay, Citation2002; Mertens et al., Citation2002; Nepstad et al., Citation1999, Citation2001; Wood & Porro, Citation2002).
LULCC describes a range of causal factors that are interrelated at different levels and vary over time. Causal frameworks for LULCC lay out a sequence of causation via a multi-scale approach from distant to intermediate to proximate causes (Lambin & Geist, Citation2006; Perz & Almeyda, Citation2010; Wood & Porro, Citation2002). In such frameworks, distant causes are linked to national public policies, intermediate causes to regional road networks, and proximate causes to individual landholder attributes (Chavez, Citation2009).
In the case of distant–proximate LULCC frameworks, public policies are essential for the comprehension of land cover changes (LCCs) (Binswanger, Citation1991; Chavez & Perz, Citation2012). In frontier regions, national governments frequently pursue economic opportunities offered by forest resources by promulgating development policies that create incentives to expand logging, agricultural, and ranching activities (Binswanger, Citation1991; Mertens et al., Citation2002; Wood & Porro, Citation2002). As a result, governments endorse a variety of tax breaks, credit lines, and other incentives (Binswanger, Citation1991; Futemma & Brondizio, Citation2003; Hecht, Citation2005; Lambin et al., Citation2000; Pacheco, Citation2002; Seto et al., Citation2002; Walker, Wood, Skole, & Chomentowski, Citation2002). Polices thus operate as distant determinants of LULCC because they create programs with incentives that may or may not prompt adoption by individual landholders and thus influence LULCC (Chavez & Perz, Citation2012).
Prior LULCC research highlighting public policies has featured the ramifications of policies for aggregate LULCC, usually the land area deforested in a given region, sometimes among two time points. For example, Pacheco (Citation2002) linked public policies in Bolivia to aggregate forest loss without incorporating a spatially explicit analysis. Other studies such as Fox, Rindfuss, Walsh, and Mishra (Citation2003), Liverman, Moran, Rindfuss, and Stern (Citation1998), Turner et al. (Citation2004), and Walsh and Crews-Meyer (Citation2002) have all linked public policies to LULCC through the use of remote sensing data for local decision makers. In each case, the focus has primarily been on deforestation dynamics rather than spatial patterns.
Nonetheless, public policies and their incentives also motivate LULCC with specific spatial patterns. Beyond the dynamics of aggregate LULCC, policies may promote specific fragmentation patterns of land cover in landscape mosaics (Moran, Citation2003). This is an important issue, because habitat fragmentation has numerous important ramifications for ecosystems and the services they provide to human populations as well as biodiversity (Lambin & Geist, Citation2003; Peralta & Mather, Citation2000; Southworth, Nagendra, & Tucker, Citation2002).
Describing fragmentation in landscape mosaics involves analysis of a suite of quantitative indicators of landscape configuration (Forman, Citation1997; Geist & Lambin, Citation2001; Lambin et al., Citation2001; Shelhas & Greenberg, Citation1996; Southworth et al., Citation2004). Landscape ecology has extensively examined spatial differences in structure and function at the landscape level of organization (Forman & Godron, Citation1986; Lausch & Herzog, Citation2002). Landscape structure encompasses the spatial distribution of land cover patches and is based on the interaction between patches in terms of their sizes, shapes, connectivity, and heterogeneity (Turner, Citation1989).
The focus on spatial patterns in landscape mosaics complements the emphasis on temporal dynamics of deforestation. Combining the two yields a spatiotemporal analysis of landscape change, involving both changes in specific land cover classes as well as their spatial characteristics, which themselves are likely to evolve over time. Although landscape ecology has frequently pursued spatiotemporal descriptions of LULCC, there are fewer examples of spatiotemporal analyses that explicitly link shifts in landscape mosaics to particular drivers of LULCC (Turner, Gardner, & O’Neill, Citation2007).
An understanding of the relationship between human behavior and land cover is required to understand the causes of changes in landscape structure. For example, analyzing the causes of changes in spatial patterns of LULCC over time (i.e., under what political, environmental, and economic contexts forest cover increases or decreases) provides knowledge about how socio-economic conditions affect dynamics in forest fragmentation (Brown, Duh, & Drzyzga, Citation2000; Forman, Citation1997; Walsh et al., Citation1999). As a consequence, linking social and spatial processes has become more relevant for understanding landscape dynamics. For example, it is known that forest patches are not only remnants of larger natural ecosystems, but represent social spaces that change over time (Browder, Citation1996). The size, shape, and configuration of landscape patches are influenced by social forces emanating from local social actors (individuals, households, and communities) as well as regional, national, and global actors (governments and transnational corporations). Although national public policies create incentives to use land in specific regions in certain ways, their adoption by individual farmers influences the local spatial pattern of LULCC (Browder, Citation1988; Walker, Citation1987, Citation2003). Relating social processes to evolution in landscape patterns thus requires attention to the socioeconomic contexts in which land-use decisions are made (Geist, Citation2006).
In turn, changes in public policies may motivate different land uses than can result into nonlinearities in LULCC over time, including nonlinearities in the dynamics of landscape patterns (Aspinall, Citation2004). Hence, shifts in policy regimes may yield temporal and spatial changes in landscape mosaics. More generally, insofar as socio-economic conditions evolve over time, landscape structures should exhibit more complex dynamism in spatial patterns of LULCC ().
Figure 1. Theoretical framework based on the linkage between social process and spatial pattern.
This study highlights shifts in policy regimes as they affect spatiotemporal dynamics of LULCC as evident in the evolution of landscape mosaics over time. It builds on the classical linkage between social processes and spatial patterns in land change science to highlight how changing public policies drive changes in land use decisions and in turn yield variations in the spatiotemporal dynamics of LULCC. This links the distant–proximate determinants framework featured in land change science to the focus on spatiotemporal landscape dynamics in landscape ecology. As a result, this study links shifts in public policies to the evolution of landscape mosaics.
The study case in this research is located in Southeastern Peru, a part of the Amazon that has experienced varied periods of deforestation driven by changing public policies (Alvarez & Naughton-Treves, Citation2003; Chavez, Citation2009). Since the 1980s, Peruvian policies for agriculture and Amazonian development have shifted from one presidential administration to the next (Arce-Nazario, Citation2007). This makes the southeastern Peruvian Amazon a useful study case to examine policy shifts for their spatiotemporal ramifications. Further, this study area is the spotlight of a major infrastructure project part of the Initiative for the Integration of Regional Infrastructure in South America (IIRSA). Under the auspices of IIRSA, the Inter-Oceanic Highway has been paved in southeastern Peru and has begun to alter areas with significant ecological value and diverse cultures (Dourojeanni, Citation2006).
This article evaluates three hypotheses concerning the ramifications of policy regimes with specific agriculture policy incentives for LULCC in terms of spatiotemporal dynamics. The first hypothesis concerns policy incentives and overall spatiotemporal dynamics in LULCC. Policy incentives that motivate people to engage in crop cultivation and ranching should yield increasing LULCC and shifting landscape mosaics over time. As southeastern Peru is a historically forest region, I specifically anticipate increasing forest fragmentation and increasingly complex forest–non-forest landscape mosaics. By contrast, policy regimes with incentives that encourage reforestation should discourage forest clearing and yield landscape shifts toward forest cover of varying ages. Shifts among these distinct categories of policy regimes over time should thus yield nonlinear dynamics in LULCC insofar as forest loss will differ between crop/pasture regimes and reforestation regimes; similarly, shifts toward forest fragmentation under crop/pasture regimes may be muted under reforestation regimes.
The second hypothesis concerns spatial variation in spatiotemporal dynamics. The spatiotemporal dynamics of LULCC under different policy regimes will themselves vary spatially across a landscape. In particular, this will reflect spatial gradients defined by ease of access, as defined by location with respect to the Inter-Oceanic Highway, specifically in terms of distance from the highway. While the highway was paved, secondary roads remain unpaved, and accessibility along those roads is more difficult, especially during the Amazon’s rainy season. Hence, there is likely to be an important distance gradient along secondary roads leading away from the highway corridor. I, therefore, expect greater LULCC impacts and larger changes in fragmentation measures over time in areas that are more accessible and less pronounced dynamics (including nonlinearities) farther from the Inter-Oceanic Highway.
My third and final hypothesis concerns public policies as they affect fragmentation of specific land cover classes. Specifically, I expect that policy impacts on fragmentation dynamics will differ among particular land cover classes. Specific policy incentives often encourage particular land uses such as crops or ranching, which are distinct land uses that have their own spatial signatures in landscapes. Crop cultivation on family farms, which predominate in the study region, involves small plots in irregular spatial configurations. By contrast, in the Amazon, ranching is general land-extensive and is thus evident in large regular blocks of pasture. Consequently, policies encouraging specific land uses should yield distinct fragmentation metrics. Further, changes in policy incentives as from those featuring crops to others emphasizing pastures embody reorientations in priority land uses and should result in shifts in spatial geometries in landscapes.
2. Study region
My study area falls within the Peruvian region of Madre de Dios. Madre de Dios constitutes part of Peru’s Amazonian ‘selva baja’ or lowland forest. The region’s vegetation is characterized by alluvial and terra firme forests, as well as low hillside bamboo forest (GESUREMAD, Citation1998; INEI, Citation2004). Alluvial forests sit on low terraces found along the borders of the major rivers and are affected by river movement and annual flooding. Terra firme forests are situated above the alluvial plains distant from river courses and lakes and are characterized by flat topography and variability in specific plant communities.
Land tenure in Madre de Dios encompasses a mosaic of different land tenure types with varying land use rules. Tenure categories in Madre de Dios include private landholdings for agriculture, forest concessions for harvesting of castaña (‘Brazil nuts’, Bertholletia excelsa) and timber, mining and oil prospecting concessions, indigenous lands, and protected areas including territorial reserves and national parks (IIAP-CTAR, Citation2001).
Historically, Madre de Dios has incurred a series of economic swings and shifts in policies that highlighted different land uses. The region has been marked by a series of boom-and-bust economic cycles, such as in rubber, timber, and gold. As in other cases of reliance on a single commodity, booms have been limited by unstable global markets and have lasted only as long as the resources themselves or the absence of competition elsewhere (Coomes, Citation1995; INADE-OEA, Citation1998).
Since the 1960s, the Peruvian government has taken greater interest in the Amazonian lowlands. In particular, since the 1980s, national and regional policies have shifted on several occasions, resulting in potential shifts in LULCC in Madre de Dios (Chavez & Perz, Citation2012). shows the three specific policy periods encompassed by the time period of this study, along with the expected LULCC outcomes, featuring fragmentation. Each policy period shows an increase or decrease in the degree of fragmentation.
Table 1. Landsat TM, ETM+, and ASTER scenes of the study area linked to specific policies and expected land cover fragmentation outcomes
The first policy period is 1985–1990 and corresponds to the first presidency of Alan Garcia. Under this policy regime, credit and cattle incentives were introduced to promote agricultural expansion (Chavez & Perz, Citation2012). The government’s objective was to support demand-driven performance by channeling resources to farmers through credit programs, controlling production expenditures, and thereby seeking to respond to demand and market prices (Escobal, Citation1992). The Agrarian Bank administered loans to farmers and procured farmer production at fixed retail prices, which the bank also guaranteed. Consequently, these incentives encouraged the acquisition of cattle and expansion of pastures (Chavez & Perz, Citation2012). This heterodox plan made many assumptions, among them are stable and robust market demand. As a result, the policies broke down because of the absence of market competitiveness among participating farmers, in large part due to inadequate agricultural extension and marketing networks (Coomes, Citation1996). Nonetheless, during the first Garcia administration, when the credit incentives for cattle ranching were in place, I expect to find an increase in forest and landscape fragmentation.
The second policy period is 1990–2000, which encompasses the presidency of Alberto Fujimori. The Fujimori administration introduced a blend of austerity measures and market liberalization, changing the economy and cutting back state support to the agricultural sector. The new structural adjustment and fiscal austerity measures on agricultural policies ultimately led to the closure of Agrarian Bank and end of credit lines and agricultural subsidies (Trivelli, Shimzu, & Glave, Citation2003). New agrarian policies focused on the promotion of agricultural diversification, increase of crop yields, and technical assistance to farmers. The government, therefore, supported seed improvement policies and reforestation initiatives (CTAR, Citation2002). As a result, during the Fujimori administration, I anticipate a reduction in LULCC and slower change in fragmentation metrics.
The third and final policy period considered here is 2001–2006, which includes the presidential term of Alejandro Toledo. Under Toledo, Peru implemented a more decentralized policy regime, differentiating policies at the regional level. Decentralization involved some delegation of state policies influencing LULCC to the regional level. In Madre de Dios, decentralization led to greater responsibilities for the Madre de Dios Special Project (Proyecto Especial Madre de Dios, or PEMD). PEMD is a regional governmental institution that focuses on local infrastructure maintenance and agricultural extension. Specifically, PEMD instituted programs that targeted three main domains, namely infrastructure, agroforestry and environment, and development of border communities. In that context, PEMD promoted policies with various LULCC incentives such as cattle insemination, fish farming, agroforestry fruit species plantation (e.g., copoasu (Theobroma grandiflorum)), and agricultural mechanization. Overall, the diversity of land uses encouraged by such initiatives should yield an increase in the degree of fragmentation. But in addition, the Toledo administration oversaw preparations for paving of the Inter-Oceanic Highway, which began in 2005. The imminent paving of the highway raised land values and has been marked by LULCC involving expansion of crops and pasture, especially in areas closer to the highway (Alvarez & Naughton-Treves, Citation2003; Mäki Kalliola & Vuorinen, Citation2001; Southworth et al., Citation2011). I, therefore, expect that landholders anticipating improved accessibility would be investing in expanded land use for crops and ranching. Thus, I anticipate an accelerated increment in forest fragmentation during this policy period.
3. Data and methods
This article evaluates changes in forest fragmentation in a specific study area encompassing Iñapari and Iberia, two districts within the province of Tahuamanu, located in the northern portion of Madre de Dios (). The study area surrounds the path of the Inter-Oceanic Highway in Tahuamanu. I focus on the highway axis between Iñapari and Iberia while also encompassing secondary roads; the result is a study area of roughly 2000 km2.
Figure 2. Study area in the province of Tahuamanu, Madre de Dios Region, Southeastern Peru.
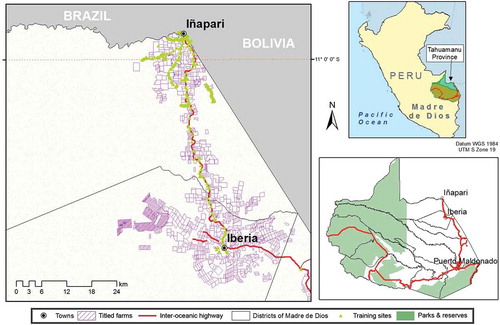
Iñapari and Iberia serve as useful endpoints for the study area, because the two towns have somewhat different histories in terms of the impacts of different policy regimes. Iberia incurred a stronger presence of government agencies during the policy periods I consider. During the Garcia administration, Iberia was the site of an Agrarian Bank branch. More recently, PEMD was established in Iberia to support various regional development policies. Paving of the Inter-Oceanic Highway began at Iñapari, but construction teams were based out of Iberia during paving.
I draw on remote sensing data for the Iñapari–Iberia area during the period 1986–2007, which encompasses the distinct policy regimes described above and the onset of paving of the Inter-Oceanic Highway in Madre de Dios. I use multi-temporal satellite imagery and land cover classifications to support measurement of forest fragmentation using several pattern metrics. This permits an evaluation of spatiotemporal LULCC dynamics across different policy regimes in terms of comparisons of fragmentation patterns over time. This also permits comparisons of dynamics in specific land cover classes as well as LULCC and fragmentation dynamics close to and farther from the highway.
3.1. Remote sensing data
Landsat satellite images were acquired for the years 1986, 1991, 1996, 2001, 2003, 2005, and 2007 for WRS Path/Row 003/068, which corresponds to the study area (). I employ Landsat TM images for 1986, 1991, 1996, 2003, and 2005, along with an ETM+ image for 2001, and a composite ASTER image for 2007. The resulting multi-temporal data permit observation of LULCC in 5-year time steps to 2001 to distinguish between policy regimes with intervals of similar length. I observe LULCC in 2-year intervals from 2001 to 2007, as I expect more rapid LULCC dynamics with the preparations for highway paving in the early 2000s and the onset of paving itself in 2005.
The 2001 ETM+ scene was geometrically rectified and registered to a UTM WGS 1984 Zone 19S coordinate system based on a 1:100,000-scale topographic map (Instituto Nacional Geográfico, 2001 version). The 1986, 1991, 1996, 2003, and 2005 TM and the 2007 Aster scenes were registered image-to-image with the rectified 2001 base image. The nearest-neighbor resampling technique was used, and a RMS error between 0.2 and 0.5 pixels was obtained for all images. All Landsat data were radiometrically calibrated using the CIPEC calibration method (Green, Schweik, & Randolph, Citation2005).
The minimum mapping unit is based on the 30 m Landsat spatial resolution and established at 90 × 90 m2 (3 × 3 pixels) with 0.8-ha ground-sampled reference data. The farm property map performed for this study is based on the 2006 official cadastral zoning map with digital farm plot boundaries based on the properties surveyed by the Land Titling Special Project (Proyecto Especial de Titulación de Tierras, PETT). The satellite and farm survey map permit links between households and LULCC via the lands for which farmers are decision makers.
I employed ground sample data collected during fieldwork in 2003 to determine land cover classes and divided the sample data into training and testing data sets. Field site visits collected data representative of each land cover class (mature forest, crops, pasture, and secondary vegetation), and preliminary image classification identified areas to be surveyed along the road transect. Field stays during 2004–2006 permitted visits to areas with classification uncertainty for ground truthing by documenting the land cover of field plots. Every plot was registered with a hand-held global positioning system device to allow integration with spatial data in a geographic information system and image processing software. In total, 295 plots covering four different land cover types were identified. During the field visits, a socio-economic survey of farm households in the study area was conducted to obtain land-use histories, especially as they relate to adoption of specific policy incentives that were part of distinct policy regimes (Chavez, Citation2009).
I used Tasseled Cap composite images to conduct an unsupervised classification through an isodata procedure in which an original 255-class image was aggregated to five-class classification (Chavez et al., Citation2013). Using ground-data training signatures and through familiarity with the study area from field visits, I grouped spectrally similar classes and used the final signatures to produce the five-class land cover map through a maximum likelihood supervised classification technique. Accuracy assessment for the 2003 image classification indicates an overall accuracy of 89%, which corresponds to the year most of the land cover training samples were taken. Final land cover classes identified and aggregated for the study area are mature forest, built/water, crops and pasture, secondary vegetation (regrowth), and haze/cloud. Classes described as mature forest encompassed alluvial and terra firme forest, as well as low hillside bamboo forest. Classes for built/water contained urban areas (village settings and roads) and water (mainly rivers and creeks). Crops and pasture comprised agricultural land (mainly rice, maize, beans, and some fruit trees) and pasture. Secondary vegetation included fallow farmland as determined through farmer reports of vegetation age (1–3 year succession, 4–7 year succession, and 8–15 year succession) (Chavez, Citation2009). Ideally, haze/clouds should have been omitted; however, it was difficult to distinguish haze/cloud during very dry years. In particular, the 1996 and 2005 Landsat images presented extremely dry and fire-prone haze conditions.
With this land cover classification and the satellite image time series, I identified LCCs among images for different time points. Given the time series of imagery, this permitted identification of land cover trajectories for the study area. I, therefore, produced six ‘from–to’ LCC trajectory maps for the periods 1986–1991, 1991–1996, 1996–2001, 2001–2003, 2003–2005, and 2005–2007.
3.2. Pattern metrics for fragmentation analysis
Land cover fragmentation analysis builds on land cover classifications by generating multiple pattern metrics for each land cover class. Fragmentation metrics describe the spatial properties of land cover to characterize the form and distribution of patches in landscape mosaics (Southworth et al., Citation2004; Walsh et al., Citation2003). Fragmentation analysis thus quantifies specific spatial characteristics of patches in landscapes and for land cover classes. Analysis of fragmentation metrics over time in turn permits evaluation of changes in spatial patterns of land cover patches, which can be interpreted in light of driving forces such as public policies.
I calculated pattern metrics for the images for 1986, 1991, 1996, 2001, 2003, 2005, and 2007 (). I employed the digital 2006 boundary file for the farm properties to focus on land cover and fragmentation inside those properties. I used the property boundaries to subset the farm properties out of the classified images (see ). I then transformed the subset areas into 30 m-grid formats, which I then input into FRAGSTATS v3. This in turn computed fragmentation metrics for each grid separately.
I selected pattern metrics based on a review of previous work on landscape fragmentation analysis (Geist, Citation2006; Nagendra et al., Citation2004; Southworth et al., Citation2002; Turner, Gardner, & O’Neill, Citation2001; Walsh et al., Citation2003). While there is not unanimity regarding the selection of pattern metrics, I employ those often used previously. I employ both landscape-level and class-level metrics as defined by McGarigal et al. (Citation2002) ().
Table 2. Landscape-level and class-level metrics measuring fragmentation utilized in this study according to McGarigal et al. (Citation2002)
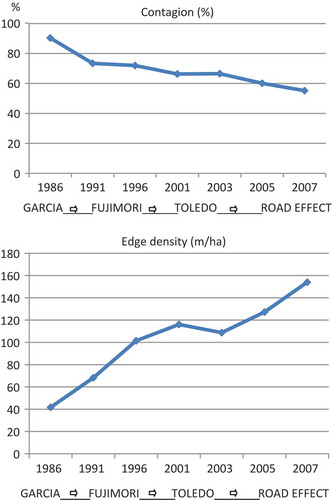
Landscape-level metrics provide a global evaluation of fragmentation in landscapes across land cover classes (Lausch & Herzog, Citation2002). Evaluation of landscape-level metrics over time provides an overall picture of how landscape fragmentation evolves. I used five landscape-level metrics in this study. They include (1) the total number of patches (NP) in the landscape; (2) the largest patch index (LPI), calculated as the percentage area of the largest patch in the landscape divided by total landscape area multiplied by 100; (3) the mean patch size (MPS) in hectares; (4) contagion in percentage (CIP) to measure patch type aggregation, values closer to 0 indicate disaggregated and interspersed patch types, and values closer to 100 indicate clustered patch types; and (5) edge density (ED), calculated as the sum of the lengths of all edge segments in the landscape, divided by the total landscape area in hectares multiplied by 10,000.
NP provides a basic index of fragmentation. A larger number of patches suggest a greater degree of fragmentation. Further, a change in NP is indicative of LCC dynamics tied to processes that multiply patches. An increase in NP may be caused by more intensive agriculture activities, which may reduce the size of patches and increase the number of land uses, yielding many small patches with distinct land cover.
The LPI is an indicator of dominance. A larger LPI value indicates less landscape fragmentation. In the context of the study region, a larger LPI implies less forest fragmentation because of agriculture and the continued predominance of forest cover.
MPS like NP is indicative of spatial heterogeneity. A smaller MPS value suggests greater fragmentation, whether in a landscape overall or for a specific land cover class. Small-scale agricultural activities yield a landscape with many small patches, and thus a smaller MPS value, than large-scale cattle ranching. However, MPS may rise if subsistence agricultural plots are consolidated into large-scale ranches or commercial agricultural operations. Such a transition has not historically occurred in the study area, but may become a possibility with the paving of the Inter-Oceanic Highway.
CIP is a texture measure of the aggregation or clumping of patches. Contagion is high when there are large aggregated patches in the landscape; by contrast, contagion is low when there are many small patches and they are interspersed. In the study site evaluated here, contagion decreases as farmers clear more small areas. However, land consolidation may result in small clearings being aggregated into larger clearings, at which point contagion increases again (Frohn et al., Citation1996).
ED captures the amount of edge in a landscape. A less fragmented landscape will have smaller ED values, whereas landscapes with more patches and more irregular patches will exhibit larger ED values.
I also employ metrics applied to each land cover class. Class-level metrics complement landscape-level metrics by focusing on the patterns of specific land cover classes, which may differ substantially (Pan et al., Citation2004; Yu & Ng, Citation2006). Further, evaluation of class-level metrics over time may reveal very different fragmentation dynamics among land cover types. I use six class-level metrics. They include (1) the percentage of the landscape in a given land cover class (PLAND); (2) the number of patches in the land cover class (NP); (3) the mean patch size of the class, in hectares (MPS); (4) the largest patch index or LPI, calculated as the area of the largest patch in the class as a percentage of total landscape area; (5) the mean Euclidean distance to the nearest neighbor among the patches of a given land cover class (ENN_MN); and (6) the interspersion–juxtaposition index (IJI), defined as the degree of intermixing of patches of designated given land cover class with all other classes. IJI reflects the actual interspersion over the maximum possible interspersion for a given land cover type. Specifically, IJI is calculated as the negative sum of the length of the edge of all patches of a given land cover class, divided by the total landscape edge, multiplied by the logarithm of the prior amount, summed over the edge of that class, divided by the logarithm of the number of patch types minus one, and multiplied by 100 to convert to a percentage.
PLAND is a class-level measure of dominance since it captures the relative area in a land cover class as a percentage of total land area. Larger values of PLAND imply less fragmentation because of greater dominance of a land cover class in a landscape.
Where fragmentation is greater, ENN_MN and IJI exhibit higher values but for different reasons. ENN_MN and IJI both measure isolation, in that both capture elements of connectivity, adjacency, insularity, and spatial heterogeneity among land cover classes. By contrast, ENN_MN emphasizes distance among patches, whereas IJI highlights interspersion among patches of different land cover types.
With these pattern metrics, I pursue an evaluation of spatiotemporal dynamics in fragmentation in the study area. Specifically, the analysis assesses whether distinct policy regimes in Peru have discernible effects on changes in pattern metrics observable in multi-temporal land cover imagery. I test for policy impacts on specific fragmentation outcomes associated with different land-cover classes, such that policies that encourage agricultural expansion and ranching should yield increasing fragmentation values, observable via, for example, a rise in NP, MPS, ED, ENN_MN, CIP, and IJI and a decline in LPI and PLAND. By contrast, policies without incentives for such expansion and policies promoting reforestation may reduce fragmentation, evident in the opposite dynamics in the pattern metrics.
spells out specific expectations concerning the effects of each policy regime for particular pattern metrics. Specifically, I expect that the credit and cattle incentives under the Garcia administration to yield increasing fragmentation. Further, I anticipate that the withdrawal of those incentives and policies encouraging reforestation under Fujimori are likely to have yielded the opposite landscape dynamics or at least dampened rising fragmentation. Finally, I expect that under the Toledo administration, policies encouraging new land use and preparations to pave the Inter-Oceanic Highway will lead to increasing fragmentation.
4. Results and discussion
4.1. LCC dynamics among policy periods from 1986 to 2007
presents from–to change trajectory time series of LCC for the farm properties in the study area from 1986 to 2007; illustrates from–to change trajectory in graphs. According to , during the 1986–1991 periods, there is clear indication of a change from forest to crops and pasture, which reflects an increment of 3154 ha. These changes are related to the credit and cattle module policies implemented by the Garcia administration beginning in the mid-1980s (Chavez & Perz, Citation2012).
Figure 3. Land-cover from–to trajectory change within the boundary of agricultural areas from 1986 to 2007.
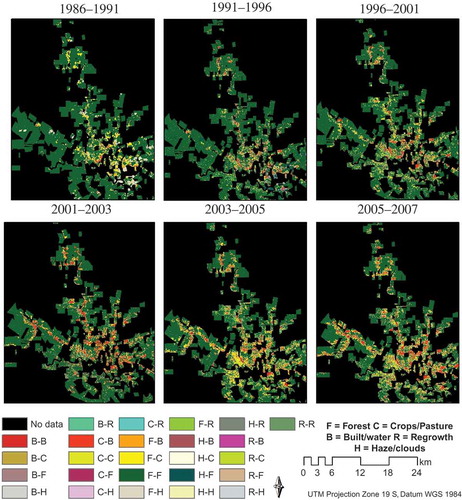
Figure 4. Land-cover from–to trajectory change classes within the boundary of agricultural areas from 1986 to 2007 linked to presidential administration and onset of paving.
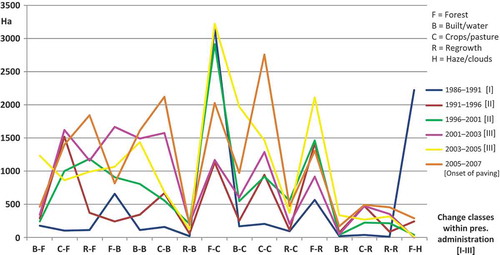
and also show an increase in regrowth of 473 ha at the end of 1990s. This differs from the previous policy period and thus indicates nonlinearity in LULCC dynamics among policy periods. This followed the withdrawal of Garcia’s agrarian incentives and the shift to other policies (such as reforestation) under Fujimori after 1990, which help account for the rise in regrowth and forest later in the decade. Some areas under pasture and crops reverted back to secondary forest once lack of cattle incentives made it difficult for farmers to acquire and maintain cattle.
The images since 2001 show a renewed increase in crops and pasture, such as the increase by 3219 ha for 2003–2005 period. This represents a shift in LULCC dynamics during the Toledo administration, which again departs from those seen under the previous administration, and provides another indication of nonlinearity among policy periods. Further, deforestation for agricultural expansion accelerates from 2005 to 2007, when road paving began. Overall, the general pattern of land use change between 1986 and 2007 followed a 10-fold transformation of agricultural land and a significant loss of forest by 25% of its total area.
4.2. Landscape pattern metrics
presents findings for the five measures of landscape-level pattern metrics from 1986 to 2007. The pattern metrics confirm some nonlinearities noted above and reveal complex spatiotemporal dynamics of LULCC in the study area. There is an overall rise in fragmentation, which I expected based on growing deforestation, but the timing of nonlinearities in the fragmentation analysis is somewhat lagged from the timing of nonlinearities in the imagery discussed above. By evaluating nonlinearity within fragmentation, we obtain a better sense of the spatial arrangement of the landscape than by only accounting for land use change statistics.
Table 3. Changes in landscape pattern indices within the boundaries of farm plot areas between 1986 and 2007 in the road axis Iñapari–Iberia, Southeastern Peru
NP increases drastically until 1996, but the increase slows in the late 1990s and there is a decline from 2001 to 2003. That again reverses by 2005, and NP rises sharply by 2007. This time series indicates a severe but discontinuous fragmentation process. The other landscape-level pattern metrics have similar dynamics. LPI initially declines through the mid-1990s, then levels off, then declines at an accelerating rate to 2007. MPS also drops to 2001, rises slightly in 2003, and then declines again at an accelerating pace by 2007. These three indicators all suggest forest fragmentation into more numerous and smaller patches in the study area. The nonlinear dynamics roughly correspond to the Garcia policy regime encouraging agricultural expansion, followed by the Fujimori administration’s withdrawal of incentives for growth alongside support for reforestation and Toledo’s emphasis on new agricultural activities alongside the onset of paving of the Inter-Oceanic Highway in the study area.
The other landscape-level pattern metrics, which emphasize patch distance and shape, also indicate nonlinear dynamics tied to distinct policy regimes, as shown in . The CIP metric reveals a sequence of landscape disaggregation, as clusters decline in size, again with a halt around 2003, which resumes thereafter (). CIP thus suggests a landscape increasingly fragmented, particularly during the early years of the time series under Garcia and the most recent period under Toledo with highway paving. Similarly, ED rises until 2001, declines slightly by 2003, and rises rapidly by 2007. This parallels the dynamics in other fragmentation indexes and indicates that edges of fragments become longer relative to their areas (). Low MPS values coupled with high ED values indicate greater fragmentation of the landscape in 2001 and 2007. Overall, the findings for the landscape-level metrics correspond to expectations. Policy regimes encouraging agricultural expansion yield spatiotemporal dynamics involving expanding fragmentation, whereas policy regimes that lack economic stimulants or include reforestation initiatives catalyze slow increases or declines in landscape fragmentation.
Figure 5. Changes in CIP and ED at landscape level from 1986 to 2007 linked to presidential administrations and road paving.
4.3. Class pattern metrics
shows findings for the six class-level metrics. PLAND provides a basic indicator of land cover as distributed among the cover classes. Mature forest decreased from 97% in 1986 to 85% in 1991, with a slight rise to 1996, a slow decline to 2003, and acceleration in forest decline thereafter. Particularly interesting are the reversals in forest dynamics from the decline during Garcia’s credit and cattle incentives (1986–1991), and the rise after those incentives were withdrawn by Fujimori, who then implemented reforestation incentives (1991–1996), and the rapid decline after 2003 as preparations for paving were underway during Toledo’s administration. The other land cover classes show the inverse dynamics with rising areas under bare/built, crops/pasture, and regrowth, though the timing of increases and declines varies somewhat among classes.
Table 4. Class pattern indices for farm plot areas: PLAND (percentage of land area), NP (number of patches), MPS (mean patch size), LPI (largest patch index), ENN_MN (mean Euclidean nearest neighbor distance distribution), and IJI (interspersion juxtaposition index)
Although PLAND at the class-level is a fairly aggregated area-based measure that says little about spatial form or distribution, the other class-level measures provide more information on fragmentation patterns. NP shows rapid change dynamics in the study area. In every land cover class, the number of patches increases substantially from 1986 to 2007. This means that forest, crops/pasture, and regrowth were fragmented by other class patches. In particular, forest fragments proliferate almost 40-fold and crops/pasture and regrowth both multiply more than 10-fold.
An interesting phenomenon here is that class-specific dynamics in NP nonetheless vary: regrowth patches in particular multiply from 1991 to 1996, but then they decline in number until 2003. This pattern contrasts greatly with the dynamics in regrowth area. During 1991–1996, regrowth area declined but the number of patches rose, suggesting fragmentation of regrowth; but from 1996 to 2001, regrowth area rose and the number of patches declined, suggesting reaggregation of regrowth.
By contrast, during 1991–1996, the area and number of patches under crops/pasture both rose, and during 1996–2001, both rose again. This suggests that during 1991–1996, crops/pasture rose at the expense of regrowth, but during 1996–2001, they rose at the expense of mature forest. Landscape fragmentation among land cover classes thus exhibits complex dynamics even within a given policy regime, though also makes clear that dynamics differ considerably between regimes. The shifts from Fujimori during the 1990s to Toledo (and highway paving) during the 2000s are especially large.
also shows large differences in class-level fragmentation in terms of MPS: forest patches decline massively, whereas the other classes do no show major changes in patch size. This confirms that the key fragmentation dynamic at play in the study area is forest fragmentation into ever smaller patches because of the multiplication of patches of roughly constant size in the other land cover classes. The findings for MPS also confirm distinct forest fragmentation dynamics under different policy regimes: mean forest patch size drops precipitously under Garcia, but then the decline slows under Fujimori until after 2003, when under Toledo and during highway paving forests become more fragmented still.
Findings for LPI are similar to those for MPS, since both evaluate patch sizes. As with MPS, LPI for forests declines, though not precipitously, while LPI for the other classes rises, though to a limited degree. This implies differences in forest patch sizes among properties, such that many properties lost forest during the study period, but not all, so MPS declined but some larger patches, however, remained. Nonetheless, after 2001, even forest LPI declines, especially after 2005 with the onset of highway paving. Given that LPI is a good indicator of dominance, the results show that forest lost dominance over the years; however, no steady increase in dominance among other classes followed.
ENN_MN and IJI capture aspects of the spatial distribution of patches among the land cover classes. Both show interesting dynamics that are reflective of shifts among the policy regimes. ENN_MN shows that distances among patches declined in all of the land cover classes and that the declines were rapid under Garcia, slow under Fujimori, and variable under Toledo and highway paving (2001–2007). Forest ENN_MN declined overall under Toledo, indicating ongoing forest fragmentation. By contrast, crop ENN_MN also declines, but that does not reflect a proliferation of crop patches (NP) as much as an increment in crop areas (MPS). In further contrast, ENN_MN for regrowth fluctuates by rising and declining during the same period, which suggest that crop/pasture expansion initially came from clearing forests but, during 2005–2007, also involved clearing regrowth, a sign of land use intensification, as shown in .
Figure 6. Changes in ENN_MNN and IJI at class level from 1986 to 2007 linked to presidential administrations and road paving.
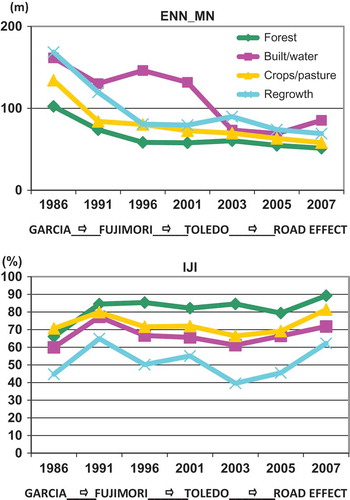
IJI confirms this interpretation as every land cover class exhibits an initial rise under Garcia, a decline during Fujimori and early Toledo, and then a rise late in Toledo’s administration and with the onset of highway paving. Patches of a given land cover are thus increasingly interpenetrated by other classes. IJI thus indicates a rise, decline, and rise again in land cover interspersion over time that corresponds to the types of policy incentives on offer during those time periods ().
4.4. Implications for LULCC
The results confirm expectations that fragmentation measured through patch number, size, shape, connectivity, and interspersion exhibit dynamics linked to policy processes. This applies to landscape-level and land cover class-level measures of pattern metrics. For both types of pattern metrics, policy regimes promulgating agricultural expansion correspond to landscape dynamics involving growing forest fragmentation, while regimes where agricultural incentives are withdrawn and reforestation is instead promulgated yield landscape dynamics exhibiting declining fragmentation. Further, two distinct policy periods seek to advance agricultural expansion both yielded rising fragmentation; hence, agricultural expansion proceeded with landscape and forest fragmentation before and after a period of reforestation.
All that said, these policy packages were not able to influence the dominance of the non-forest land covers. For example, one might anticipate that agricultural expansion lead to a process of aggregation of pasture/crops over time and thus increasing dominance of that land cover class. This did not happen in the study area because agriculture expansion did not prosper and was rather marked by weak institutions, unstable market, and financial structures. As a result, although agricultural areas increased, this was due to a proliferation of small agricultural areas, some of which reverted to regrowth, rather than exhibiting aggregation and thus increasing dominance. As a consequence, the spatial pattern in the landscapes of the properties in the study region has been dominated by a mixture of patches of pasture/crops, regrowth, and forest (Chavez & Perz, Citation2012).
Despite the strong findings for policies and fragmentation dynamics, policies are not alone in determining LCC. Policy regimes operate as distant causes of LCC, mediated by proximate determinants such as land use decisions. Previous research in the study area has shown that policy regimes determine the policy incentives that can be adopted by landowners, such that adoption of a given policy incentive in turn influences subsequent land use (Chavez & Perz, Citation2012). At the same time, farmer characteristics (household life-cycle, land-use and migration history, land tenure, soil fertility, and most notably governmental support) all affect landscape change (Chavez & Perz, Citation2012). Further, promulgation of policies does not guarantee their adoption or successful implementation with the outcomes anticipated. On the Peruvian frontier, policies did not include an effective system of technical assistance that is also necessary to support policy adoption and LULCC along the lines intended (Chavez & Perz, Citation2012).
Research on policies and landscape dynamics has been inadequate and requires further attention, considering the many policies that influence the environment and human behavior (Geist, Citation2006; Lambin & Geist, Citation2006). In particular, recent studies that have shown how environmental policies for improved law enforcement and effective management of protected areas have exerted a measurable impact via deforestation decline (Macedo et al., Citation2012; Nepstad et al., Citation2009). The design of the current study complements such work by highlighting nonlinear landscape dynamics over time among distinct policy regimes. The negative effects of policy regimes that promote deforestation can be reversed or at least slowed via implementation of alternative policy regimes. Of course, by the same token, the impacts of policies with more positive effects via reduced deforestation can also be undone via switches to more aggressive policies promoting forest loss. Policies can thus both accelerate and reverse (or at least decelerate) deforestation and fragmentation.
Combining a focus on public policies with analysis of landscape dynamics via remote sensing opens a new avenue for analysis of the land cover impacts of policy regimes. This study complements previous LULCC research featuring policy impacts by not only highlighting the temporal dynamics of LULCC but also underscoring the spatial dimension via the use of pattern metrics of landscape fragmentation. The specific information provided by each metric facilitates a better understanding of the complexity and variability among land classes occurring on a landscape (Turner et al., Citation2007). Findings for aggregate deforestation often resonate with those for pattern metrics, but fragmentation metrics added to understanding by revealing additional details about different characteristics of landscape mosaics. For example, the increase in agricultural land area did not imply increased dominance of agriculture because of the highly discontinuous spatial distribution of agricultural land cover. Further, the dynamics of pattern metrics for different land covers varied, such that agriculture initially expanded because of mature forest loss but later because of agricultural expansion in areas with regrowth, which have very different pattern metrics than mature forest. The result is that the overall mosaic of land covers changed in very different ways during the two distinct increments in agriculture during the first and last policy periods. Hence, policies promoting agricultural expansion in different historical moments may both yield the intended effect but via different LCC dynamics and with distinct implications for fragmentation, whether considered at the level of the overall landscape or among distinct land cover classes. While clearing of mature forest reduced mean patch size, clearing of regrowth patches did not; similarly, while the earlier increment of forest loss yielded a large increase in interspersion, the later pole of deforestation did not.
Despite the advances permitted by spatiotemporal analysis, challenges remain. Agricultural plot areas may be the proper units to establish a spatial relationship between people reacting to policies. This study permitted linkages of landscape fragmentation analysis to human land use decisions by focusing on lands within properties with known land tenure and thus land use rules. Nonetheless, observation of LCC dynamics in those properties does not guarantee a straightforward understanding of landowner priorities for their land use. If a landholder holds properties outside the study area, as via rentals and fragmented landownership, the full impacts of a given policy on that landholder are not observable. Further, landowner turnover complicates the temporal interpretation of policy impacts on a property. And of course, any analysis of property-level LULCC dynamics must confront errors in property boundary registration vis-à-vis the imagery.
Another issue concerns the timing of changes in policy regimes and observation of LULCC (Aspinall, Citation2004). One might argue that policy impacts are lagged in landscape dynamics. At least for the study area in the Peruvian context, landscape dynamics in terms of pattern metrics corresponded closely in time to policy regimes per expectations with little lag. This need not always be the case. This study also varied the time periods between land cover observations using both 5- and 2-year intervals. While the 5-year intervals roughly corresponded to presidential administrations and the LCC dynamics during those intervals followed the concurrent policy regimes, the shorter 2-year intervals after 2001 did not and revealed substantial variations within the period of the Toledo administration. Hence, using time intervals for LCC that correspond to policy regimes can artificially obscure inter-annual dynamics that may reflect other factors, such as market price swings. At the same time, the 2-year intervals around 2005 permitted observation of short-term dynamics around the end of the Toledo administration, which corresponded to the transition from preparations for paving (before 2005) and actual paving (after 2005). Although observing a single longer interval from 2001 to 2005 would have corresponded more closely with the Toledo administration, the shorter intervals revealed nonlinearities during that policy regime, which raises questions about other nonlinearities during previous administrations. Choosing an appropriate temporal interval of analysis in accordance with the pace of shifts in policies is thus crucial for observing LCC that may or may not correspond to policy regimes and thus their impacts.
5. Conclusion
This article related policy regimes to landscape dynamics and pattern metrics by presenting a spatiotemporal analysis of LULCC over a time period encompassing governmental administrations in Peru with very different policy incentives for land use using a time series of land cover classifications for the southeastern Peruvian Amazon. Findings for both landscape- and class-level pattern metrics indicate fragmentation dynamics consistent with expectations: rising fragmentation during periods of policy regimes seeking to expand agriculture and stagnant or declining fragmentation during regimes that withdrew such incentives and promulgated reforestation instead. The temporal scale of the study and the focus on landscape patterns provides the framework for spatiotemporal assessments of changes in landscape patterns other regions experiencing nonlinear change processes. This is of particular importance for evaluation of the impacts of changes in public policies or implementation of new infrastructure projects, since they generate not only nonlinear temporal dynamics but also complex changes in landscape mosaics.
Although changes in and the configuration of landscape patch mosaics cannot be attributed only to policy effects, the results show that policies have period-specific impacts on landscape pattern metrics and that policy periods with contrasting policies do exhibit contrasting spatiotemporal landscape dynamics. The findings suggest that a detailed understanding of policy regimes helps account for dynamics in pattern metrics for landscapes overall and for specific land cover classes. This study contributes a more comprehensive appreciation of the importance of policies for landscape dynamics in terms of landscape pattern changes. Detailed landscape pattern monitoring carries implications for designing policies for favorable LULCC outcomes via reductions in both habitat loss and fragmentation. Policies can greatly affect not only deforestation but also forest fragmentation, and the impacts of one set of policies can be slowed (if not reversed) by alternative policies. Environmental monitoring of aggregate forest cover as well as habitat fragmentation provides a more informative basis for evaluating policy impacts and for making adjustments in policies to optimize economic development and environmental protection.
Acknowledgments
This research was funded in part by the international dissertation fellowship from the Compton Foundation, Environmental and Sustainable Development, the Tropical and Development Conservation Research Fellowship, and the Tropical and Development Conservation Field Research Grant of the University of Florida. I am grateful to the Proyecto Especial Madre de Dios in Iberia, Peru, and the people of Iberia and Iñapari. I thank Stephen G. Perz, Sean Chenoweth, and anonymous reviewers for their comments on an earlier version of the manuscript.
References
- Alvarez, N., & Naughton-Treves, L. (2003). Linking national agrarian policy to deforestation in the Peruvian Amazon: A case study of Tambopata 1986–1997. Ambio, 23, 269–274.
- Arce-Nazario, J. A. (2007). Human landscapes have complex trajectories: Reconstructing Peruvian Amazon landscape history from 1948 to 2005. Landscape Ecology, 22, 89–101.
- Arima, E., Walker, R., Perz, S., & Caldas, M. (2005). Loggers and forest fragmentation: Behavioral models of road building in the Amazon Basin. Annals of the Association of American Geographers, 95(3), 525–541.
- Arima, E., Walker, R., Sales, M., Souza Jr, C., & Perz, S. G. (2008). Emergent road networks and the fragmentation of space in the Amazon Basin. Photogrammetric Engineering and Remote Sensing, 74(6), 699–709.
- Aspinall, R. (2004). Modelling land use change with generalized linear models – A multi-model analysis of change between 1860 and 2000 in Gallatin Valley, Montana. Journal of Environmental Management, 72(1–2), 91–103.
- Binswanger, H. (1991). Brazilian policies that encourage deforestation in the Amazon. World Development, 19(7), 821–829.
- Browder, J. O. (1988). Public policy and deforestation in the Brazilian Amazon. In R. Repetto & M. Gillis (Eds.), Public policies and the misuse of forest resources. Cambridge: Cambridge University Press.
- Browder, J. O. (1996). Reading colonist landscapes: Social interpretation of tropical forest patches in an Amazonian frontier. In J. Schelhas & R. Greenberg (Eds.), Forest Patches in Tropical Landscapes, Washington, DC: Island Press.
- Brown, D. G., Duh, J. D., & Drzyzga, S. A. (2000). Estimating error in an analysis of forest fragmentation change using North American Landscape Characterization (NALC) data. Remote Sensing of the Environment, 71, 106–117.
- Caldas, M., Walker, R., Perz, S., Arima, E., Aldrich, S., & Simmons, C. (2007). Theorizing land cover and land use change: The peasant economy of colonization in the Amazon Basin. Annals of the Association of American Geographer, 97(1), 86–110.
- Chávez, A. (2009). Public policy and spatial variation in land use and land cover in the Peruvian Amazon ( Dissertation manuscript). University of Florida, Gainesville.
- Chávez, A., & Perz, S. (2012). Adoption of policy incentives and land use: Lessons from frontier agriculture in Southeastern Peru. Human Ecology, 40(4), 525–539. doi:10.1007/s10745-012-9494-3
- Chávez Michaelsen, A., Huamani Briceño, L., Fernandez Menis, R., Bejar Chura, N., Valera Tito, F., Perz, S., . . . Brown, I.F., Domínguez del Aguila, S., Pinedo Mora, R., Alarcón Aguirre, G. (2013). Regional deforestation trends within local realities: Land-cover change in southeastern Peru 1996–2011. Land, 2(2), 131–157. doi:10.3390/land2020131
- Coomes, O. T. (1995). A century of rain forest use in Western Amazonia: Lessons for extraction-based conservation of tropical forest resources. Forest & Conservation History, 39, 108–120.
- Coomes, O. T. (1996). State credit programs and the peasantry under populist regimes: Lessons from the APRA experience in the Peruvian Amazon. World Development, 24(8), 1333–1346.
- Cropper, M., Puri, J., & Griffiths, C. (2001). Predicting the location of deforestation. Land Economics, 77(2), 172–186.
- CTAR. (2002). Plan estratégico concertado de desarrollo Madre de Dios 2002–2004. Puerto Maldonado: Author.
- Dourojeanni, M. J. (2006). Estudio de caso sobre la carretera Interoceánica en la Amazonia sur del Perú. Lima: SERVIGRAPH E.I.R.L.
- Escobal D’Angelo, J. (1992). Impacto de la política de precios y de crédito agrícola sobre la distribución del ingreso en el Perú: 1985–1990. Documento de trabajo 18, Lima: GRADE.
- Fearnside, P. M. (2001). Global warming and tropical land-use change: Greenhouse gas emissions from biomass burning, decomposition and soils in forest conversion, shifting cultivation and secondary vegetation. Climate Change, 46, 115–158.
- Ferraz, S. F. B., Vettorazzi, C. A., Theobald, D. M., & Ballester, M. V. R. (2005). Landscape dynamics of Amazonian deforestation between 1984 and 2002 in central Rondônia, Brazil: Assessment and future scenarios. Forest Ecology and Management, 204, 67–83.
- Food and Agricultural Organization of the U.N. (FAO). (2006). Global forest resources assessment 2005: Progress towards sustainable forest management. Rome: Author.
- Forman, R. (1997). Land Mosaics. The ecology of landscapes and regions. Cambridge: Cambridge University Press.
- Forman, R. T. T., & Godron, M. (1986). Landscape ecology. New York, NY: John Wiley and Sons.
- Fox, J., Rindfuss, R., Walsh, S., & Mishra, V. (Eds.). (2003). People and the environment. approaches for linking household and community surveys to remote sensing and GIS. Boston, MA: Kluwer Academic Publishers.
- Frohn, R. C., McGwire, C., Dale, H., & Estes, J. E. (1996). Using satellite remote sensing analysis to evaluate a socio-economic and ecological model of deforestation in Rondônia, Brazil. International Journal of Remote Sensing, 17, 3233–3255.
- Futemma, C., & Brondizio, E. (2003). Land reform and land-use changes in the lower Amazon: Implications for agricultural intensification. Human Ecology, 31, 369–402.
- Geist, H. J. (Ed.). (2006). Our earth’s changing land. An encyclopedia of land-use and land-cover change. Vol. 2, Westport, CA: Greenwood Press.
- Geist, H. J., & Lambin, E. F. (2001). What drives tropical deforestation? A meta-analysis of proximate and underlying causes of deforestation based on subnational scale study evidence (LUCC Report Series No. 4). Louvain-la-Neuve: University of Louvain.
- GESUREMAD. (1998). Plan estratégico de desarrollo del departamento de Madre de Dios 1998–2008, Gerencia Sub Regional de Madre de Dios: Author.
- Green, G. M., Schweik, C. M., & Randolph, J. C. (2005). Retrieving land-cover change information from landsat satellite images by minimizing other sources of reflectance variability. In E. F. Moran & E. Ostrom (Eds.), Seeing the forest and the trees: Human-environmental interactions in forest ecosystems. Cambridge, MA: The MIT Press.
- Hecht, S. (2005). Soybeans, development, and conservation on the Amazon Frontier. Development and Change, 36, 375–404.
- IIAP-CTAR. (2001). Madre de Dios, camino al desarrollo sostenible: Propuesta de zonificación ecológica económica como base para el ordenamiento territorial. Iquitos: mpresiones C.E.T.A.
- INADE-OEA. (1998). Plan de desarrollo de las comunidades fronterizas Peruano-brasileñas, Iñapari-Assis Brasil. CIDI/OEA.
- INEI. (2004). Almanaque Estadístico 2004-Madre de Dios. Lima: Author.
- Kaimowitz, D. (2002). Amazon deforestation revisited. Latin American Research Review, 37, 221–235.
- Kaimowitz, D., Mendez, P., Puntodewo, A., & Vanclay, J. (2002). Spatial Regression Analysis of Deforestation in Santa Cruz, Bolivia. In C. Wood & R. Porro (Eds.), Deforestation and land use in the Amazon. Gainesville, FL: University of Florida Press.
- Lambin, E. F., & Geist, H. J. (2003). Regional differences in tropical deforestation. Environment, 10(6), 22–36.
- Lambin, E. F., & Geist, H. J. (Eds.). (2006). Land-use and land-cover change: Local processes to global impacts. Heidelberg: Springer Verlag.
- Lambin, E. F., Mertens, B., Sunderlin, W., & Ndoye, O. (2000). Impact of macroeconomic change in deforestation in South Cameroon: Integration of household survey and remotely-sensed data. World Development, 28, 983–999.
- Lambin, E. F., Turner II, B. L., Geist, H. J., Agbola, S. B., Angelsen, A., Bruce, J. W., . . . Xu, J. (2001). The causes of land-use and land-cover change: Moving beyond the myths. Global Environment Change, 11, 261–269.
- Lausch, A., & Herzog, F. (2002). Applicability of landscape metrics for the monitoring of landscape change: Issues of scale, resolution and interpretability. Ecological Indicators, 2, 3–15.
- Liverman, D., Moran, E., Rindfuss, R., & Stern, P. (Eds.). (1998). People and pixels. Linking remote sensing and social science. Washington, DC: National Academy Press.
- Macedo, M., DeFries, R., Morton, D., Galford, G., & Shimabukuro, Y. (2012). Decoupling of deforestation and soy production in the southern Amazon during the late 2000s. PNAS, 109(4), 1341–1346. doi:10.1073/pnas.1111374109
- Mäki, S., Kalliola, R., & Vuorinen, K. (2001). Road consequences in the Peruvian Amazon: Process, causes and consequences. Environmental Conservation, 28(3), 199–214.
- McGarigal, K., Cushman, S. A., Neel, M. C., & Ene, E. (2002). FRAGSTATS: Spatial Pattern Analysis Program for Categorical Maps. Computer software program produced by the authors at the University of Massachusetts, Amherst. Retrieved from http://www.umass.edu/landeco/research/fragstats/fragstats.html
- Mertens, B., Poccard-Chapuis, R., Piketty, M.-G., Lacques, A.-E., & Venturieri, A. (2002). Crossing spatial analyses and livestock economics to understand deforestation processes in the Brazilian Amazon: The case of Sao Felix do Xingu in South Para. Agricultural Economics, 27, 269–294.
- Moran, E. (2003). Settlement design. Forest fragmentation, and landscape change in Rondonia, Amazonia. Photogrammetric Engineering & Remote Sensing, 69(7), 805–812.
- Morton, D. G., De Fries, R. S., Shimabukuro, Y. E., Anderson, L. O., Arai, E., del Bon Espirito-Santo, F., . . . Morisette, J. (2006). Cropland expansion in the southern Brazilian Amazon. Proceedings of the National Academy of Sciences of the United States, 103, 14637–14641.
- Nagendra, H., Munroe, D. K., & Southworth, J. (2004). From pattern to process: Landscape fragmentation and the analysis of land use/land cover change. Agriculture, Ecosystems and Environment 101, 111–115.
- Nepstad, D., Carvalho, A. C., Barros, A., Alencar, A., Capobianco, J. P., Bishop, J., . . . Prins, E. (2001). Road paving, fire regime, feedbacks, and the future of Amazon forests. Forest Ecology and Management, 154, 395–407.
- Nepstad, D., Soares-Filho, B. S., Merry, F., Lima, A., Moutinho, P., Carter, J., . . . Stella, O. (2009). The end of deforestation in the Brazilian Amazon. Science, 326(5958), 1350–1351. doi:10.1126/science.1182108
- Nepstad, D., Verissimo, A., Alencar, A., Nobre, C., Lima, E., Lefebre, P., . . . Brooks, V. (1999). Large-scale impoverishment of Amazonian forests by logging and fire. Nature, 398, 505–508.
- Pacheco, P. (2002). Deforestation and forest degradation in Lowland Bolivia. In C. Wood & R. Porro (Eds.), Land use and deforestation in the Amazon. Gainesville, FL: University of Florida Press.
- Pan, W. K. Y., Walsh, S. J., Bilsborrow, R. E., Frizzelle, B. G., Erlien, C. M. & Baquero, F. (2004). Farm-level models of spatial patterns of land use and land cover dynamics in the Ecuadorian Amazon. Agriculture, Ecosystems and Environment, 101, 117–134.
- Peralta, P., & Mather, P. (2000). An analysis of deforestation patterns in the extractive reserves of Acre, Amazonia from satellite imagery: A landscape ecological approach. International Journal of Remote Sensing, 21, 2555–2570.
- Perz, S., & Almeyda, A. (2010). A Tri-partite framework of forest dynamics: Hierarchy, panarchy, and heterarchy in the study of secondary growth. In H. Nagendra & J. Southworth (Eds.), Reforesting landscapes: Linking pattern and process. Heidelberg: Springer Landscape Series.
- Schelhas, J., & Greenberg, R. (Eds.). (1996). Forest patches in tropical landscapes. Washington, DC: Island Press.
- Seto, K., Kaufmann, R., & Woodcock, C. (2002). Monitoring land use change in the Pearl River Delta, China. In S. Walsh & K. Crews-Meyer (Eds.), Linking people, place and policy: A GIScience Approach. London: Kluwer Academic Publishers.
- Skole, D. L., Chomentowski, W. A., Sallas, W. A. & Nobre, A. D. (1994). Physical and human dimensions of deforestation in Amazonia. BioScience, 44, 314–322.
- Soares-Filho, B., Moutinho, P., Nepstad, D., Anderson, A., Rodrigues, H., Garcia, R., . . . Maretti, C. (2010). Role of Brazilian Amazon protected areas in climate change mitigation. Proceedings of the National Academy of Sciences, 107(24), 10821–10826. doi:10.1073/pnas.0913048107
- Southworth, J., Marsik, M., Qiu, Y., Perz, S., Cumming, G., Stevens, F., . . . Barnes, G. (2011). Roads as drivers of change: Trajectories across the tri-national frontier in MAP, the Southwestern Amazon. Remote Sensing, 3, 1047–1066. doi:10.3390/rs3051047
- Southworth, J., Munroe, D., & Nagendra, H. (2004). Land cover change and landscape fragmentation-comparing the utility of continuous and discrete analysis for Western Honduras Region. Agriculture, Ecosystems and Environment, 101, 185–205.
- Southworth, J., Nagendra, H., & Tucker, C. (2002). Fragmentation of a landscape: Incorporating landscape metrics into satellite analyses of land-cover change. Landscape Research, 27, 253–269.
- Trivelli, C., Shimzu, T., & Glave, M. (2003). Economic liberalization and evolution of rural agricultural sector in Perú. L.A.S. Series No. 2. Institute of Developing Economies IDE-JETRO.
- Turner II, B. L., Geoghagen, J. G., & Foster, D. R. (2004). Integrated land change science and tropical deforestation in the Southern Yucatán: Final frontiers. Oxford: Clarendon Press/Oxford University Press.
- Turner II, B. L., Lambin, E. F., & Reenberg, A. (2007). The emergence of land change science for global environmental change and sustainability. Proceedings of National Academic of Sciences, 104(52), 20672–20677.
- Turner, M. G. (1989). Landscape ecology: The effect of pattern on process. Annual Review of Ecology, Evolution, and Systematics, 20, 171–197.
- Turner, M. G., Gardner, R. H., & O’Neill, R. V. (2001). Landscape ecology in theory and practice: Pattern and process. New York, NY: Springer.
- Walker, R. (1987). Land use transitions and deforestation in developing countries. Geographical Analysis, 19, 18–30.
- Walker, R. (2003). Mapping process to pattern in the landscape change of the Amazonian Frontier. Annals of the Association of American Geographers, 93(2), 376–398.
- Walker, R., Browder, J., Arima, E., Simmons, C., Pereira, R. Caldas, M., . . . Zen, S. (2009). Ranching and the new global range: Amazônia in the 21st Century. Geoforum, 40(5), 732–745.
- Walker, R., Wood, C., Skole, D., & Chomentowski, W. (2002). The impact of land titling on tropical forest resources. In S. Walsh & K. Crews-Meyer (Eds.), Linking people, place and policy: A GIScience approach. London: Kluwer Academic Publishers.
- Walsh, S., Evans, T. P., Welsh, W. F., Entwisle, B., & Rindfuss, R. R. (1999). Scale dependent relationships between the population and environment in northeast Thailand. Photogrammetric Engineering and Remote Sensing, 65, 97–105.
- Walsh, S. J., Bilsborrow, R. E., McGregor, S. J., Frizzelle, B. G., Messina, J. P., Pan, W. K. Y., . . . Baquero, F. (2003). Integration of longitudinal surveys, remote sensing time-series, and spatial analyses: Approaches for linking people and place. In J. Fox, R. R. Rindfuss, S. J. Walsh, & V. Mishra (Eds.), People and the environment: Approaches for linking household and community surveys to remote sensing and GIS. Boston, MA: Kluwer Academic Publishers.
- Walsh, S. J., & Crews-Meyer, K. (Eds). (2002). Linking people, place and policy: A GIScience approach. London: Kluwer Academic Publishers.
- Wood, C., & Porro, R. (Eds.). (2002). Deforestation and land use in the Amazon. Gainesville, FL: University of Florida Press.
- Yu, X., & Ng, C. (2006). An integrated evaluation of landscape change using remote sensing and landscape metrics: A case study of Panyu, Guangzhou. International Journal of Remote Sensing, 27, 1075–1092.