
Abstract
In the Amazonian rainforest, a new and pervasive spatial pattern has been created by road paving and the impacts of road paving usually extend from a small-scale region to an entire social–ecological system, making a multi-scale analysis imperative for thinking through structure, function, and dynamics of deforested landscapes. We propose a moving window approach to describe the deforestation impacts across multiple spatial scales and then illustrate this method with a deforestation example in an Amazon tri-national frontier, which provides an excellent tri-national deforestation and land change comparision for this work. The results indicate that the intensive fragmentation occurs locally, while a large part of the study area is still covered by forest. In addition, a smaller study was undertaken to further assess deforestation impacts, and we found that the cleared areas exhibit strong influences beyond the boundaries of itself. In this research, the landscape-based representation of deforestation dynamics and their impacts on the larger landscape provides important information for forest studies and could be included in future conservation programs.
1. Introduction
Land use and land cover changes play a major role in the study of global change, which have largely resulted in deforestation, biodiversity loss, global warming, and increase in natural hazards (Dwivedi, Sreenivas, & Ramana, Citation2005; Mas et al., Citation2004; Reis, Citation2008). Significant attention has been drawn to areas of tropical forest cover, and specifically the Amazon region over the past few decades, due to the alarming rates of clearing (Andersen, Granger, Reis, Weinhold, & Wunder, Citation2002; Giles & Burgoyne, Citation2008; Marsik, Stevens, & Southworth, Citation2011; Nepstad et al., Citation1999, Citation2001; Southworth et al., Citation2011; Sun, Huang, Southworth, & Qiu, Citation2013). Laurance, Albernaz, Fearnside, Vasconcelos, and Ferreira (Citation2004) pointed out that infrastructure development projects are significant contributors to deforestation in the Brazilian Amazon, which have caused numerous complex problems to social–ecological systems (Cumming, Southworth, Rondon, & Marsik, Citation2012). In forest landscapes, like the Amazonian rainforest, a new and pervasive spatial pattern has been created by road paving (Riitters & Wickham, Citation2003) and then been enhanced by the expansion of human settlements. The road paving encourages economic development via regional integrations, such as facilitating ties of remote areas to local and regional markets (van de Walle, Citation2002) and expands previously inaccessible and intact rainforest to these more developed regions. To access the natural resources, the paving of major roads stimulates the construction of secondary and tertiary level roads, often temporary logging roads which continue to be used well after their initial creation and often become permanent landscape features (Perz, Overdevest, Arima, Caldas, & Walker, 2007a, 2007b), and these roads form dense and hierarchical networks where the land cover changes along them exhibit some recursive structures, such as the fishbone pattern.
For years, economic, social, and ecological research has drawn contrasting conclusions about the consequences of such new patterns created by road paving (Perz et al., Citation2012). Road paving and its consequences are notorious for intensifying social conflicts over newly accessible natural resources (Hall, Citation1989; Perz et al., Citation2012; Schmink & Wood, Citation1992). For example, lack of participation raises issues of exclusion of indigenous and other minority groups, often whereby newcomers make legalistic claims to natural resources in order to discredit traditional claims (Perz et al., Citation2012; Walker et al., Citation2009). However, both macroeconomic and microeconomic literature demonstrate the positive impacts of road paving on the economy, specifically empirical studies show significant poverty reduction near roads, whether via analysis of sub-national administrative units (Demurger, Citation2001; Fan, Zhang, & Zhang, Citation2004; Walker et al., Citation2009), local communities (Gunasekera, Anderson, & Lakshmanan, Citation2008), or individual households (Gibson & Rozelle, Citation2003). On the other hand, there are significant ecological changes which can occur as both road networks and developed areas fragment a continuous forest into discrete habitats and thereby reduce landscape connectivity (Estrada & Bodin, Citation2008). Connectivity is a vital element of landscape structure (Taylor, Fahrig, Henein, & Merriam, Citation1993), and one to which the persistence of spatially structured species populations, and meta-populations, is strongly related (Hanski & Ovaskainen, Citation2003). Lack of connectivity reduces the capability of species movement (i.e. local extinctions of certain species could not be compensated by the immigrant population from the neighbor patches) and interferes with pollination, seed dispersal, wildlife migration, and breeding (Estreguil & Mouton, Citation2009). As such, via road networks, the impacts of social conflicts, economic benefits, and ecological damages extend from a small-scale region (cleared area) to an entire forest landscape. Emerging from the ‘clearing’ site and then distributing outward in a radiative way, such impacts can be described like a ‘halo’ (Wade, Wickham, Zaccarelli, & Riitters, Citation2009), that is, the pattern and process of deforestation are not restricted to those cleared areas but rather they exhibit influences beyond the clearings physical boundaries. This is key in land change research, where many studies of landscape fragmentation focus on discrete land cover classes and do not always consider the impacts of land cover on the areas around it. Here, by focusing on the sites of deforestation and their halo-like impact outwards from these sites, hopefully, a more complete understanding of the deforestation landscape can be created. As such, a multiple scale analysis that includes larger surrounding areas beyond just the clearings themselves becomes a key factor to better understand the entire landscape, and so link this resultant, human-impacted forest landscape, back to the larger social–ecological systems in which the deforestation occurred.
One approach to understanding such ‘halo’ impacts is based on the patch–corridor–matrix model (Forman, Citation1995) that simplifies the landscape structure as a network with individual patches connected by corridors (Hanski, Citation1999; Opdam, Citation2002). Thus, a landscape can be described as an area of land containing a mosaic of habitat patches, often within which a particular focus habitat patch is embedded (Dunning, Danielson, & Pulliam, Citation1992). Zaccarelli, Riitters, Petrosillo, and Zurlini (Citation2008) discussed and applied the dualism phrase ‘content and context’ to explain the multiple scale analysis with a conservation example in Apulia, Italy. Specifically, they explained the ‘contents’ of the network by descriptions of patches and corridors within the boundaries of the conservation area, where each area is assumed to be spatially homogeneous according to the corresponding descriptions. In contrast, the ‘context’ of conservation areas refers to the nature of the surrounding landscapes that may exhibit significant impacts on interiors within the conservation boundaries (Wiens, Citation2002). At a landscape level, the context can be taken as the buffer zone around a target area, which exhibits either negative or positive impacts on the content, as different land uses and land covers may promote or block ecological function and services, such as population migration (Hansen & Rotella, Citation2002). To further illustrate the interactions between the content and context, Riitters, Wickham, and Wade (Citation2009) proposed a ‘forest security’ concept to interpret forest dynamics at a pixel level and defined the forest security as the likelihood that a pixel of forest remains as forest over time, which depends on the surrounding landscape mosaic. The security level of context that surrounds the content is not uniformly distributed; in fact, the security level declines when the distance to the content increases. During the expansion process of developed areas, the interfaces between forest areas and non-forest areas, e.g. forest edges, become sensitive areas that usually have a high likelihood to be converted into non-forest. Such interface was not emphasized in the classic landscape analysis before (Cumming et al., Citation2012), but it has been estimated that the amount of Amazonian rainforest modified by the forest edge exceeded the area that had been cleared (Skole & Tucker, Citation1993). As such, content, context, interface (i.e. forest edge), and forest security levels should become important considerations in any multi-scale analysis of deforested landscapes.
Landscapes do not exist in isolation. Landscapes nest in a panarchic structure (Gunderson & Holling Citation2001; Zurlini et al., Citation2006), that is, focus landscapes embed within larger landscapes that embed within even larger landscapes, and so on. This panarchic representation makes the multiple spatial scales analysis imperative for thinking through structure, function, and dynamics of deforested landscapes (Riitters, Wickham, O’Neil, Jones, & Smith, Citation2000, Citation2002; Wu & Qi, Citation2000; Zaccarelli et al., Citation2008; Zurlini et al., Citation2006). In answering such a requirement, moving window operations provide a useful technique to derive multi-scale information in landscape research (e.g. Riitters et al., Citation2000, Citation2002; Southworth, Cumming, Marsik, & Binford, Citation2006; Wade et al., Citation2009; Zaccarelli et al., Citation2008; Zurlini et al., Citation2006), which would be able to appreciate and then link the local pattern and process of deforestation to the regional ‘halo’ impacts that occur beyond the boundaries of extant cleared areas.
In this paper, we will apply a moving window approach to understand the ‘halo’ impacts of deforestation around a tri-national frontier in Brazil, Bolivia, and Peru, where extensive road development and paving have been occurring. Specifically the three regions exhibit a pathway of development from most developed (Brazil), to developing (Peru), and currently much less developed (Bolivia). This therefore provides an ideal study area, respecting a gradient of development, for an examination of the ‘halo’ impacts linked to the drivers of road development, and road paving.
2. Data and methodology
2.1. Study area
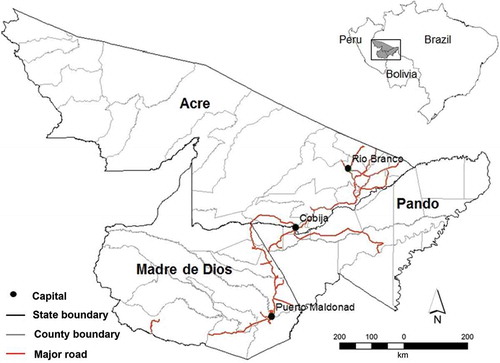
The study area is a tri-national frontier in the southwestern Amazon, where the Peruvian state Madre de Dios, Acre in Brazil, and the Bolivian department of Pando meet (termed the ‘MAP’ region, ). This tri-national frontier was historically covered by humid tropical forest, and is currently about 90% forested. MAP is a relatively remote area in all three countries, and is characterized by a combination of rich natural resources and low incomes. The construction of the Inter-Oceanic highway connects central Brazil with the Pacific ports in Peru and, in many ways, symbolizes the end of the relative isolation of this part of the Amazon. Road paving is likely to bring rapid changes in land use and livelihoods, with the potential prospect of substantial forest and biodiversity loss, changes in land tenure, and unsustainable livelihoods. Specifically, forest fragmentation occurs along the road and will probably continue expanding, and previously described fragmentation patterns can influence many processes that are ecologically important (see Turner, Citation1989).
Figure 1. Map of the MAP region with major roads superimposed. This region encompasses the tri-national frontier regions of the Peruvian state of Madre de Dios (capital city, Puerto Maldonado), the Brazilian state of Acre (capital city, Rio Branco), and the Department of Pando (capital city, Cobija), Bolivia.
2.2. Remote sensing analysis of forest cover change
In the MAP region where deforestation is expanding quickly, it is prohibitive in terms of both time and money, to collect timely and accurate information of forest cover dynamics if done by fieldwork alone. Time-series of classified satellite images can reflect the change trajectories of forest cover, forest area, and their associated fragmentation patterns (Qin, Niu, Chen, Li, & Ban, Citation2013; Tole, Citation2006). We generate single-layered binary deforestation maps with 30 m resolution from Landsat TM 4, 5 and ETM+ 7 images from the same season, across six time periods (about 5-year intervals), with less than 10% cloud cover (May to October 1986–1991–1996–2000–2005–2010, corresponding to the dry season that permits minimal cloud cover and lower aerosol concentrations). For each image, we performed image registration, calibration, and atmospheric corrections and undertook a decision tree supervised classification (see Marsik et al., Citation2011; Southworth et al., Citation2011 for details). Due to the similarity of spectral signatures, some transitional woodlands and agro-forestry areas are difficult to distinguish and therefore were classified as forest. Agriculture, cleared areas, major roads, urban fabrics, and shrub were aggregated to create a non-forest class (see forest/non-forest cover maps from 1986 to 2010 in ). We assessed the classification accuracy using over 350 training samples collected during fieldwork from 2005 to 2006 and kappa coefficient and overall percent accuracy for each class (forest class and non-forest class) and for the overall classification, with resulting accuracies for 2005 exceed 90%. As we do not have the field data for the 2000 classified mosaic, temporally and spatially coincident Advanced Spaceborne Thermal Emission and Reflection Radiometer (ASTER) images were used as an independent data source for additional accuracy assessment. Training samples were classified forest and non-forest based on image interpretation, and an overall accuracy of 96% was achieved across our products. Additionally, the 2010 classified image was checked by GoogleEarth with an overall accuracy of 95% across the MAP region.
Figure 2. Forest/non-forest maps showing fragmentation dynamics in the MAP region for the year of (a) 1986, (b) 1991, (c) 1996, (d) 2000, (e) 2005, and (f) 2010, interpreted from eight Landsat imageries (path/row: 1/67, 1/68, 2/67, 2/68, 2/69, 3/67, 3/68, 3/69).
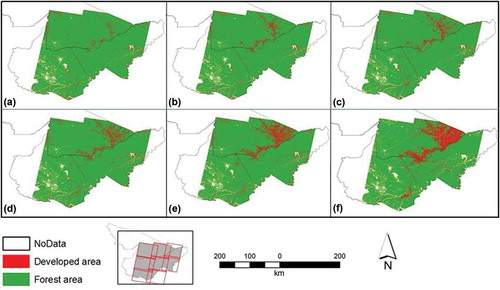
With relatively uniform temporal interval and fine spatial resolution, these time-series forest/non-forest cover maps () would be able to reflect the change trajectories of forest covers, forest areas, fragmentation patterns (Tole, Citation2006), and other forest landscape properties.
2.3. The moving window operation at multiple scales
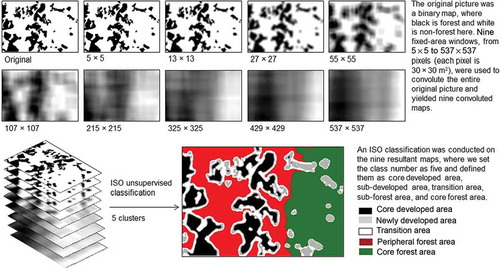
Advancements in satellite technology combined with mathematical and/or spatial statistical methods have been widely used in landscape ecology (e.g. Sun, Citation2013; Zaccarelli et al., Citation2008). To measure the ‘halo’ impacts on forest/non-forest binary maps from 1986 to 2010, we used a moving window algorithm to locate a set of nine fixed-area windows around each pixel. The window sizes are 0.15, 0.39, 0.81, 1.65, 3.21, 6.45, 9.75, 12.87, and 16.11 km on a side, where the window side lengths spans two orders of magnitude (from 0.15 to 16.11 km) to ensure, as best as possible, accurate estimates of the scale-dependent behavior of percentage fragmentation following Wade et al. (Citation2009) work. We measured the amount of fragmentation within each window by the proportion of non-forest pixels (Pn) on each binary map, and then produced a stack of these raster layers, where each raster was the specific output for a certain window size. Next, we performed the ISO clustering algorithm (also known as the migrating means technique) to run a clustering analysis according to the similarity of Pn values over all nine window sizes, where ISO is an abbreviation for the iterative self-organizing way of performing clustering (Zaccarelli et al., Citation2008; Zurlini et al., Citation2006). The ISO Cluster algorithm is an iterative process for computing the minimum Euclidean distance when assigning each candidate cell to a cluster. The process starts with arbitrary means being assigned by the software (ESRI ArcGIS 10.0, Redlands, CA, USA), one for each cluster. The number of clusters is usually unknown, so it is suggested to test many times in order to reach an optimal number of clusters. Specifically, cluster centers are randomly placed and pixels are assigned based on the shortest distance to center. The standard deviation with each cluster and the distance between cluster centers is calculated. A second iteration is performed with the new cluster centers, and so on, with further iterations performed until the number of iterations is large enough to ensure that, after running the specified number of iterations, the migration of cells from one cluster to another is minimal, and thus all the clusters become stable.
Corresponding to the previous discussion of the content, context, forest edge, and forest security level, we defined five clusters in this research: core forest area, peripheral forest area, transition area, newly developed area, and core developed area. For the forest areas (content), the security level of the core forest area is the highest and then the security level decreases from the peripheral forest area to the most insecure level, which is the transition area. Meanwhile, we can interpret cleared areas (context) using a similar gradient level: the core developed area where forest clearing is permanent, and then the newly developed area where the forest clearing is new, and again the transition area where the forest clearing is most likely underway. As such, the ‘halo’ impacts of deforestation start from the core developed area, spread over the newly developed area, via the transition area, and finally reach the peripheral forest area (see for a detailed illustration of the method described). To validate this classification framework for the real world landscape, we will implement this moving window operation to study deforestation dynamics in the MAP region from 1986 to 2010. Primarily due to deforestation caused by road paving, the three sides of the MAP region display different development levels, from the most developed area (Acre) to the currently developing area (Madre de Dios) and then to the relatively less developed area (Pando), so the method proposed here provides a framework to unify and to understand such heterogeneous deforested landscape across the MAP region.
Figure 3. A hypothesized landscape (spatial resolution, 30 m) was convoluted by nine different filters, ranging from 5 × 5 to 537 × 537 pixels, and these such nine filtered maps were then stacked to produce a multi-band layer stack image and to then run an ISO classification with user-defined cluster numbers (five clusters here from c1 to c5).
3. Results
3.1. Forest cover change
From 1986 to 2010, we observed an increase in non-forest area for all three states (Acre, Madre de Dios, and Pando), at the expense of forest areas. Across all three regions, the forest is still dominant and the landscape is quite static, such that, in 2010, the forest cover percentage is 80.0% in Acre, 97.4% in Madre de Dios, and 98.0% in Pando (). Correspondingly, the percentage area of the non-forest area is relatively small, with Acre at 20.0%, Madre de Dios at 2.6%, and Pando at 2.0%; however, the impacts of the non-forest areas are not just restricted to these small areas, as mentioned above, and therefore, new approaches are needed to reveal such ‘halo’ impacts. As such, the ‘halo’ analysis described here can then be evaluated as an improved method compared with the traditional deforestation analysis, that is, as opposed to just being described by more static forest/non-forest classes, as given in .
Table 1. Summary of forest and non-forest areas from 1986 to 2010 in the MAP region*.
3.2. ‘Halo’ analysis
To represent the ‘halo’ impacts at multiple spatial scales, the results of the ISO clustering analysis are summarized in and . Visually, the ‘halo’ impacts of the cleared areas in the MAP region (core developed area, newly developed area, transition area, and peripheral forest area) expand rapidly from 1986 to 2010, and the developed areas increase substantially among them. In Acre, the core developed area increases from 1.7% in 1986 to 13.3% in 2010 (where 1% in Acre represents 622.8 km2), which may signal the beginning or initialization of the opening up (urbanization) of this predominantly forested landscape. Subsequently, its impacts spread over the surrounding classes, where the newly developed area increases from 3.0% in 1986 to 6.7% in 2010. In addition, the transition area has a slight increase from 4.3% in 1986 to 6.7% in 2010; since this interface area usually has elevated temperature, reduced humidity, and increased wind speed relative to forest interiors (Cumming et al., Citation2012) the expansion of this area would bring many uncertain factors to the forest system. The peripheral forest area decreased from 16.0% in 1986 to 14.7% in 2010 and the core forest area changes from 75.0% in 1986 to 58.6% in 2010. In Pando, the core developed area increases from 0.2% in 1986 to 2.0% in 2010 and the newly developed area changes from 0.4% in 1986 to 2.5% in 2010 (where 1% in Pando represents 542.9 km2), and the small percentage of these two non-forest clusters (4.5%) until 2010 characterizes the less-developed situation in Pando. However, there is a re-allocation of the forest area among the three clusters, where both the transition area (0.6% in 1986 to 3.3% in 2010) and the peripheral forest area (5.5% in 1986 to 18.5% in 2010) increase significantly, while the core forest area decreases from 93.3% in 1986 to 73.7% in 2010. Though the total forest area (transition, peripheral forest, core forest) is still large in 2010 (95.5%), there is a large part of the forest area transformed from stable core forest to the unstable clusters: transition and peripheral forest. On the other hand, Madre de Dios experienced a reforestation–deforestation process during the past 25 years, and therefore, the percentage area of the core forest starts to increase from 78.6% in 1986, reaches the peak at 87.0% in 1996, and finally decreases to 75.7% in 2010. Consequently, the other four clusters, core developed, newly developed, transition and peripheral forest, have a U-shape change from 1986 to 2010. The use of these more detailed ‘halo’ analyses reveals significant landscape changes in forest cover across these regions (as illustrated in ) that if studied in a more traditional or static analysis (as is represented by the results presented in ) is completely obscured.
Figure 4. The results of the ISO clustering analysis in the MAP region from 1986 to 2010, using the migrating means clustering algorithm (also known as the ISO cluster) which is based on the similarity of Pn (fragmentation proportion) within nine window sizes. (a) 1986, (b) 1991, (c) 1996, (d) 2000, (e) 2005, and (f) 2010.
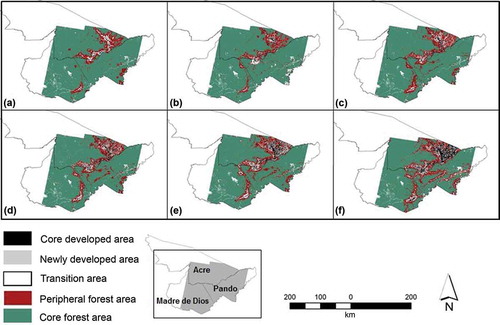
Table 2. Summary of ISO cluster analysis in percentage from 1986 to 2010 in the MAP region*.
3.3. Deforestation profiles across multiple spatial scales
For the three states in the MAP region, the profiles of the five cluster means along multiple window sizes were depicted (–). For a given location, the profile of Pn with different window sizes fluctuates with respect to the deforestation at that location across different spatial lags. For example, a small window with high Pn embedded within a large window with low Pn implies a locally intensive deforestation (content) nested in a larger region with less forest loss (context). Therefore, the resultant profiles describe deforestation dynamics from local to regional scale (here, from 0.0225 to 259.5321 km2) and could therefore be incorporated into conservation programs to monitor system dynamics across multiple spatial scales.
Figure 5. The profiles of ISO cluster means along multiple window sizes in Acre, Brazil, from 1986 to 2010. X-axis is the side length of different windows (unit, km) and Y-axis is Pn (fragmentation proportion within each window). (a) 1986, (b) 1991, (c) 1996, (d) 2000, (e) 2005, and (f) 2010.
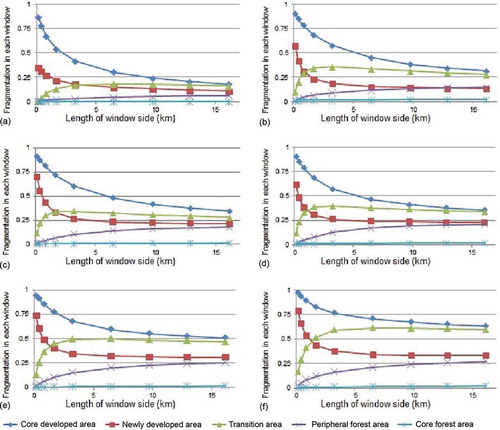
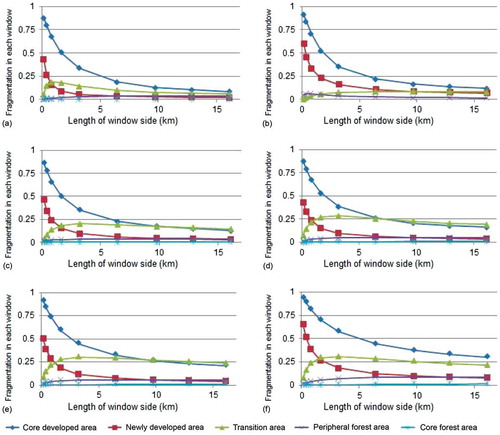
In –, the asymptotic behaviors of the five clusters of all three states suggest the scale-dependent pattern of percentage developed areas were adequately described with the multiple window sizes used, ranging two magnitudes from 0.2 to 16.1 km. Though the exact cluster means are not exactly the same, the relative trend of these profiles behaved similarly. The core developed areas typically have higher densities at local scales (small windows) and then decrease as the window size increases, so do the newly developed areas. Both the core forest areas and the peripheral forest areas have the converse pattern, that is, their densities increase with window size increases, where the peripheral forest areas increase more rapidly than the core forest areas. The transition areas have an interesting profile, the densities increase quickly at relatively small window sizes and then maintain at a relatively stable state. In sum, the profiles described characterize the fact that intensive fragmentation occurs locally in the MAP region, while a large part of this region is still covered by forest.
Figure 6. The profiles of ISO cluster means along multiple window sizes in Pando, Boliva, from 1986 to 2010. X-axis is the side length of different windows (unit, km) and Y-axis is Pn (fragmentation proportion within each window). (a) 1986, (b) 1991, (c) 1996, (d) 2000, (e) 2005, and (f) 2010.
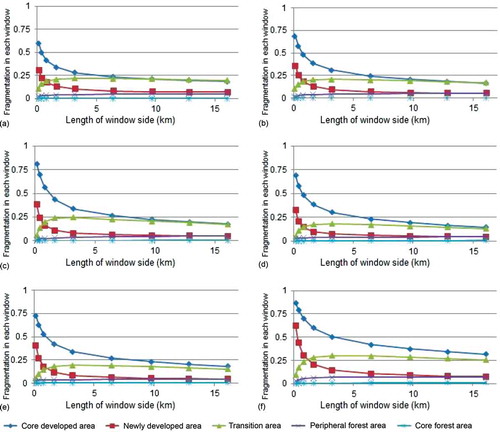
Figure 7. The profiles of ISO cluster means along multiple window sizes in Madre de Dios, Peru, from 1986 to 2010. X-axis is the side length of different windows (unit, km) and Y-axis is Pn (fragmentation proportion within each window). (a) 1986, (b) 1991, (c) 1996, (d) 2000, (e) 2005, and (f) 2010.
3.4. Focus area study: Rio Branco
To carefully examine the ‘halo’ impacts of deforestation, a region around Rio Branco, the capital city of Acre, was subset as an illustration (). Rio Branco was one of the first settlements to appear on the banks of the Acre River and has become the administrative center of the economic and cultural region. According to , the non-forest area increases from 4.7% in 1986 to 34.8% in 2010 (where 1% in Acre represents 622.8 km2) and consequently, the forest area shrinks from 95.3% in 1986 to 65.2% in 2010, where 65.2% is close to a critical percolation threshold of 59.3% (a four-neighbor rule) as proposed by Gardner (Citation1999) with any value below this threshold represents an evident loss of landscape connectivity.
Figure 8. The results of the ISO clustering analysis around Rio Branco, Capital of Acre, Brazil, from 1986 to 2010, using the migrating means clustering algorithm (also known as the ISO cluster) which is based on the similarity of Pn (fragmentation proportion) within 9 window sizes. (a) 1986, (b) 1991, (c) 1996, (d) 2000, (e) 2005, and (f) 2010.
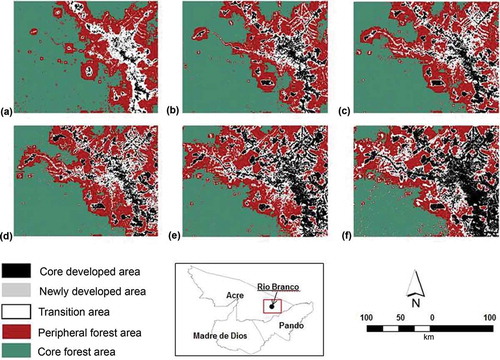
Table 3. Summary of forest/non-forest areas from 1986 to 2010 around Rio Branco, Acre*.
According to the definition of the US census, urbanized areas are defined as densely settled territories that contain 50,000 or more people. The most recent demographic census reported that the population in Rio Branco was 305,954 in 2009 (Brazilian Institute of Geography and Statistics). As such, the increase in the core developed area around Rio Branco (), including major towns and small settlements, can be re-defined as urban expansion which accounted for only 3.3% of the focus area in 1986 and increased significantly to 24.6% in 2010. Complementarily, the core forest area decreases monotonically from 56.6% to 27.6%, also signaling a rapid clearing during this period. The impacts of urban expansion, including newly developed areas (i.e. suburbanization area), transition areas, and peripheral forest areas, grow from 40.1% in 1986 (5.6% + 8.8% + 25.7% = 40.1%) to 47.8% in 2010 (12.2% + 11.1% + 24.5% = 47.8%). The ‘halo’ impacts stretch over large areas that are almost twice that of the actual urban fabric and this confirms that urbanization exhibits strong influences beyond the extent of its boundaries, indicating that very little of the Rio Branco area is entirely free of urban influence when spatial context, gradient, and lag distance are included in the analysis, and thus this improved across-scale analysis can be seen as a more complete analysis tool, when compared to the traditional methods that present forest/non-forest only. These results should be useful for many land-use planning applications, and for improved future planning and zoning of these impacted regions.
Table 4. Summary of ISO cluster analysis in percentage from 1986 to 2010 around Rio Branco, Acre*.
4. Discussion
Scalable window analysis is a widely used technique in forest fragmentation analyses, as users can define various convolution kernels to capture composition and configuration information as needed (e.g. Riitters et al., Citation2000, Citation2002). Convolution kernels have regular geometric shapes, such as rectangle, circle, hexagon, while fragmented areas or patches in the landscape are not regular, and such mismatch between the boundary of window and target object may limit the applications. To address this boundary problem, morphological spatial pattern analysis (MSPA) was proposed to map forest morphology, such as corridors, scale pattern, and connectivity (Soille, Citation2003; Sun & Southworth, Citation2013; Vogt et al., Citation2007). Specifically, MSPA is used to solve the problem of ambiguity between forest exterior boundary (edge) and interior fragmentation boundary (perforation), and therefore, as a pixel-level analysis MSPA can be used as a complementary reference of the window analysis that prompts the understanding of deforestation and its related problems. Meanwhile, compared with a more traditional buffer analysis (e.g. Southworth et al., Citation2011) which focuses on the relationship between deforested areas and the distance to roads, the method conducted here scans the entire study region on multiple spatial scales, so providing a relatively completed understanding of the deforested landscape.
There is no single correct scale or level at which to describe a system, nor does that mean all scales serve equally well (Levin, Citation1992). In the spatial domain, grain and extent are inversely correlated, where the detailed information at a fine grain resolution would be inevitably sacrificed at large scales. A heterogeneous landscape at a relatively small scale may become homogeneous at a large scale, and vice versa. The moving window technique with different window sizes provides an approach to describe such ‘across scales’ information; however, various spatial patterns analyzed from multiple window sizes may lead to different statistical relationships that are not able to provide consistent references. To overcome such problems, the unsupervised ISO algorithm was used here to integrate various spatial patterns analyzed from different window sizes and then expresses such information by profiles ranging from local to regional scales, as such, this integrated ‘across scale’ analysis by ISO algorithm helps reveal the phenomena under study or the process behind it over an appropriate range of scales. In this paper, the smallest scale of the profile is 0.15 km and such fine resolution would be able to provide a practical guide for conservation programs, and the largest scale of the profile is 16.11 km, where the spatial patterns analyzed by such large windows provides an understanding of deforestation at a regional level. Additional window sizes can be added to calculate the information at higher levels, and the largest size should be less than the entire landscape.
In recent decades, initialized by the road paving and then enhanced by the urbanization, forest landscapes in the MAP region have been largely affected by rapid land cover change, such that with respect to many social and ecological concerns, the mapping and interpretation of forest cover changes are needed. However, due to spatial autocorrelation (or Tobler’s first law of Geography, i.e. things close together in space are more likely to be similar), the forest security of the deforested landscape is not uniformly distributed, but rather, exhibits a gradient that decreases from the interior forest to the interface between forest areas and cleared areas. Such gradients make ‘halo’ mapping necessary to complement the traditional forest/non-forest mapping. The ‘halo’ impact is derived from the composition of forest within the moving window and has actually been used as a pattern (configuration) indicator in the paper. Based on such indicators, the five calculated clusters can be used to characterize the complex interaction between forest and non-forest. The increase in the core developed area represents the need to satisfy the growth of urban populations, and the increase in the newly developed area is used to accommodate more urban populations or is being modified to create more agricultural area to feed the larger numbers of people. Both the core developed and the newly developed areas are closely related to urban growth, and to their associated social and economic developments. The transition area is the most unstable cluster identified, as for the most part either deforestation or reforestation would be occurring here. It is the buffer zone between forest and developed areas that delineates forest landscape, and this is where fire, invasive species, and new infrastructure occur intensively. As such the transition area becomes a hot spot that should be considered as an ideal area to carefully monitor and to measure biodiversity loss and/or urban sprawl. The peripheral forest area is the least affected cluster by the ‘halo’ impacts of the developed area, and its change could indicate a very early signal of either deforestation or reforestation. Finally, the core forest represents the most stable forest distribution and therefore any substantial reduction of this cluster would signal a fundamental transition of the forest area as well as the entire forest system.
The accumulated time-series forest cover maps from 1986 to 2010 (Cumming et al., Citation2005, Citation2012; Cumming, Barnes, & Southworth, Citation2008; Marsik et al., Citation2011; Southworth et al., Citation2011) reveal that the MAP region is still largely forested, but a fundamental shift in forest landscape is underway among the three regions based on this ‘halo’ mapping analysis. During 1986–2010, the entire MAP region was undergoing a rapid deforestation process, while these processes occurred locally and the MAP region was still largely forested according to . The fluctuation of these five clusters along both spatial and temporal scales reflects different development levels among the three sides of the MAP region (Acre is the most developed area, then Madre de Dios, while Pando is less developed), thus requiring policy regulation to be adaptive to different clusters and to different sides and be flexible for their evolving properties, as well as acting in a timely manner. Deploying richer information than traditional forest/non-forest binary maps, the results of this analysis provide clear references to conservation programs and managers, for example, highlighting areas of the critical transition zones where conservation efforts could be seen to have a significant impact. Moreover, economic and social developments in the MAP region can benefit from this analysis as it potentially affords a simple location division to future urban planning. Hence, such mapping may have an influence in either ecological conservation or economic development, depending on government policies, either addressing sustainable environment or economic growth, or ideally it could be used to mitigate the impacts of development across such a key landscape and region.
The analysis of the ‘halo’ impact of deforestation is based on the combination of GIS/remote sensing techniques and spatial statistics, and such integration would be useful to provide a framework to study the influences of land use and land cover problems that are not restricted by visible borders. The method used here is applicable and has been verified by a deforested example in the Amazon, and hence, such a simple framework could be widely adopted to implement the automatic classification of deforested landscapes, as well be used to monitor and address forest/urban regulation and sustainability. Specifically, areas of likely future development or key transition zones can be highlighted and protections set in place to help conserve these critical landscapes. Most importantly, these analyses provide a more realistic representation of the landscape being impacted, e.g. by deforestation, and its implications across the larger region. Such representations make it very clear that deforestation area is one part of the calculation, but its influence is much greater than this and the process of deforestation does indeed sweep, often ‘halo’ like, across a region over time. These more realistic landscape maps are better tools for management and planning than deforestation maps alone, and better represent the ‘process’ of deforestation and its wider impacts, rather than just the ‘snapshot’ of the single-date land cover map.
Acknowledgements
This research was funded as part of an NSF Human and Social Dynamics Program (FY2005) project, entitled ‘Agents of Change: Infrastructure Change, Human Agency, and Resilience in Social–Ecological Systems’ #0527511 and also from NSF Coupled Natural Human Systems # 1114924, ‘Global sensitivity and uncertainty analysis in the evaluation of social–ecological resilience: Theoretical debates over infrastructure impacts on livelihoods and forest change’.
References
- Andersen, L. E., Granger, C. W. J., Reis, E. J., Weinhold, D., & Wunder, S. (2002). The dynamics of deforestation and economic development in the Brazilian Amazon. Cambridge: Cambridge University Press.
- Cumming, G., Barnes, G., Perz, S., Schmink, M., Sieving, K., Southworth, J., … Van Holt, T. (2005). An exploratory framework for the empirical measurement of resilience. Ecosystems, 8, 975–987.
- Cumming, G. S., Barnes, G., & Southworth, J. (2008). Environmental asymmetries. In J. Norberg and G. S. Cumming (Eds.), Complexity theory for a sustainable future (pp. 15–45). New York, NY: Columbia University Press.
- Cumming, G. S., Southworth, J., Rondon, X. J., & Marsik, M. (2012). Spatial complexity in fragmenting Amazonian rainforests: Do feedbacks from edge effects push forests towards an ecological threshold? Ecological Complexity, 11, 67–74.
- Demurger, S. (2001). Infrastructure and economic growth: An explanation for regional disparities in China? Journal of Comparative Economics, 29, 95–117.
- Dunning, J. B., Danielson, B. J., & Pulliam, H. R. (1992). Ecological processes that affect populations in complex landscapes. Oikos, 65, 169–175.
- Dwivedi, R. S., Sreenivas, K., & Ramana, K. V. (2005). Cover: Land‐use/land‐cover change analysis in part of Ethiopia using Landsat thematic mapper data. International Journal of Remote Sensing, 26, 1285–1287.
- Estrada, E., & Bodin, O. (2008). Using network centrality measures to manage landscape connectivity. Ecological Applications, 18, 1810–1825.
- Estreguil, C., & Mouton, C. (2009), Measuring and reporting on forest landscape pattern, fragmentation and connectivity in Europe: Methods and indicators. Joint Research Centre, European Communities, Scientific and Technical Research Series, 69 – EUR 23841EN; ISSN 1018–5593.
- Fan, S., Zhang, L., & Zhang, X. (2004). Reform, investment, and poverty in China. Economic Development and Cultural Change, 52, 395–421.
- Forman, R. T. T. (1995). Some general principles of landscape and regional ecology. Landscape Ecology, 10, 133–142.
- Gardner, R. (1999). RULE: A program for the generation of random maps and the analysis of spatial patterns. In J. M. Klopatek & R. H. Gardner (Eds.), Landscape ecological analysis: Issues and applications (pp. 280–303). New York, NY: Springer-Verlag.
- Gibson, J., & Rozelle, S. (2003). Poverty and access to roads in Papua New Guinea. Economic Development and Cultural Change, 52, 159–185.
- Giles, P. T., & Burgoyne, J. M. (2008). Skole, D.L. and Tucker, C.J. 1993: Tropical deforestation and habitat fragmentation in the Amazon: Satellite data from 1978 to 1988, Science, 260, 1905–1910. Progress in Physical Geography, 32, 575–580.
- Gunasekera, K., Anderson, W., & Lakshmanan, T. R. (2008). Highway-induced development: Evidence from Sri Lanka. World Development, 36, 2371–2389.
- Gunderson, L. H., & Holling, C. S. (2001). Panarchy: Understanding transformations in human and natural systems (1st ed.). Washington, DC: Island Press.
- Hall, A. L. (1989). Developing Amazonia: Deforestation and social Conflict in Brazil’s Carajás programme. Manchester: Manchester University Press.
- Hansen, A. J., & Rotella, J. J. (2002). Biophysical factors, land use, and species viability in and around nature reserves. Conservation Biology, 16, 1–12.
- Hanski, I. (1999). Metapopulation ecology. Oxford: Oxford University Press.
- Hanski, I., & Ovaskainen, O. (2003). Metapopulation theory for fragmented landscapes. Theoretical Population Biology, 64, 119–127.
- Laurance, W. F., Albernaz, A. K., Fearnside, P. M., Vasconcelos, H. L., & Ferreira, L. V. (2004). Letters to the editor: Deforestation in Amazonia. Science, 304, 21.
- Levin, S. A. (1992). Orchestrating environmental research assessment. Ecological Applications, 2, 103–106.
- Marsik, M., Stevens, F., & Southworth, J. (2011). Amazon deforestation: Rates and patterns of land cover change and fragmentation in Pando, northern Bolivia, 1986 to 2005. Progress in Physical Geography, 35, 353–374.
- Mas, J.-F., Velázquez, A., Díaz-Gallegos, J. R., Mayorga-Saucedo, R., Alcántara, C., Bocco, G., … Pérez-Vega, A. (2004). Assessing land use/cover changes: A nationwide multidate spatial database for Mexico. International Journal of Applied Earth Observation and Geoinformation, 5, 249–261.
- Nepstad, D., Carvalho, G., Cristina Barros, A., Alencar, A., Paulo Capobianco, J., Bishop, J., … Prins, E. (2001). Road paving, fire regime feedbacks, and the future of Amazon forests. Forest Ecology and Management, 154, 395–407.
- Nepstad, D. C., Verssimo, A., Alencar, A., Nobre, C., Lima, E., Lefebvre, P., … Brooks, V. (1999). Large-scale improverishment of Amazonian forests by logging and fire. Nature, 398, 505–508.
- Opdam, P. (2002). Assessing the conservation potential of habitat networks. In K. Gutzwiller & T. T. Forman (Eds.), Applying landscape ecology in biological conservation (pp. 381–404). New York, NY: Springer-Verlag.
- Perz, S. G., Caldas, M. M., Arima, E., & Walker, R. J. (2007). Socio-spatial process of unofficial road building in the Amazon: Socioeconomic and biophysical explanations. Development and Change, 38, 529–551.
- Perz, S. G., Overdevest, C., Arima, E. Y., Caldas, M. M., & Walker, R. J. (2007). Unofficial road building in the Brazilian Amazon: Dilemmas and models of road governance. Environmental Conservation, 34, 112–121.
- Perz, S. G., Shenkin, A., Barnes, G., Cabrera, L., Carvalho, L. A., & Castillo, J. (2012). Connectivity and resilience: A multidimensional analysis of infrastructure impacts in the southwestern amazon. Social Indicators Research, 106, 259–285.
- Qin, Y., Niu, Z., Chen, F., Li, B., & Ban, Y. (2013). Object-based land cover change detection for cross-sensor images. International Journal of Remote Sensing, 34, 6723–6737.
- Reis, S. (2008). Analyzing land use/land cover changes using remote sensing and GIS in Rize, North-East Turkey. Sensors, 8, 6188–6202.
- Riitters, K. H., & Wickham, J. D. (2003). How far to the nearest road? Frontiers in Ecology and the Environment, 1, 125–129.
- Riitters, K. H., Wickham, J. D., O’Neil, R., Jones, B., & Smith, E. (2000). Global-scale patterns of forest fragmentation. Conservation Ecology, 4, 3.
- Riitters, K. H., Wickham, J. D., O’Neill, R. V., Jones, K. B., Smith, E. R., Coulston, J. W., … Smith, J. H. (2002). Fragmentation of continental United States forests. Ecosystems, 5, 815–822.
- Riitters, K. H., Wickham, J. D., & Wade, T. G. (2009). An indicator of forest dynamics using a shifting landscape mosaic. Ecological Indicators, 9, 107–117.
- Schmink, M., & Wood, C. H. (1992). Contested frontiers in Amazonia. New York, NY: Columbia University Press.
- Skole, D., & Tucker, C. (1993). Tropical deforestation and habitat fragmentation in the amazon: Satellite data from 1978 to 1988. Science, 260, 1905–1910.
- Soille, P. (2003). Morphological image analysis: Principles and applications (2nd ed.). Berlin: Springer-Verlag.
- Southworth, J., Cumming, G. S., Marsik, M., & Binford, M. W. (2006). Linking spatial and temporal variation at multiple scales in a heterogeneous landscape. The Professional Geographer, 58, 406–420.
- Southworth, J., Marsik, M., Qiu, Y., Perz, S., Cumming, G., Stevens, F., … Barnes, G. (2011). Roads as drivers of change: Trajectories across the tri-national frontier in MAP, the southwestern Amazon. Remote Sensing, 3, 1047–1066.
- Sun, J. (2013). Exploring edge complexity in remote sensing vegetation index imageries. Journal of Land Use Science. http://dx.doi:10.1080/1747423X.2012.756071
- Sun, J., Huang, Z., Southworth, J., & Qiu, Y. (2013). Mapping fractality during the process of deforestation in an Amazon tri-national frontier. Remote Sensing Letters, 4, 589–598.
- Sun, J., & Southworth, J. (2013). Indicating structural connectivity in Amazonian rainforests from 1986 to 2010 using morphological image processing analysis. International Journal of Remote Sensing, 34, 5187–5200.
- Taylor, P. D., Fahrig, L., Henein, K., & Merriam, G. (1993). Connectivity is a vital element of landscape structure. Oikos, 68, 571–573.
- Tole, L. (2006). Measurement and management of human-induced patterns of forest fragmentation: A case study. Environmental Management, 37, 788–801.
- Turner, M. G. (1989). Landscape ecology: The effect of pattern on process. Annual Review of Ecology and Systematics, 20, 171–197.
- van de Walle, D. (2002). Choosing rural road investments to help reduce poverty. World Development, 30, 575–589.
- Vogt, P., Riitters, K., Iwanowski, M., Christine, E., Jacek, K., & Pierre, S. (2007). Mapping landscape corridors. Ecological Indicators, 7, 481–488.
- Wade, T. G., Wickham, J. D., Zaccarelli, N., & Riitters, K. H. (2009). A multi-scale method of mapping urban influence. Environmental Modelling & Software, 24, 1252–1256.
- Walker, R., Moore, N. J., Arima, E., Perz, S., Simmons, C., Caldas, M., … Bohrer, C. (2009), Protecting the amazon with protected areas. Proceedings of the National Academy of Sciences, 106, 10582–10586.
- Wiens, J. A. (2002). Central concepts and issues of landscape ecology. In K. J. Gutzwiller (Ed.), Applying landscape ecology in biological conservation (pp. 3–21). New York, NY: Springer-Verlag.
- Wu, J., & Qi, Y. (2000). Dealing with scale in landscape analysis: An overview. Geographic Information Sciences, 6, 1–5.
- Zaccarelli, N., Riitters, K. H., Petrosillo, I., & Zurlini, G. (2008). Indicating disturbance content and context for preserved areas. Ecological Indicators, 8, 841–853.
- Zurlini, G., Riitters, K. H., Zaccarelli, N., Petrosillo, I., Jones, K. B., & Rossi, L. (2006). Disturbance patterns in a socio-ecological system at multiple scales. Ecological Complexity, 3, 119–128.