
Abstract
Rapid urbanization is accelerating the loss of agricultural land in Hanoi (Vietnam), raising concerns about food provision for inner citizens and livelihoods of peri-urban farmers. Understanding how this loss is linked with urban expansion is important to predict impacts of urbanization on peri-urban agriculture. In this paper, we examine the conversion of agricultural land to built-up land in Hanoi by using Landsat images (1993, 2000 and 2007). About one-third of the agricultural land was converted to built-up areas. Agricultural patches tend to be more fragmented and to have irregular shapes. Areal loss, fragmentation and edge irregularity of agricultural land appear to be related to the change from rural status into urban status. Such tendencies of the conversion correspond to urban growth patterns in Hanoi (infill, expansion and linear branches). This study calls for immediate measures to protect agricultural land and accelerate the creation of the green belt in Hanoi.
1. Introduction
Asian developing countries are facing rapid urban population growth with an annual rate of 2.19% compared with 0.18% in Europe and 1.11% in North America (United Nations, Citation2008). In Vietnam, annual rate of urban population growth is estimated to be 3.4%, which might lead to the increase of urban population between 30% and 50% in the next 25 years (Ministry of construction, Citation2009). The government of Vietnam plans to convert 450,000 ha of agricultural land to urban land by 2025 to accommodate the increase in its urban population, which will reach 52 million people (Government of Vietnam, Citation2009b). Rapid urbanization caused by population growth is accelerating the shift from farmland into urban land in Vietnam, as well as in many other developing countries (Azadi, Ho, & Hasfiati, Citation2010; Bruinsma, Citation2003; Fazal, Citation2001; Firman, Citation2000; Ho & Shibayama, Citation2009; Kelly, Citation1998; Su, Jiang, Zhang, & Zhang, Citation2011; van den Berg, van Wijk, & van Hoi, Citation2003). Given the central role of peri-urban agriculture in sustaining peri-urban farming livelihoods and in providing food to the intra-urban population (FAO, Citation2007), it is crucial to understand agricultural land conversion in areas undergoing intensive urbanization, such as Hanoi (Vietnam). However, studies on LULC change in Vietnam have focused more on urban growth at the metropolitan (Pham, Yamaguchi, & Bui, Citation2011) scale (Ho & Shibayama, Citation2009; Pham & Yamaguchi, Citation2007; Pham et al., Citation2011), agriculture change in rural areas (Leisz, Citation2009) or forest transitions in mountainous areas (Meyfroidt & Lambin, Citation2008; Müller & Munroe, Citation2005) rather than in peri-urban areas. Given this context, monitoring the rate, extent and spatial patterns of agricultural land conversion in Hanoi is urgent for this study.
Studies on urbanization in developing countries suggest three common characteristics of the conversion of agricultural land. First, there is a dramatic reduction of agricultural land resulting from residential and industrial development. The peri-urban components of large metropolitan areas such as Hanoi, Manila, Jakarta or Chinese cities in the Yangtze River Delta are examples for such reduction (Firman, Citation2000; Kelly, Citation1998; Quang, Minh, Mai, Huong, & Thang, Citation2005; Su et al., Citation2011; Xie, Yu, Bai, & Xing, Citation2006). Second, under the pressure of population growth and the reduction of farmland, peri-urban agriculture has become intensified and commercially oriented (Zeeuw, Citation2004). In 2002, the cropping intensity in Hanoi reached 220%, that is, there were 87,628 ha of gross sown area versus 39,826 ha of the total available crop land (Anh, Ali, Anh, & Ha, Citation2004). Agriculture intensification leads to the loss of biodiversity and has put agriculture land under pressure to a large extent (Firbank, Petit, Smart, Blain, & Fuller, Citation2008; Liu, Duan, & Yu, Citation2013), which in turn reduces environmental quality and resilience after disturbances (Harms, Stortelder, & Vos, Citation1987; Tscharntke, Klein, Kruess, Steffan-Dewenter, & Thies, Citation2005). Third, urbanization changes spatial patterns of agricultural landscapes. In peri-urban areas undergoing urbanization, agricultural patches tend to be reduced in size, to have irregularized edges and become less connected, leading to habitat fragmentation (DiBari, Citation2007; Li & Yeh, Citation2004; Su et al., Citation2011; Xie et al., Citation2006). Habitat fragmentation is often defined as a process through which a habitat is transformed into a number of smaller patches with a lower total area, isolated from each other by a matrix of habitats unlike the original (Andrén, Citation1994; Meyfroidt & Lambin, Citation2008; Wilcove, McLellan, & Dobson, Citation1986). Habitat fragmentation is generally thought to have adverse effects on the interactions between plants and insects in an agro-ecosystem such as increasing isolation of habitat patches. It also implies a loss of biological diversity, a reduction in patch size and an increasing distance between patches within the original habitat (Andrén, Citation1994; Haynes & Crist, Citation2009; Tscharntke et al., Citation2005). However, the relative importance of such effects might differ depending on the degree of habitat fragmentation (Andrén, Citation1994; Haynes & Crist, Citation2009; Holt et al., Citation1995; Holt, Lo, & Hodler, Citation2004; With, Pavuk, Worchuck, Oates, & Fisher, Citation2002).
Moreover, other studies also provide evidence that the reduction and fragmentation of agricultural land are closely related to patterns of urban growth (e.g., Pham & Yamaguchi, Citation2007; Su, Xiao, & Zhang, Citation2012). Previous studies in Hanoi have observed three main patterns of urban growth (Ho & Shibayama, Citation2009; Pham et al., Citation2011): infill growth, which is characterized by a non-urban patch converted to urban use and surrounded by at least 40% of existing urban patches; expansion growth, which is characterized by a non-urban patch converted to urban use and surrounded by no more than 40% of existing urban patches; and linear branches, which are defined as new roads or new linear developments that are surrounded by non-urban patches (Hoffhine Wilson, Hurd, Civco, Prisloe, & Arnold, Citation2003). In Hanoi, infill occurred in older urban areas, while expansion occurred in the west and linear branches occurring along new transportation axes in the south. Understanding how changes in agricultural land are linked with these patterns of urban growth over time is essential to predict impacts of urbanization on peri-urban agriculture. However, the effects of urban expansion on peri-urban agriculture are still poorly understood in Vietnam.
The speed and patterns of the conversion of agricultural land may also vary from one city to another. A few factors influencing the conversion of agricultural land, such as topographic constraints, distance to urban centers, land speculation or land use management, have been discussed in the literature (e.g., DiBari, Citation2007; Firman, Citation2000; Li & Yeh, Citation2004; Pan & Zhao, Citation2007; Xiao et al., Citation2006; Yu & Ng, Citation2007). In Hanoi, there was major change of administrative status in its rural districts, which might be an influential factor of land management that would trigger the conversion of rural land use, including agriculture. During the period 1993–2007, certain rural communes in Hanoi were designated as urban wards (Government of Vietnam, Citation2003; Nguyen, Citation2003). These new urban districts have received incentives to convert crop land into infrastructures and residential land in order to meet the criteria of an urban district, according to the Decree 42/2009/ND-CP on Urban Classification (Government of Vietnam, Citation2009a). In other words, once the urban status has been earned, these former rural communes must change their economic and land use structures by reducing the proportion of agricultural activities, for example, in order to become an urban unit. Since farmers can legally change the use of their former agricultural land, they might build new houses on their agricultural land or sell it to others who may build new houses (Popular Committee of Hanoi, Citation2011). This also triggers land speculation, accelerates the loss of agricultural land in these new urban wards and diversifies the pattern of change indifferent types of administrative units.
As such, this study aims at quantitatively monitoring and characterizing the conversion of agricultural to built-up land in Hanoi by using satellite images and landscape metrics, focusing on the years 1993, 2000 and 2007. The choice of observation years is motivated by dramatic urbanization in Vietnam and especially by the status change of former rural districts into urban districts in Hanoi (Government of Vietnam, Citation2003, Citation2009a; Nguyen, Citation2003). Our objectives are threefold: (1) determine the extent and rate of the loss of agricultural land in the peri-urban of Hanoi; (2) examine patterns of the conversion from agricultural land to urban land in relation with urban growth; and (3) examine how the change in administrative status is associated with agricultural conversion by closely looking at patterns of the conversion in three categories of administrative units – unchanged rural units (RR), unchanged urban units (UU) and rural units that have been granted urban status (RU).
2. Study area: peri-urban agriculture under urbanization
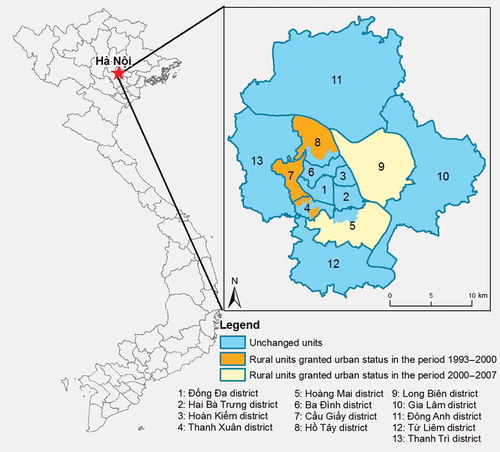
The study area covers almost the entire former province of Hanoi, the capital of Vietnam, with the exception of the district of Sóc Sơn (). This district was excluded due to a significant cloud cover in the Landsat images of Hanoi. However, the exclusion does not affect our analysis as the district was experiencing minor urbanization, and hence less loss of agricultural land, than the other districts. The study area is composed of 13 administrative districts containing 133 urban wards (phường in Vietnamese) and 73 rural communes (xã).
Figure 1. Location of the study area within the former city of Hanoi.
Hanoi’s urban population grew rapidly during 1997 and 2003 (). While the rural population remained stable (about 970,000 people from 1993 to 2007), the urban population almost doubled, from 1,100,000 in 1993 to nearly 2,100,000 in 2007 before Ha Tay province was merged into Hanoi in 2008. The number of rural wards was decreased, from more than 50% of the lowest administrative units in 1993 to 30% in 2007, due to the change in status (from rural communes to urban wards).
Table 1. Population of the study area in 1993, 2000 and 2007.
Peri-urban agriculture in Hanoi offers various crop types. Winter and spring rice paddy occupied more than 34% and 26% of the sown area, respectively. Maize, vegetable and flower represented 11.7%, 7.6% and 1.1%, respectively (Hanoi Statistical Office (1995), adapted from Van den Berg). The spatial distribution of crop types is strongly heterogeneous. Rice, maize and vegetable fields are located mostly in rural districts while most of flower production is found in urban districts. Some rural districts are specialized in both vegetables and rice (Đông Anh, Gia Lâm, Thanh Trì identified as 11, 10, 12 on ). Đông Anh is the most important producer of vegetables in Hanoi, occupying 26% of the total sown area of vegetables (van den Berg et al., Citation2003).
Peri-urban agriculture in Hanoi is the most important provider of non-cereal production (meat, vegetables and flowers) for the inner city. In 2002, more than 70% of leafy vegetables were provided by production areas in a radius of 30 kilometers around the city. Peri-urban agriculture in Hanoi is also an important source of income for local farmers. Given its key role in providing ecological services, supplying food to the city population and for sustaining livelihoods for farmers and developing eco-tourism, the government has planned to conserve agriculture in the suburbs of Hanoi (Quang et al., Citation2005).
3. Materials and methods
3.1. Imagery data
In order to detect the change of agricultural land in the study area, we used three Landsat 7 TM and ETM+ satellite images acquired on 27 December 1993, 4 November 2000 and 8 May 2007. The selection of these dates was based on two criteria: (1) creations of new urban districts in Hanoi in 1996 and 2000, and (2) similarity in the phenological status of vegetation cover. The first two images were taken during the same crop period (winter crop of rice), but the third image was taken during the summer crop. To reconcile this time discrepancy, we undertook a post-classification comparison between the three images. We classified each image into land cover classes and then overlaid their classification to obtain changes of land cover classes.
3.2. Classification of land cover change
Among the methods of classifying remotely sensed images, the object-oriented approach offers the possibility to use information such as shape, contextual relationship of the objects and thematic knowledge to distinguish ecologically meaningful habitat types that are not necessarily distinguishable by spectral features (Bock, Xofis, Mitchley, Rossner, & Wissen, Citation2005). This approach is based on the creation of image objects (also termed segmentation) and the classification of objects. Segmentation involves subdividing the image into separate regions of spatially grouped pixels that should represent meaningful objects in the real world (Benz, Hofmann, Willhauck, Lingenfelder, & Heynen, Citation2004; Bock et al., Citation2005). The classification like that used in eCognition software is based on fuzzy membership functions of object features. The software offers a wide choice of object features, such as spectral statistics, texture, shape and topological features (neighbor objects, super-level objects, etc.) (Baatz et al., Citation2004). The object-oriented approach also allows us to extract meaningful objects, that is, similar to real-world objects and patches, and to convert them into vectors that are easily integrated into GIS for further analysis (Benz et al., Citation2004).
The object-oriented approach is useful to analyze the land use change in the peri-urban area of Hanoi where agricultural parcels are small and very fragmented. In 2003, for example, the minimum size of parcel was 26 m2 and the average number of parcels was 4.8 per household (Dang, Citation2004). Such fragmentation in parcels leads to highly mixed patterns of land use, including the case of the industrial zones or among groups of houses found in paddy fields. Since trees in those zones have a similar spectral response to full-growth rice in paddy fields, relying solely on spectral response can lead to misclassification of trees and rice. The object-oriented approach, with its wide choice of object features, allows us to obtain image objects corresponding to built-up areas that contain both ‘tree’ pixels and ‘impervious surface’ pixels, even if we did not aim to extract objects as small as 26 m2. Therefore, we favor this approach to classify land cover types of the study area from Landsat images. Based on previous studies in Hanoi (Ho & Shibayama, Citation2009; Pham et al., Citation2011), we identified four land cover types from the Landsat images: agriculture, built-up areas, water bodies and bare lands.
Image analysis was conducted with Trimble’s eCognition Developer 8.64 (Trimble Germany GmbH, München, Germany). Segmentation parameters were chosen based on empirical tests. The three images were segmented into the following parameters: all band weights = 1, scale = 5, color/shape = 0.9/0.1 and compactness/smoothness = 0.5/0.5. Classification rules were composed of different features of objects (). For further details about each parameter, readers can consult the software guide (Definiens, Citation2009). Once we obtained the four land cover types from Landsat images in 1993, 2000 and 2007, we overlaid three land cover maps by using the Tabulate Area tool in ArcGIS in order to compute the extent and rate of changes of agricultural land for the two periods, 1993–2000 and 2000–2007.
Table 2. Classification rules.
To validate the image classification, it is preferable to conduct fieldwork or to use another source of data, such as an image or aerial photo that has finer resolution than Landsat images. Due to the lack of historical data, especially high-resolution images/photos, we could not conduct an assessment for 1993 and 2000. The only image on Google Earth that is available for the study area and acquired at a moment close to one of the three images was a GeoEye image (spatial resolution of 50 cm, acquired on 18 October 2008). Thus, we conducted a visual interpretation of this GeoEye image to validate the 2007 classification. We assume that the accuracy of the other classifications was similar to this one. We selected 71 square plots on the GeoEye image (randomly distributed over the study area), each of which contained all the four types of land cover in question. The size of each plot was 350 m × 350 m covering about 1.5% of the study area. This sampling method is usually recommended in the literature, for example, by Congalton and Green (Citation2009). In each sample plot, we digitized the boundaries of the four classes. By this way, we did 71 samples per class. The visual interpretation result was overlaid on the 2007 image classification to create the confusion matrix.
To measure the change of agricultural land in each commune/ward, we computed the annual change in arable land (Equation (1)) and the annual rate of change in arable land (Equation (2)). The former refers to the average speed at which arable land is reduced or increased. The latter is derived from the Compound Interest Law in finance, which is similar to the formula used to compute land use change, including arable land loss (Xie, Mei, Guangjin, & Xuerong, Citation2005) or deforestation (Puyravaud, Citation2003).
3.3. Analysis of agricultural patches by using landscape metrics
Landscape metrics are algorithms that estimate the geometric shape and spatial configuration of landscape structures and thus are widely used in landscape ecology (Turner, Gardner, & O’Neill, Citation2001). In describing or representing a landscape, analysis of landscape structures focuses on patches that are defined as spatially consistent areas with similar thematic features as basic homogeneous entities (McGarigal, Cushman, Neel, & Ene, Citation2002). In peri-urban studies, landscape metrics are proven to be useful to compare the structural and functional differences of landscape patches at different transects along the urban–rural axis (Herold, Scepan, & Clarke, Citation2002; Li & Yeh, Citation2004; Yu & Ng, Citation2007). Landscape metrics can also help to quantitatively identify and characterize complex spatial patterns of urbanization, which can subsequently be related to ecological and socioeconomic processes (DiBari, Citation2007; Luck, Smallbone, & O’Brien, Citation2009; Xie et al., Citation2006). Landscape metrics have been used to determine landscape patterns, biodiversity and habitat fragmentation related to changes in agricultural landscapes (Pan & Zhao, Citation2007; Su et al., Citation2011).
Landscape metrics can be computed by using the extension Patch analysis 4 in ArcGIS 9.3. There are 31 metrics that are regrouped into five categories: (1) patch size and density, (2) shape, (3) isolation and proximity, (4) contagion and (5) connectivity. Each group contains a number of metrics that may be highly correlated (Cushman, McGarigal, & Neel, Citation2008; Riitters et al., Citation1995; Turner et al., Citation2001), and hence metrics need to be chosen carefully. Three criteria for selecting a useful set of metrics in landscape ecology have been suggested by Turner et al. (Citation2001): (1) the metrics should answer a particular question or objective; (2) the measured values of the metrics should be distributed over the full range of potential values; and (3) the metrics should be relatively independent of each other relevant for characterizing landscape pattern, ecosystem function and habitat quality. In this study, we have privileged the first criteria of selection, that is, metrics should allow us to capture the three tendencies of agricultural conversion mentioned above: loss in area, fragmentation and edge irregularity. As such, the selection of our metrics is based on the literature pertaining on land use land cover change in regions undergoing intensive urbanization (Pan & Zhao, Citation2007; Pham et al., Citation2011; Xiao et al., Citation2006; Yu & Ng, Citation2007) and on spatial patterns of agricultural conversion (DiBari, Citation2007; Li & Yeh, Citation2004; Su et al., Citation2011; Xie et al., Citation2006). Five metrics were finally chosen to quantify patterns of agricultural patches: LPI characterizes patch area; TCA patch core; MPI and MNN patch isolation and LSI patch shape (name and description of metrics are provided in ).
Table 3. Description of the spatial metrics used in this study (McGarigal et al., Citation2002).
4. Results
4.1. Image classification accuracy and land cover maps
The confusion matrix () shows that the overall accuracy of the 2007 classification is 0.8. Producer accuracy and user accuracy of agricultural land are 0.8 and 0.8, respectively, which are acceptable in remote sensing (Congalton & Green, Citation2009). However, some confusion in this classification is to be noted. First, there is confusion of built-up area and agricultural land. It is likely that there are small built areas located within agricultural fields that can be detected on the GeoEye image (spatial resolution of 50 cm) but not on the Landsat image because of the latter’s coarse resolution (30 m). Second, agricultural land was also mixed up with water: 0.6 km2 classified as water on the Landsat image were identified as agriculture on the GeoEye image. One possible explanation is that the water level of rivers and lakes was higher when the Landsat image was taken (8 May 2007, summer rainy season) than when the GeoEye image was taken (18 October 2008, a season with less rainfall). Finally, built-up areas and bare land are not well separated because of similar spectral signals of these two classes on the Landsat image.
Table 4. Confusion matrix conducted for the 2007 image classification (unit = ha).
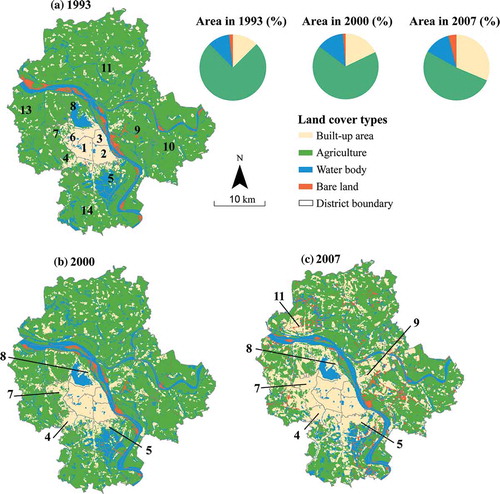
The final classifications are reported in . The presence of agricultural land in the study area has decreased from 75% in 1993 to 67.6% in 2000 and to 51.7% in 2007. This means that after 14 years, about one-third of the agricultural land was converted to other land cover types, essentially built-up areas. A comparison of the 1993 and 2000 maps shows important conversion from agricultural land to built-up areas in Thanh Xuân and Tây Hồ (marked as 4 and 8, respectively, in ) and a few areas of Cầu Giấy and Hoàng Mai (7 and 5). Between 2000 and 2007, from those new developments, built-up areas expanded all over the districts of Thanh Xuân, Tây Hồ and Cầu Giấy (marked as 4, 8 and 7 in ). Conversion from agricultural to built-up areas in that period also occurred in a few other parts of the districts of Hoàng Mai, Long Biên and Đông Anh (5, 9 and 11).
Figure 2. Final classification of land cover types in 1993, 2000 and 2007.
shows trajectories of land cover change during the two periods. During 1993–2000, the area of agricultural land converted into built-up land is the most important (3856.2 ha). Less important is conversion of agricultural land into water body and bare land. This tendency is still observed in the period 2000–2007, but the conversion of agricultural land into built-up land is much higher than in the period 1993–2000 reaching 8109.6 ha.
Table 5. Trajectories of land cover change in 1993–2000 (above) and in 2000–2007 (below) (unit = ha).
indicates that the annual loss of agricultural land in the second period is twice as high as the annual change in the first period (1419.8 ha and 659.7 ha, respectively). It is notable that the annual rate of change was 1% in the first period but 4% in the second. Combining and , we could conclude that such a loss of agricultural land was caused by the development of built-up land.
Table 6. Extent and annual change and annual rate of change of land cover types.
4.2. Changes of agricultural patches and relations to urban growth
Changes of agricultural patches were computed for two periods (). First of all, LPI values (largest patch index), which show the dominance of agricultural land in the study area, indicate a weaker dominance of agricultural land and a gradual loss. TCA (total core area) has been also reduced dramatically throughout the observed periods, showing both loss and fragmentation of agricultural land.
Figure 3. Changes in the five metrics over the two periods of observation.
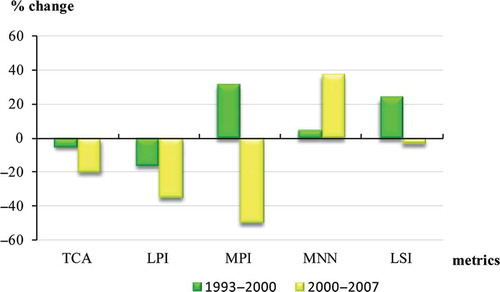
MPI (mean proximity index) increased in the period 1993–2000, showing a higher degree of isolation in 2000 in comparison to that of 1993. But between 2000 and 2007, the decline of this metric suggests that patches were less isolated. MNN (mean nearest neighbor distance) shows an increase in distance between patches of agricultural land from 1993 to 2000 and at a higher rate from 2000 to 2007. In sum, these changes indicate that patches of agriculture tend to be more fragmented. Although MPI has increased between 2000 to 2007, this metric is sensitive to patch size (McGarigal et al., Citation2002). We believe that the change of this metric might be uneven across the study area and that new agricultural patches in Tây Hồ or Long Biên may have raised the mean value of MPI.
LSI (landscape shape index) increased during the period 1993–2000, showing a higher degree of complexity of agricultural patches. However, this index was slightly decreased from 2000 to 2007, suggesting that patch edges of agricultural land become smoother, which would be caused by the absorption of areas that become unusable for cultivation. In sum, these metrics indicate three trends of transformations over the study area: loss (declining TCA, LPI), fragmentation (rising MNN) and edge irregularity (declining LSI).
The above transformations of agricultural land are likely related to three patterns of urban growth, which was proposed in the recent literature (Ho & Shibayama, Citation2009; Pham et al., Citation2011): infill, expansion and linear patterns. During the first period of observation, in older urban districts such as Hoàn Kiếm, Ba Đình, Đống Đa and Hai Bà Trưng, the trend of areal loss occurred due to the infill urbanization: agricultural land was reduced dramatically (e.g., from 158.8 ha in 1993 to 75.7 ha in 2000) and replaced mostly with residential construction (as illustrated in ). In new urban districts, loss, fragmentation and edge irregularity occurred due to expansion of residential and industrial development ( and ), linear patterns of transportation axis () as patches became smaller and more isolated. Infill was also observed but only in the urban wards of these districts. This suggests that fragmentation and irregularity of agricultural patches were triggered by the expansion and linear development of urbanization, especially in the new urban districts, Thanh Xuân and Cầu Giấy.
Figure 4. The process of agricultural landscape transformation: agricultural patches in the peri-urban are fragmented in 1993 and become more irregular (2000) then isolated from each other (2007).
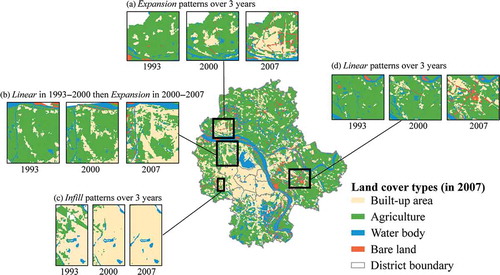
During the second period, infill urbanization resulted in the disappearance of almost all agricultural patches in older urban districts (e.g., ) and in the loss in urban wards of Thanh Xuân and Cầu Giấy. On the other hand, expansion and linear patterns of urbanization began to cause the increase of fragmentation and irregularity in the formerly rural communes of Từ Liêm, Long Biên and Hoàng Mai (e.g., and ).
4.3. Closer analysis on three categories of administrative units
We also analyze the change in landscape metrics of agricultural patches in three different types of administrative units: units that remain rural (RR), units that were granted the urban status (RU) and units that remained urban (UU) during the two periods of observation. shows the location of RU units. In order to compare the change of landscape metrics in the categories of administrative units, we use an analysis of variance (ANOVA). ANOVA is the technique of analysis of variance employed when there are more than two groups of data samples to compare (Trosset, Citation2009). In our study, we used ANOVA to examine if there exists statistically significant difference in mean values of metric change among three groups RR, RU and UU over the study periods. ANOVA results () show that the loss of agricultural land is significantly different from one unit to another in three administrative units (RR, RU and UU). To better understand the difference in agricultural land loss patterns, we use mean values of change in metrics in each group of units ().
Table 7. Mean values of changes in area and metrics for each administrative group.
In the period 1993–2000, the average change in area measured for the RU units was much higher than that of RR and UU (–23.1% versus –8.3% and –4.1%). However, in the second period, the average change in areas for RR units became much smaller, indicating an increasing loss in area (–18.1%). The change in LPI of agricultural land of RU units has also decreased faster than that of RR and UU for both periods.
The change in TCA of all three groups has a similar tendency. In the first period, this metric had a greater change in the RU and RR units than in the UU ones. This suggests that agricultural land patches in the RU and RR units are more fragmented than the other groups from 1993 to 2000. In the 2000–2007 period, the change in TCA in the RR units was the highest, showing the continuous reduction of agricultural land.
The fragmentation and isolation of agricultural land are more complicated than the reduction in areal metrics. During the first period, in the RR units, MPI (mean proximity index) decreased (negative change, –4.9) and the change in MNN (mean nearest neighbor distance) increased (positive change, 364.9), indicating a strong fragmentation and isolation of agricultural land by 2000 compared with 1993. However, in the RU and UU units, the tendency is reversed, indicating that the agricultural land of those units was less fragmented. In the second period, interestingly the three categories of units have the same tendency: the change in MPI slowly increased (26.7 for RR versus 34.1 and 31.2 for RU and UU, respectively), whereas the change in MNN in the RR units decreased with the highest rate in comparison to the RU and UU units (–36.3 versus –14.4 and –8.0).
The change in LSI shows that edge irregularity of patches is substantially different during the two periods. Between 1993 and 2000, LSI of UU group has decreased (negative change, –0.3), whereas both RR and RU groups have an increased LSI (positive change) and the RR units have a faster change. This indicates that agricultural land of the RR and RU units had more irregular patches in 2000 than in 1993. Further in the period 2000–2007, LSI of the RR units continued to increase (0.1), while in the RU units it decreased seriously (–1.1). This change is likely related to the acceleration of agricultural land reduction in the RU units.
5. Discussion and conclusion
In this study, we have characterized the rate and broad patterns of agricultural land conversion for the study peri-urban area of Hanoi. It complements previous studies on urban expansion and agricultural land conversion that was addressed by case studies at a local scale (Anh et al., Citation2004; Leaf, Citation2002; Quang et al., Citation2005; van den Berg et al., Citation2003). Notwithstanding the limited spatial resolution of Landsat data used in this study, the object-oriented classification has helped us identify major land cover types by combining the spectral features of images with knowledge of the study area. The use of landscape metrics has also allowed us to observe changes in area and in shape of agricultural patches. As such, this study provides quantitative evaluation of agricultural conversion, which could be of interest to urban planners and policymakers.
A few findings are to be highlighted. There was a loss of agricultural land of 1.4% per year in 1993–2000 and 3.0% per year in 2000–2007. An examination of landscape metrics in Hanoi indicates three trends of agricultural landscape transformation: loss of area, fragmentation and edge irregularity. The loss and fragmentation trends seem to be more severe in the second period of observation (2000–2007) while edge irregularity tends to be more important in the first period of observation (1993–2000). We have also identified patterns of the loss of agricultural land in Hanoi. The area loss of agricultural land occurred at residential and industrial development with the infill (in older urban districts) and expansion (in newer urban or rural districts). Fragmentation and edge irregularity occurred mostly in new urban districts where there were expansion and linear branches along transport axes.
The reduction of area of agricultural land was similarly observed in southeast or coastal east China especially after the economic reform in 1979 (Pan & Zhao, Citation2007; Su et al., Citation2011; Xie et al., Citation2006) and in northern India in the 1990s (Fazal, Citation2001). In these cases, urban residential construction, industrial zones, transportation and sometimes rural construction are the main causes of the loss of arable land. Moreover, the trend of more serious loss of arable land in Hanoi during the second period than the first one is also similar to the ‘rapid growing’ step of agricultural conversion in China (5 years after their reform in 1979). In terms of geometrical change in agricultural patches, the study in Hang Jia Hu (China) also revealed that agricultural patches became fragmented, transformed and isolated (with more edge irregularity), especially around urban centers. However, this trend is in contrast to what Pan and Zhao (Citation2007) have shown in Yixing City (southeast China).
In addition, a detailed analysis in the three categories of lower administrative units experiencing the switch of rural status into urban status (RR, UU and RU units) reveals a more complex picture. ANOVA results indicate that the loss of area and the change in fragmentation and edge occurred differently in the three unit categories (except MNN and MPI in the second period). More specifically, there was a severe loss of agricultural land in new urban wards (RU units) over the two periods. As for the fragmentation, rural communes have high fragmentation of agricultural patches, but old and new urban wards appeared to have no fragmentation in the first period. Edge irregularity differed between the two periods: higher edge irregularity in rural communes and new urban wards in the first periods but lower irregularity in the second period. Such differential changes among the three unit categories suggest the administrative switch could be one of the important driving forces of the agricultural conversion in Hanoi, an idea that deserves to be further investigated in future studies. The fact that the loss and the fragmentation of agricultural lands were more pronounced in communes undergoing status shift (RU units) were related to the policy of urbanization and hence reflects the pro-urban policy of Vietnam (World Bank, Citation2011). This result coincides with developmental priorities in urbanization of other regions, such as the Philippines (Kelly, Citation1998).
This study has its limitations. Our classification contains only four classes but we were not able to distinguish different types of agriculture, for example, vegetable or flowers versus rice and maize, nor could we separate industrial land from residential land. This is due to the coarse spatial resolution of the Landsat images used in our study. In addition, we only tested one spatial and thematic resolution, which is not adequate for characterizing landscape composition and structure of agricultural land at a detailed scale (Buyantuyev & Wu, Citation2007; Rocchini, Citation2005).
Extended research is needed to examine the underpinnings of agricultural conversion. One potential approach is to use quantitative evaluations to determine the relationships among agricultural conversion, urbanization and urban planning, with special focus on the change in administrative status. Previous studies on land use change in Vietnam or agricultural conversion elsewhere have used statistical models and spatial analysis (see, e.g., Müller & Munroe, Citation2005; Su et al., Citation2011).
Urbanization in peri-urban areas of Hanoi seems to be unavoidable in the context of the economic boom stimulated by the country’s economic reforms occurring since 1986 (McGee, Citation2009). Even if urbanization is planned by the government with a long-term vision (Government of Vietnam, Citation2009b), this process seems to be still uncontrollable, causing undesirable transformations of agricultural land that, in turn, would affect the food provision and livelihoods in the peri-urban areas. The recent merger of the neighboring province of Hà Tây into Hanoi makes the protection of agricultural land even more urgent. This study calls for immediate measures to protect agricultural land and accelerate the creation of the green belt in peri-urban Hanoi in order to mitigate adverse effects of rapid urbanization and eventually increase the sustainability of the metropolitan region.
Additional information
Funding
References
- Andrén, H. (1994). Effects of habitat fragmentation on birds and mammals in landscapes with different proportions of suitable habitat: A review. Oikos, 71, 355–366.
- Anh, M. T. P., Ali, M., Anh, H. L., & Ha, T. T. T. (2004). Urban and Peri-urban agriculture in Hanoi: Opportunities and constraints for safe and sustainable food production. Taiwan: AVRDC – The World Vegetable Center: Technical Bulletin No. 32, AVRDC Publication 04–601.
- Azadi, H., Ho, P., & Hasfiati, L. (2010). Agricultural land conversion drivers: A comparison between less developed, developing and developed countries. Land Degradation & Development, 22(6), 596–604.
- Baatz, M., Benz, U. C., Dehghani, S., Heynen, M., Höltje, A., Hofmann, P., … Weber, M. (2004). eCognition professional user guide version 4.0. München: Definiens Imaging GmbH.
- Benz, U. C., Hofmann, P., Willhauck, G., Lingenfelder, I., & Heynen, M. (2004). Multi-resolution, object-oriented fuzzy analysis of remote sensing data for GIS-ready information. ISPRS Journal of Photogrammetry & Remote Sensing, 58, 239–258.
- Bock, M., Xofis, P., Mitchley, J., Rossner, G., & Wissen, M. (2005). Object-oriented methods for habitat mapping at multiple scales – Case studies from Northern Germany and Wye Downs, UK. Journal for Nature Conservation, 13, 75–89.
- Bruinsma, J. (2003). World agriculture: Toward 2015/2030. An FAO Perspective (p. 432). Rome: FAO: Earthscan.
- Buyantuyev, A., & Wu, J. (2007). Effects of thematic resolution on landscape pattern analysis. Landscape Ecology, 22, 7–13.
- Congalton, R. G., & Green, K. (2009). Assessing the accuracy of remotely sensed data – Principles and practices (2nd ed.). Boca Raton, FL: CRC Press, Taylor & Francis Group.
- Cushman, S. A., McGarigal, K., & Neel, M. C. (2008). Parsimony in landscape metrics: Strength, universality, and consistency. Ecological Indicators, 8, 691–703.
- Dang, K. S. (2004). Local practices of land grouping in the red river delta aiming at increasing the efficiency of agriculture land. Hanoi: Study Fund IAE-MISPA, Institute of Policy and Strategy for Agriculture and Rural Development (IPSARD).
- Definiens. (2009). eCognition developer 8 – User guide. München: Definiens.
- DiBari, J. N. (2007). Evaluation of five landscape-level metrics for measuring the effects of urbanization on landscape structure: The case of Tucson, Arizona, USA. Landscape and Urban Planning, 79, 308–313.
- FAO. (2007). Profitability and sustainability of urban and peri-urban agriculture. Rome: FAO.
- Fazal, S. (2001). The need for preserving farmland: A case study from a predominantly agrarian economy (India). Landscape and Urban Planning, 55, 1–13.
- Firbank, L. G., Petit, S., Smart, S., Blain, A., & Fuller, R. J. (2008). Assessing the impacts of agricultural intensification on biodiversity: A British perspective. Philosophical Transactions of the Royal Society B: Biological Sciences, 363, 777–787.
- Firman, T. (2000). Rural to urban land conversion in Indonesia during boom and bust periods. Land Use Policy, 17, 13–20.
- Government of Vietnam. (2003). Decree No 132 2003 ND-CP dated on November 6, 2003: Adjusting the administrative boundaries for the establishment of Long Biên and Hoàng Mai urban districts, Hanoi city, and establishing their wards. Hanoi: Author.
- Government of Vietnam. (2009a). Decree 42/2009/ND-CP 7th May, 2009 on the classification of urban areas. Hanoi: Author.
- Government of Vietnam. (2009b). Government Decision 445/QĐ-TTg dated 07/04/2009 on approval the urban master plan until 2025. Hanoi: Author.
- Harms, W. B., Stortelder, A. H. F., & Vos, W. (1987). Effects of intensification of agriculture on nature and landscape in the Netherlands. In M. G. Wolman & F. G. A. Fournier (Eds.), Land transformation in agriculture (pp. 357–380). New York, NY: John Wiley.
- Haynes, K. J., & Crist, T. O. (2009). Insect herbivory in an experimental agroecosystem: The relative importance of habitat area, fragmentation, and the matrix. Oikos, 118, 1477–1486.
- Herold, M., Scepan, J., & Clarke, K. C. (2002). The use of remote sensing and landscape metrics to describe structures and changes in urban land uses. Environment and Planning A, 34, 1443–1458.
- Ho, D. D., & Shibayama, M. (2009). Studies on Hanoi urban transition in the late 20th century based on GIS/RS. Southeast Asian Studies, 46, 532–546.
- Hoffhine Wilson, E., Hurd, J. D., Civco, D. L., Prisloe, M. P., & Arnold, C. (2003). Development of a geospatial model to quantify, describe and map urban growth. Remote Sensing of Environment, 86, 275–285.
- Holt, J. B., Lo, C. P., & Hodler, T. W. (2004). Dasymetric estimation of population density and areal interpolation of census data. Cartography and Geographic Information Science, 31, 103–121.
- Holt, R. D., Debinski, D. M., Diffendorfer, J. E., Gaines, M. S., Martinko, E. A., Robinson, G. R., & Ward, G. C. (1995). Perspectives from an experimental study of habitat fragmentation in an agroecosystem. In D. M. Glen, M. P. Greaves, & H. M. Anderson (Eds.), Ecology and integrated farming systems (pp. 147–175). Bristol: John Wiley & Sons.
- Kelly, P. F. (1998). The politics of urban rural relations: Land use conversion in the Philippines. Environment and Urbanization, 10, 35–54.
- Leaf, M. (2002). A tale of two villages. Globalization and peri-urban change in China and Vietnam. Cities, 14, 23–31.
- Leisz, S. J. (2009). Dynamics of land cover and land use changes in the upper Ca river basin of Nghe An, Vietnam. Southeast Asian Studies, 47(3), 285–306.
- Li, X., & Yeh, A. G.-O. (2004). Analyzing spatial restructuring of land use patterns in a fast growing region using remote sensing and GIS. Landscape and Urban Planning, 69, 335–354.
- Liu, Y., Duan, M., & Yu, Z. (2013). Agricultural landscapes and biodiversity in China. Agriculture, Ecosystems & Environment, 166, 46–54.
- Luck, G., Smallbone, L., & O’Brien, R. (2009). Socio-economics and vegetation change in urban ecosystems: Patterns in space and time. Ecosystems, 12, 604–620.
- McGarigal, K., Cushman, S. A., Neel, M. C., & Ene, E. (2002). FRAGSTATS: Spatial pattern analysis program for categorical maps. Amherst, MA: Computer software program produced by the authors at the University of Massachusetts.
- McGee, T. G. (2009). Interrogating the production of urban space in China and Vietnam under market socialism. Asia Pacific Viewpoint, 50, 228–246.
- Meyfroidt, P., & Lambin, E. F. (2008). Forest transition in Vietnam and its environmental impacts. Global Change Biology, 14, 1–18.
- Ministry of Construction (2009). Directions of urban development planning in Viet Nam by 2025 and perspectives for 2050 (Định hướng quy hoạch tổng thể phát triển đô thị Việt Nam đến năm 2025 và tầm nhìn đến năm 2050). Hanoi: Author.
- Müller, D., & Munroe, D. K. (2005). Tradeoffs between rural development policies and forest protection: Spatially explicit modeling in the Central Highlands of Vietnam. Land Economics, 81, 412–425.
- Nguyen, Q. A. (2003). Vietnam, changes in place-name and administrative border 1945–2002 (in Vietnamese: Việt Nam, những thay đổi địa danh và địa giới hành chính 1945–2002). Hanoi: Hanoi News Publishing House.
- Pan, X.-Z., & Zhao, Q.-G. (2007). Measurement of urbanization process and the paddy soil loss in Yixing city, China between 1949 and 2000. Catena, 69, 65–73.
- Pham, M. H., & Yamaguchi, Y. (2007). Monitoring land cover change of the Hanoi city centre under impacts of urbanization by using remote sensing. International Journal of Geoinformatics, 3, 55–61.
- Pham, H. M., Yamaguchi, Y., & Bui, T. Q. (2011). A case study on the relation between city planning and urban growth using remote sensing and spatial metrics. Landscape and Urban Planning, 100, 223–230.
- Popular Committee of Hanoi (2011). Decree 40/2011/QD-UNBD on transforming the use of gardens, ponds and agricultural land into residential land in Hanoi. Hanoi: Popular Committee of Hanoi.
- Puyravaud, J.-P. (2003). Standardizing the calculation of the annual rate of deforestation. Forest Ecology and Management, 177, 593–596.
- Quang, N. V., Minh, N. H., Mai, N. X., Huong, P. Q., & Thang, N. V. (2005). The impact of urbanisation on agriculture in Hanoi. Results of interviews with district and municipality officials (EU 5th Framework INCO2 funded research project, contract no.: ICA4-CT–2002–10025). The Hague: Wageningen UR.
- Riitters, K. H., O’Neill, R. V., Hunsaker, C. T., Wickham, J. D., Yankee, D. H., Timmins, S. P., … Jackson, B. L. (1995). A factor analysis of landscape pattern and structure metrics. Landscape Ecology, 10, 23–39.
- Rocchini, D. (2005). Resolution problems in calculating landscape metrics. Journal of Spatial Science, 50, 25–35.
- Su, S., Jiang, Z., Zhang, Q., & Zhang, Y. (2011). Transformation of agricultural landscapes under rapid urbanization: A threat to sustainability in Hang-Jia-Hu region, China. Applied Geography, 31, 439–449.
- Su, S., Xiao, R., & Zhang, Y. (2012). Multi-scale analysis of spatially varying relationships between agricultural landscape patterns and urbanization using geographically weighted regression. Applied Geography, 32, 360–375.
- Trosset, M. W. (2009). An introduction to statistical inference and its applications with R. Boca Raton, FL: Chapman and Hall/CRC.
- Tscharntke, T., Klein, A. M., Kruess, A., Steffan-Dewenter, I., & Thies, C. (2005). Landscape perspectives on agricultural intensification and biodiversity – Ecosystem service management. Ecology Letters, 8, 857–874.
- Turner, G. M., Gardner, R. H., & O’Neill, R. V. (2001). Quantifying landscape pattern. In Landscape ecology in theory and practice (pp. 93–134). New York, NY: Springer-Verlag.
- United Nations. (2008). World urbanization prospects: The 2007 revision highlights. Retrieved from http://www.un.org/esa/population/publications/wup2007/2007WUP_Highlights_web.pdf
- van den Berg, L. M., van Wijk, M. S., & van Hoi, P. (2003). The transformation of agriculture and rural life downstream of Hanoi. Environment and Urbanization, 15, 35–52.
- Wilcove, D. S., McLellan, C. H., & Dobson, A. P. (1986). Habitat fragmentation in the temperate zone. In M. E. Soulé (Ed.), Conservation biology (pp. 237–256). Sunderland, MA: Sinauer.
- With, K. A., Pavuk, D. M., Worchuck, J. L., Oates, R. K., & Fisher, J. L. (2002). Threshold effects of landscape structure on biological control in agroecosystems. Ecological Applications, 12, 52–65.
- World Bank (2011). Vietnam urbanization review. Hanoi: Author.
- Xiao, J., Shen, Y., Ge, J., Tateishi, R., Tang, C., Liang, Y., & Huang, Z. (2006). Evaluating urban expansion and land use change in Shijiazhuang, China, by using GIS and remote sensing. Landscape and Urban Planning, 75, 69–80.
- Xie, Y., Mei, Y., Guangjin, T., & Xuerong, X. (2005). Socio-economic driving forces of arable land conversion: A case study of Wuxian City, China. Global Environmental Change, 15, 238–252.
- Xie, Y., Yu, M., Bai, Y., & Xing, X. (2006). Ecological analysis of an emerging urban landscape pattern – Desakota: A case study in Suzhou, China. Landscape Ecology, 21, 1297–1309.
- Xu, H. (2006). Modification of normalised difference water index (NDWI) to enhance open water features in remotely sensed imagery. International Journal of Remote Sensing, 27, 3025–3033.
- Yu, X. J., & Ng, C. N. (2007). Spatial and temporal dynamics of urban sprawl along two urban–rural transects: A case study of Guangzhou, China. Landscape and Urban Planning, 79, 96–109.
- Zeeuw, I. H.d. (2004, October 10–14). The development of urban agriculture; some lessons learnt, In International conference: ‘Urban agriculture, agro-tourism and city region development, Beijing.