
Abstract
The European Union has defined an ambitious objective for the future concerning sustainable land use to stop the process of land take by 2050. But can this objective be reliably monitored? In this paper, which is based on the case study of Luxembourg and the neighbouring regions, we show that the tools that are used to monitor land-take produce different results that prevent from comparing the figures from one region to another. Moreover, a comparison of the strategic documents related to land use in this cross-border region shows that land-use policies are the product of very different contexts and relationships towards land as a resource, which need to be addressed with tailored strategies.
Introduction
The conversion of natural and agricultural land into ‘artificialised’ areas is a quite recent concern, but it is considered more and more seriously. Scientists have brought the phenomenon to the attention of the media by insisting on man’s influence on land cover, for instance with this kind of ‘warning sentence’, published in Science in 2005: “Short of a collision with an asteroid, land use by humans is the most significant impact on the world’s biosphere” (Foley et al., Citation2005, p. 570). Changing land cover can indeed imply the alteration of a whole ecosystem and thus, can impact on the well-being of men (Bieling, Plieninger, & Schaich, Citation2013). Although large-scale deforestation around the globe receives a great deal of media attention, change of land use due to urbanisation in Europe is still a largely misrecognised issue for the general public. According to the Corine Land Cover (CLC) project, a 1000 km2 of land has been artificialised between 1990 and 2000 each year in Europe, and 920 km2 between 2000 and 2006. The relative increase in land take is much faster than that of demographic growth. The total surface occupied by cities in Europe has increased by 78% between 1950 and the middle of the decade 2000–2010 while the European population grew by only 33% (European Environment Agency, Citation2006, p.11). The reduction in the number of people per household as well as new ways of living (associated with strong increases in average incomes) has led to a significant growth in the amount of artificialised area per inhabitant. At the same time, the surface used for economic activity has also grown considerably, and so have roads, parking places, railway and other infrastructure projects linked to transport. This expansion has most often been at the expense of agricultural land and can potentially harm both environment and economic development. Indeed, land take primarily results in significant losses in biodiversity linked to the physical shrinking of biotopes as well as the fragmentation of habitats for fauna and flora (Haines-Young, Citation2009). In addition, soil sealing has led to an increase of the risk of flooding and reduces the capacity for underground reservoirs to be replenished (Scalenghe & Marsan, Citation2009). Urban sprawl in general is also responsible for the rise in greenhouse gas emissions, linked to an increase in private car use (MEDDTL, Citation2012). As regards the economic impact of changes in land use, the loss of agricultural land is also a matter for concern. For certain authors, the desertification processes linked to global warming in the Mediterranean regions may, over a long term, increase their dependence on northern agricultural regions that are the ones most affected by urban sprawl (Thomas, Citation2011). Moreover, the public costs linked to the development of roads and other networks in sprawled urban environments are much higher than in compact ones (Camagni, Gibelli, & Rigamonti, Citation2002). Lastly, urban sprawl is also held accountable for its potential effects on socio-residential segregation (Le Goix, Citation2005). Several studies of the causes that lead to land take have already been conducted (Verburg, Ritsema Van Eck, De Nijs, Dijst, & Schot, Citation2004; Zoppi and Lai, Citation2014), and they all show the diversity of the factors that drive this phenomenon. With respect to habitat and urban sprawl, researchers have emphasised the democratisation of car use (Dupuy, Citation2006), residential preferences (Howley, Scott, & Redmond, Citation2009; Kaplan & Austin, Citation2004) and even the price differentials between housing in the city centre in relation to the suburbs (Abelson, Citation1997). However, habitat is not the only factor leading to urban sprawl. Industrial and commercial zones, roads and leisure areas also contribute to reducing natural and agricultural areas. The causes of the widening of the urban environment are therefore numerous. Bhatta (Citation2010) counted no less than 25 different ones. At the European Union (EU) level, the impressive rhythm of land conversion contradicts the European Spatial Development Perspective (ESDP) (European Commission, Citation1999) of sustainable territorial development. This is the reason why the EU has formally set itself a clear target in the context of the ‘Roadmap to a resource efficient Europe’ (European Commission, Citation2011a): to achieve the aim of zero net land take by 2050. This objective has the merit of its simplicity, but can such a quantitative objective be reliably assessed with the actual tools, and therefore be efficiently pursued? The aim of this article is to contribute answering this question based on a comparative analysis of Luxembourg and the neighbouring countries. The results are based on a study realised for the Ministry for Sustainable Development in Luxembourg, on whose behalf we have tried to monitor the rhythm of land take at a very accurate scale, in order to define quantified objectives at the local level that are in line with the Community target.
In the first part, we will give an overview of the various conceptual approaches used in discussing the conversion of natural or agricultural surfaces into artificialised areas taking the latest research into account. This first part will also highlight the complexity of assessing the phenomenon of land take by showing the diversity of tools that exist, first at the EU level and second for Luxembourg, a fast-developing country that makes an ideal case study. In the second part, we will compare land-use policies related to land take in Luxembourg and in the neighbouring territories of Germany, France and the Walloon region of Belgium. Through this comparative approach, we will highlight the fact that management strategies may differ not only according to their conceptual foundations, but also depending on the contexts, scales and the specific aims that are addressed in each country.
Different ways of understanding and monitoring the phenomenon of land consumption
First of all, land take (sometimes called ‘land consumption’ or ‘land artificialisation’), refers, according to the European Directorate General for the Environment, to “the increase of artificial surfaces (housing areas; green urban areas; industrial, commercial and transport units; road and rail networks; etc.) over time”, etc. (European Commission, Citation2011b, p. 15). This definition could be questioned. Indeed, speaking of the increase of artificial surfaces implies that the previous status of these surfaces was, by contrast, ‘natural’. But the degree of ‘naturalness’ of land is difficult to evaluate from a methodological point of view, especially when using remote sensing tools, which are the most common sources of information for studying land cover (Batista E Silva, Lavalle, & Koomen, Citation2012). Indeed, a cultivated field or a commercial forest are far from having the same natural attributes, in terms of biodiversity, as other areas often classified as being ‘non-artificialised’. They are planted and managed to be highly productive and, as such, do not share the characteristics of areas that are naturally preserved. Inversely, should the urban fabric necessarily be considered as opposed to nature? Many plants and animal species thrive in urban environments and certain cities can host twice as many species of plants as arable land or commercial forests (Landolt, Citation2001). At the same time, the notion of land take represents the risks and the limits of classifying land cover dichotomously as either natural or artificial.
In addition to this notion of land take, the notion of soil sealing seems to be more objective. A report commissioned by the EU gives the following definition:
Sealed soils can be defined as the destruction or covering of soils by buildings, constructions and layers of completely or partly impermeable artificial material (asphalt, concrete, etc.). It is the most intense form of land take and is essentially an irreversible process. (European Commission, Citation2011b, p. 25)
Sealing a soil alters its physical properties in such a way that rainwater can no longer be absorbed. This notion is often used to refer to the growth of a city (roads, parking lots, buildings), and in this sense it seems more objectively measurable than the notion of land take. Yet it can also refer to land sealed by simple compaction of agricultural land through the passage of heavy plant or the action of rain without any building activity taking place. The latter process is called ‘natural sealing’ (Scalenghe & Marsan, Citation2009), and it is a fact that agricultural and forestry exploitation are the main contributors to soil sealing on a global scale (Van Den Akker & Canarache, Citation2001).
In parallel to these two approaches, there is a third one that answers to the needs of the local administration, and which often uses a very different method, that is building plots. The unit of analysis corresponds to a basic unit of ownership. This administrative approach to the issue of land take evaluates the stock of land available for different types of use. A parcel of land on which a building has been constructed between two dates thus changes its status completely, from ‘non-built’ to ‘built’, even though part of the plot may not change the actual nature of its land cover (garden, park, etc.).
The problem with these various approaches is that they are often indistinctly used to refer to the more general issue of the loss of natural or agricultural surfaces. This lack of a precise and common definition of the phenomenon at stake affects the credibility of a purely quantitative policy target at the EU level that could be translated into national programmes. Notwithstanding this problem, the National Plan for sustainable development in Luxembourg has set the objective to limit to one hectare (ha) per day the process of land take by 2020. This document was drafted in 2007, but in order to translate this national objective into the local context, we have been asked to quantify the rhythm of land take more precisely. During this mission, we have been confronted with a profusion of different data sets, all with very different results that affect the credibility of the 1 ha goal, as we will see later in this article. Of course, each technique used has produced its own results, which need to be interpreted with caution, whether they result from field surveys or from image interpretation.
Seven different data sets will be presented below. They all relate to land cover or land use and they all paint a different picture of the phenomenon of land consumption. As a reminder, land cover refers to the physical characteristics of an area, for example, the vegetation growing there or the presence of buildings, whereas land use describes the economic or social functions taking place on it. Although the links between the two types of approach are close, they are also complex (Haines-Young, Citation2009). One type of cover could host different uses (e.g. a forest that combines productive, recreational and environmental uses) and, inversely, various covers can be harnessed for a single use, as in the case of mixed farming. The seven sources of information compared in this paper refer to the three forms of land ‘consumption’ evoked earlier: land take, soil sealing and building plots.
Measuring land consumption
The most commonly used data set in intra-European land cover comparisons comes from the CLC project directed by the European Environment Agency. It is a project based on the processing of satellite images taken during the years 1990, 2000 and 2006 (the data set for 2012 is in production). The classifications used to define the different zones relate both to land cover and land use through an interpretation of satellite images. There are various levels of detail in this nomenclature, and the least nuanced one distinguishes artificial surfaces, agricultural land, forests, swamps and water. It is this first distinction that forms the basis for our identification of artificial cover in the remainder of the article. The CLC data set for the whole of the EU presents a spatial unit (Minimal mapping unit) of 25 ha represented through square blocks. As far as changes in land cover are concerned, these are only identified if their contiguous surface area is greater than 5 ha. While this level of detail is fine for large-scale international comparisons (see ), it cannot provide a meaningful database for local approaches (Siedentop & Meinel, Citation2004). Another limitation of this tool is its high error rate with respect to interpretations (Batista E Silva et al., Citation2012) and to analyses of dynamics, especially between 2000 and 2006 (Diaz-Pacheco & Gutiérre,z, Citation2014). Although this harmonised data set may constitute an interesting step towards the ‘goals of comparison and generalisation’ that are crucial to the land-use scientific community (Rindfuss et al., Citation2008), we decided not to use it for assessing the evolution of land take in the Grand-Duchy of Luxembourg because of its lack of precision at this spatial scale.
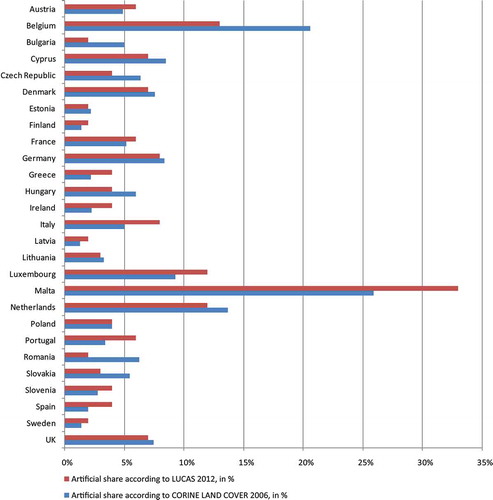
Figure 1. Comparison of the rates of artificial surfaces between land use/cover area frame statistical survey (LUCAS) and Corine Land Cover.
The second source of information mobilised in our study is the Urban Atlas (European Commission, Citation2006), realised for European cities with more than 100,000 inhabitants. It is based on high-resolution satellite images and it provides a scale of reference of 1:10,000 and a minimum mapping unit of 0.25 ha. Its resolution is higher than CLC, but unfortunately it is currently only available for 2006. For this reason, we could not use this tool to assess the dynamics of land take in Luxembourg.
The third source of information presented here derives from the processing and interpretation of orthophotos. It is called biophysical occupation of land (OBS, for Occupation biophysique du sol) and has been produced for the Grand-Duchy of Luxembourg. A total of 900 aerial photographs taken at a scale of 1:15,000 were needed to cover the whole country, with its 2586 km2. The project was realised by a private company on behalf of the Ministry of Environment. In contrast to the CLC method described earlier, the land area is not divided up into units of equal size. The classification, which includes details for both land cover and land use, contains 91 levels with substantial information on the nature of the land farmed or its forests. The level of spatial detail is largely superior to that of CLC and even to Urban Atlas. We have used this GIS data set to assess the extent of the phenomenon of land take in Luxembourg, based on the evolution observed between 1999 and 2007.
Lastly, another source of information for land take has been created and made available at the EU level: LUCAS (Eurostat, Citation2013a) or ‘Land use/cover area frame statistical survey’. This was realised for the years 2006, 2009 and 2012 (though the year 2006 cannot be compared to the others for methodological reasons). A group of 750 investigators conducted surveys in more than 270,000 spots in Europe and methodically recorded data on the cover and use of land. This database was initially created to generate agro-environmental indicators regarding changes in land cover and to check and validate other information sources such as CLC (Batista E Silva et al., Citation2012). It is also been used to generate statistics on land cover and use at the European level (Eurostat, Citation2013b), with the explicit heading ‘Artificialised spaces’. For this purpose, however, the information given about the degree of artificialisation for each country is only a rough estimation based on the sample from observation spots. For example, 216 observations were effected for Luxembourg in situ, that is to say, one observation on average per 12 km2. The size of each spot described varies between 0.5 and 10 ha (Eurostat, Citation2013c). Considerable differences appear when comparing the results of this research with those of CLC, as is shown in .
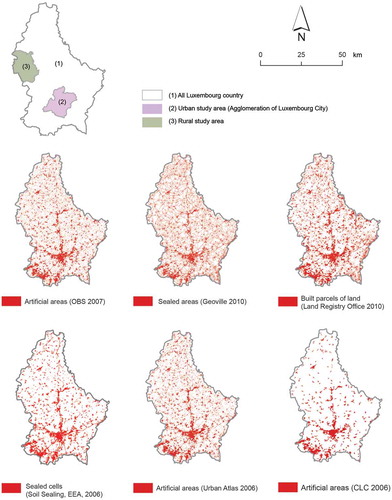
Figure 2. Comparison of the results from different acquisition methods.
For some countries, the difference is extremely important. LUCAS (even though more recent by 6 years than CLC) gives values for the totality of artificial surfaces that are lower than CLC for countries like Belgium (−7.6%) or Romania (−4.6%). In fact, the LUCAS results only reflect the dynamics of land cover changes for the selected spots, and the data expressed at the scale of a whole country correspond to an extrapolation and not to a real observation. Such differences in terms of data related to land cover do not convey a clear and understandable message for policymakers and the general public.
Measuring soil sealing
The first source of information related to soil sealing in the Grand-Duchy of Luxembourg and presented in this paper is entitled EEA Soil Sealing Map. It was produced for the European Environment Agency. The data have been generated by processing high-resolution satellite images taken by SPOT 4/5 (Earth Observation System) and LISS (Linear Imaging Self Scanning Sensor). The results have been made available for the public through a raster file composed of mosaics of 10,000 m2, in order to correspond to the CLC layer. Each pixel has a value expressing the degree of sealing, in percentages, for the corresponding surface. This evaluation of soil sealing presents the same advantages as the original file on which it is partly based (CLC), that is to say that it allows international comparisons, but it also has the same limitations when used for more precise analyses. This is the reason why this data set has not been mobilised in our study to assess the evolution of the phenomenon of soil sealing in Luxembourg.
The second information source is a GIS file based on aerial photographs, which differentiates between built-up spaces, roads and other parts of the transport network and non-sealed spaces. The technique used is dynamic segmentation whereby the pixels of an image (an orthophoto, for example) are grouped according to segments sharing a homogenous spectral signature. The spatial scale of the image produced is extremely precise with all buildings over 25 m2 being represented. However, the data are only available for the perimeters of urban agglomerations. For the rest of the country, complementary information relative to roads and farms has been added to complete the information. Secondary visual checks have been undertaken in order to verify the results produced by automatic image processing. These different steps make this database very precise but also, of course, very costly. This is why the use of such a source of information is limited to small territories. This is the data set that we have used to gauge the phenomenon of soil sealing.
Measuring the building of plots
The final source of information presented here comes from a cross between digitalised land registry files and visually checked orthophotos, so that it is possible to establish whether a parcel of land is ‘built’ or ‘non-built’. The spatial data unit represented expresses the notion of ownership: the plot of land. The plots that are considered as being built can potentially have gardens, which, though not sealed, are no longer available for construction. This data set is used, in Luxembourg, by the Ministry for Housing to quantify the availability of building plots in the different localities of the country. This data set is considered as a tool for supporting strategic decision-making with respect to the allocation of new land for urban development. It is not really used to quantify the loss of natural and agricultural land.
Comparing the results for the same territories
These seven different sources of information all illustrate the phenomenon of agricultural or natural land consumption in some way. However, they are all very different, whether in terms of their point of view (land take, soil sealing, building of land plots), the data sources used (satellite images, orthophotographs, land registry files) or their spatial resolution. summaries all the information held in these different databases as well as the dates for which they are available.
Table 1. Summary of different information sources.
In order to improve the comparison between the different sources of data (see ), we have chosen to keep the closest years that were available (2006 and 2007) rather than the most recent data available for each source. Three areas have been studied: the Grand-Duchy as a whole (2586 km2), then the most urbanised region of the country, which corresponds to the agglomeration of Luxembourg City (202 km2), and, lastly, a rural area corresponding to the administrative unit of the canton of Rédange-sur-Attert (213 km2), in the west of the country.
Table 2. Comparison of different data relative to land cover in Luxembourg.
The comparison of CLC for 2006, Urban Atlas for 2006 and OBS for 2007 gives insignificant differences at the level of the urban agglomeration of Luxembourg City. According to CLC, 28.2% of the territory of the agglomeration can be considered as being artificialised, whereas Urban Atlas gives a value of 27.3 and OBS 25.5%. In contrast, there are considerable differences for the rural case study. The rates of land take are 3.3% for CLC and 5.9% for Urban Atlas, which is more precise and can detect smaller artificial areas with greater accuracy. As regards OBS, the value is much higher, at 11.4%. This underestimation by CLC is due to a lack of precision, given its minimal mapping unit of 25 ha, which does not allow one to take into account the land covered by numerous hamlets and even small villages that are identified in OBS. Even though Urban Atlas is based on high-resolution images, the precision appears to be a little bit lower than OBS. At the level of the country as a whole, the difference is 1.7 percentage points between CLC and OBS and only 0.3 between Urban Atlas and OBS. The overestimation of land take in urban areas thus offsets the underestimation in rural areas. Though the results of CLC seem acceptable at country-wide level, they are clearly not adapted to more precise analyses on smaller territories. As regards the data from LUCAS, it could not be used at regional level and the only value available is an average rate for the whole country, estimated at 12% in 2012 (Eurostat, Citation2013a). We have not translated this relative value into an absolute one.
As regards soil sealing, comparisons between the data from the EEA Soil Sealing Map (2006) and GEOVILLE (2007) also reveal greater or lesser differences, depending on the nature of the territory studied. For the densely populated urban areas (agglomeration of Luxembourg City) only little difference can be observed: the EEA Soil Sealing Map shows 14.7% of the land as sealed and GEOVILLE 15.1%. For the rural area, a much greater difference appears (4% of soil sealing for GEOVILLE against only 1.7% for CLC). The weak spatial resolution of the EEA Soil Sealing Map combined with a simple average estimation of the degree of soil sealing per each areal unit of 25 ha give a net underestimation of the rate of sealing. However, at the level of the country, the difference is only 2.3 percentage points between the two sources of information. The underestimations or, inversely, the overestimations in other areas in the EEA Soil Sealing Map balance each other out relatively well.
For built plots the values appear to be close to those given by GEOVILLE for soil sealing. Despite this similarity, this data set reveals a different phenomenon, which is the decrease of the stock of plots available for urbanisation in the future.
Beyond these figures, which show a snapshot at a given moment, it is also possible to compare the rates of land consumption for each approach, even if this perspective would be slightly skewed because of the different dates for which data are available. Nevertheless, this last point should not be considered as a serious problem for comparing the reliability of the tools. Indeed, studies have shown that despite the effect of the economic crisis on GDP growth, the average annual population growth in Luxembourg has remained steady over the period before and after the economic crisis (Decoville, Feltgen, & Durand, Citation2013). The rate of increase in job creation has been a bit slower between 2009 and 2012 (+2.6% per year) than between 2000 and 2006 (+3.2% per year), but if we take both these factors, which are the key drivers of land take, into account, a comparison of the data sets for these two different periods makes sense.
We propose two indicators at the level of the country of Luxembourg: the absolute yearly increase in land consumption and the average annual rate (see ).
Table 3. Comparison of land consumption dynamics in Luxembourg according to the different statistical sources.
For the same phenomenon of soil sealing, comparison of the data supplied by CLC and OBS highlights the difference in precision between the two instruments. Once again, the comparison between these multiple information sources shows the extraordinary variability of the results obtained. Such differences raise questions about the relevance of a policy approach that defines specific and quantitative objectives in terms of land-take reduction.
In Luxembourg, our study has seriously affected the credibility of the 1 ha objective since it shows that the actual rhythm is far below this target. This problem of data quality may arise for all the small territories (small countries or regional territories), since the CLC project, which is the one tool broadly used to grasp the phenomenon at the European level, appears to be not precise enough. These reservations with respect to the definition of quantified objectives at the EU level are accentuated by the fact that the policy priorities strongly differ from one country to another, as the following parts will show.
The different strategies followed to reduce land take answer to specific policy considerations with respect to land as a resource
The objective of stopping land take by 2050 has been advocated by the Commission based on a modest forecast for the demographic growth rate in Europe. As a consequence, urban development is seen as being achievable within a total artificialised area of constant dimensions, offsetting new urban growth by ‘renaturing’ other surfaces. This objective is preceded by another one for the period 2000–2020: bringing down the average annual increase in land take in Europe from 1000 to 800 km2. The EU has no enforceable framework for achieving these goals, but it has tried to make actors more aware of the issues of land take (European Environment Agency, Citation2010) and soil sealing (European Commission, Citation2011b). However, this objective hides a complex mosaic of situations, linked to specific growth patterns that are peculiar to each territory. The way the issue of land take is considered in the different EU countries reflects, in a certain way, the relationship that societies have with their land resource. These relationships are nourished by historical, cultural, economic and political legacies rooted in local contexts. Planning methods, with all their history and privileged paradigms, also play an important role in the management of urban sprawl and therefore land take (Halleux, Marcinczak, & Van Der Krabben, Citation2012).
For the last 10–20 years, most European countries have adopted strategic planning orientations in order to promote a sustainable development of their territory, following the principles of the ESDP and the Territorial Agenda. However, these strategies differ sharply concerning the issue of land take and only a few countries have put in place quantified objectives or precise executable plans at regional or local level. Most of the initiatives consist in non-binding orientations rather than strict rules for planning documents. However, some countries have defined quantitative objectives that can be monitored, but whereas the objectives are formulated by the central government, it is the regional authority or the local one (which delivers planning permission), which is responsible for their implementation. The document ‘Report on best practices for limiting soil sealing and mitigating its effects’ (European Commission, Citation2011b) commissioned by the Directorate General for the Environment of the European Commission thus takes up certain directives addressed to the various administrative-political units. The emphasis is laid on the importance of vertical coordination of political decision-making. It is therefore recommended that central governments monitor the levels of land take, raise awareness about economical land management and financially support urban development on already artificialised areas instead of fostering wider suburban or scattered developments. The regions are expected to set precise ceilings for the consumption of natural or agricultural land. They should also provide training opportunities to local authorities in order to enable them to cope better with the issue of urban sprawl. Local authorities should also establish offsetting mechanisms to compensate for losses of new surfaces. Building permissions should also respect green belts and be more compact (European Commission, Citation2011b). Until now, six countries of the Union have fixed quantitative objectives for limiting land take, in very different ways (see ).
Table 4. The quantitative objectives for limiting land take in Europe.
The objectives formulated at national levels sometimes define precise quantitative objectives concerning the level of land take that should not be exceeded (Germany, Luxembourg, Austria). In some countries, targets are expressed in relative decreases (France) and in others they simply mention where housing development should take place (Great Britain, Flanders). In the Netherlands, it is left to the Provinces to determine any objectives (sometimes quantified) in relation to the reduction of land take. It has to be noted that does not include a number of other orientations which have a direct impact on land take even if their primary objective lies elsewhere. Thus, we can cite the Planning Act of Denmark that forbids the development of commercial centres greater than 3000 m2 outside of cities in order to foster the attractiveness of central urban areas and to limit urban sprawl.
These elements show the diversity of measures taken by each country and the absence of harmony between national objectives in relation to the aim formulated by the European Commission to halt the net progression of land take by 2050. These different approaches to land consumption reflect the variety of relationships between a society and its land resource, something that can be verified when looking at the motives given to support the different strategic choices adopted by each country.
In order to highlight the different policy priorities that lie behind the objectives of reducing land take, we will now focus on Luxembourg and its neighbouring countries or regions. Such a comparison is relevant since these territories are highly integrated in terms of functional dynamics at a cross-border scale (Decoville, Durand, Sohn, & Walther, Citation2013), and since they are all involved in the building of a common spatial planning orientation. These neighbouring territories are the countries of Luxembourg, Germany and France and the Region of Wallonia in Belgium. They show different situations as regards the question of their land resource. There are large differences between their shares of artificialised land as well as the average number of square meters per inhabitant that is artificialised (see ).
Table 5. Data relative to artificialised surface (CLC 2006) in the different territories.
A comparative analysis of the argumentation and discourses used to legitimise the measures undertaken in order to reduce land take in different countries illustrates the complexity of policy harmonisation.
In Germany: protecting the stock of unspoilt land
In Germany, the question of limiting land take is part of a general strategy for sustainable development (Bundesregierung, Citation2002), and constitutes the most important document relative to the environmental stakes at a federal level. Land is presented as a scarce resource that should be used with parsimony. The document recalls that 115 ha of ‘natural land’ have been taken daily between 2004 and 2007, (80% for building and 20% for transport). It is further specified that half of those 115 ha correspond to sealed soil. The methodology used by the German authorities to evaluate this land take is based on data produced by the land registry departments of the various Länder. In order to raise public awareness, comparative elements have been introduced that help the mental representation of the phenomenon and try to make the necessity for immediate action convincing. For example, it is mentioned that this surface represents around 100 football pitches per day (Bundesregierung, Citation2002: 99). The arguments used draw on both ecological and recreational justifications: “Durch Flächeninanspruchnahme und -zerschneidung nimmt der Lebensraum für Tiere und Pflanzen ebenso ab wie die Erholungslandschaften für die Menschen, die am Wochenende immer weitere Strecken zurücklegen, um die Natur zu kommen” Footnote1(Bundesregierung, Citation2002, p. 99). The rhetoric used opposes urban to “natural” space in a dichotomous way, seeing the latter as a haven for plants and wildlife. This symbolic opposition does not dwell on a precise description of the biodiversity of the land taken. It should be noted that woodland, which most often represents nature in its most ‘wild’ state in collective representations, is not fundamentally affected by land take since its surface area has actually increased between 1950 and 2000 in Germany (Fischer, Jöst, Klauer, & Schiller, Citation2009). It is rather suburban agricultural land, less emblematic of ‘Nature’, which has decreased in surface due to the expansion of urban areas. In response to this process of land use change, the Federal Council has come up with a very ambitious objective: limiting land take to 30 ha per day by 2020. This is the specific goal established in the land use section of the national strategy for sustainable development
At local level, some governments have come up with regulations that derive from the same concern to protect unspoilt land. Thus, in 2002 the city of Dresden put in place a relatively strict compensation scheme for land take: the Bodenausgleichskonto. Each new land take is to be offset with a compensatory action, the overall aim being to limit the built surface in the communal perimeter to a maximum of 40%. The measures consist of the ‘greening’ of surfaces equivalent in size to those taken for urban development. The position of the German federal authority with regard to land take appears to be very quantitative, giving but little heed to local context in its formulations. Such a proactive position with respect to protecting unspoilt land is not surprising in a country with a long and rooted tradition of political ecology. We could even say that with this powerful ecological backdrop the question of land use (Bodennutzung) has been put centre stage.
In France: ‘mother earth’ has to be protected
The way the French national government approaches the issue of land take is rather different from the previous example since its main line of reasoning is based on defending agricultural interests. Thus, the chief quantified objective at national level is expressed in the presentation of the motives for the Law for Modernising Agriculture and Fisheries (LMAP) that was adopted on 27 July 2010. It aims to halve the rate at which agricultural land is taken by 2020. The powerful National Federation of Farmer’s Unions (FNSEA) claims a role in the incorporation of this goal into the law which is clearly aimed at protecting agricultural land.
The document that raised public awareness with respect to land take problems, drafted by the General Commission for sustainable development, uses the terms ‘land take’ and ‘soil sealing’ indiscriminately and presents the problem in the following terms: “soil sealing compromises, often irreversibly, its use for the growth of consumables or non-consumables. In about half of the French regions, it is the land with most agronomic potential that is most affected” (Commissariat général au développement durable, Citation2011, p. 1). It is obvious that this document, approved by an interministerial committee supervised by the Ministry for Ecology, emphasises the agricultural consequences of the phenomenon at the expense of the ecological ones. In order to reach this goal, LMAP has set up departmental commissions for agricultural land consumption (Commissions Départementales de Consommation des Espaces Agricoles), chaired by the prefect and gathering together representatives from local land collectives, the government, farmers, landowners, notaries and environmental protection agencies. The task of this commission is to review any development or revision of local urban development plans that would entail a loss of agricultural land (Ministère de l’agriculture, de l’alimentation, de la pêche, de la ruralité et de l’aménagement du territoire, Citation2012). The information source used to chart the progression of land take at national level is the Teruti-Lucas programme (since 2006), commissioned by the Ministry for Agriculture and based on fieldwork. In addition to this opposition to land take rooted in an agricultural perspective, various environmental protection agencies have also been active. The Federation of environmental associations France Nature Environnement has launched a communication campaign on this topic with the target to stop land take altogether by 2025 (France Nature Environnement, Citation2013).
The conceptual basis for the national policies in Germany and France are quite different, and placing them side by side highlights the different approaches to tackling the phenomenon. The Wallonia Region offers another approach to the issue of land take.
In Wallonia: the protection of land long neglected for the sake of other interests
Planning policy is relatively recent in Belgium. The first law was passed in 1962 and the district plans, the only ones that are enforceable with respect to land use, were drafted at the end of the 1970s (De Decker, Citation2008). Since the setting of strategic goals and their practical implementation are down to the regions, let us see how Wallonia, bordering France, Luxembourg and Germany, positions itself in relation to the management of its land resource. The first Regional Walloon Spatial Development Scheme Schéma de développement de l’espace regional (SDER), from 1999, explicitly raises the issue of a more ‘restrained’ rate of land take but it remains general and has no precise objectives. In the new SDER (Wallonia Region, 2013), which is in the process of being updated, the reduction of urbanisation in rural areas is expected to be given high priority. In this new version of the Regional spatial development scheme, objectives have been put in place for limiting the process of urbanisation. The aim is to reduce the annual rate of new land take to 1200 ha by 2020 and then to 900 ha per year by 2040. These goals have to be compared to the dynamics observed over the last 30 years, which have shown an average annual consumption of natural and agricultural land of around 2000 ha.
To understand why protection of the land resource has not been considered sooner in a country which is otherwise so densely populated and shows such a high rate of artificialisation (), one has to consider the political interests attached to housing policies followed since the end of the nineteenth century. Already at this time, house ownership was advocated in the whole of Belgium through numerous fiscal breaks related to construction and was supported by a dense network of tramways which allowed workers to reach their places of work easily. During the twentieth century this trend for individual housing in the suburbs became ingrained, especially during the growth years after the war and also thanks to the fast spread of mortgage credit. Today, despite the effects of the economic crisis, all political parties in Belgium defend private property ownership, as they are conscious of the fact that it can mitigate the risks of poverty for those households who have already achieved full ownership (De Decker & Dewilde, Citation2010). This will to keep prices low, however, has contributed to a glut of building plots, which, of course, has not fostered compact urban development models. In the collective imagination, land is seen as an ‘ordinary good’, ‘not being scarce’ (Acosta, Citation1994; Halleux, Citation2001, p. 18), and therefore not in need of special protective measures. At the end of the 1990s, Belgium became the country in Europe with the second highest average living space allocated to new development (1314 m2) despite its high density (Dubois, Citation2005), and with one of the highest rates of land take and soil sealing. The long standing lack of concern in relation to land protection and the primacy given to housing policies can therefore explain the absence of quantified or precise objectives, at least up to the present moment when a new version of SDER is awaiting public consultation. Let us now turn to our last case study, the Grand-Duchy of Luxembourg.
In Luxembourg: the country must be protected from a ‘boom’ in spatial development
The Grand-Duchy of Luxembourg presents a very particular spatial configuration and is exposed to pressures on its territory. Indeed, the very small dimension of the country (2586 km2, the second smallest country in the Union after Malta), and thus the scarcity of land resources, bring with it an acute awareness of the need to put a brake on the rate at which natural or agricultural land is taken. This rate is high and in line with that of demographic growth, the second highest in the Union in relative terms after Cyprus between 2002 and 2012, at 18% (Eurostat, online data).
In many ways, the attitudes of the governing parties in Luxembourg towards land take are comparable to those in Belgium. The novelty of planning policy (the first law was issued in 1974), as well as the many incentives to stimulate property ownership, have led to an important increase in land take related to individual housing development. In addition, between 2002 and 2012, Luxembourg saw an even more important growth in the number of jobs: +32.6%, serviced for more than 40% by cross-border workers (Statec, online). Due to this high share of cross-border workers, Luxembourg has the highest proportion of artificial land devoted to economic activities in Europe: 43% (MEDDTL). Indeed, the residential areas tend to be developed in the neighbouring regions in Germany, France and Belgium. The rhetoric of the National Plan for Sustainable Development (Grand-Duché of Luxembourg, Citation2010) focuses on the ‘runaway’ nature of demographic and economic development, which has led to a massive amount of land take. The consequences invoked are the impact on the quality of the landscape and its biological diversity One could sum up the official discourse of the public authorities as a denunciation of the threats to its patrimony, whether seen as its culture and identity (Landscape), its ecology (biodiversity) or simply its land resources (plots remaining for construction in the future).
Comparing these four national approaches to land take has allowed us to uncover four different strategies resulting from diverse cultural relationships to collective land resources. Whether seeking to protect Nature, farming, landscape or simply plots for future construction needs, the policies all differ. Even the concept of Nature, seen as a social construct (Castree & Braun, Citation2001), does not exist per se, but only through the perception a society has of the world at a given moment. As a consequence, if protecting non-artificialised land resources can be associated with an environmental measure aiming at protecting ‘Nature’, its modes of implementation will evolve according to place, time and the values that are shared by a society. Similarly, the French historical and cultural relation to Nature is traditionally associated with a Cartesian view of the relation between man and his environment, as illustrated by the famous phrase from the Discours de la Méthode of Descartes in which it is written that the use of knowledge is to make men “as masters and owners of nature” (Descartes, Citation1637). It is a stance that still shines through in the prose used to justify measures taken to protect agricultural land. However, this vision is not shared by French nature associations that prioritise the protection of ecosystems. Inversely, the German relation to Nature, which is often characterised as being more contemplative and romantic, is translated in the policy documents through the focus on the protection of natural ecosystems, that is to say, of Nature as a whole.
Conclusion
In this article, we have provided empirical evidence for the limitations present in the monitoring of land take dynamics that should be taken into account before adopting policy objectives. First, we have shown that the tools used at the EU level to evaluate the phenomenon (CLC, Lucas) do not allow accurate comparisons for small territories (Luxembourg, Malta) since they lack precision at this scale. The various data sets sometimes show different tendencies that do not help in raising the awareness of policymakers and, more generally, of societies. In the light of this development, it appears that the ambitious political EU objective to stop net land take by 2050 can hardly be systematically monitored in a relevant way with a single tool. Moreover, we have shown that the strategic documents adopted in several countries concerning land take pursue different objectives influenced by distinct cultural, historical and economic contexts. Therefore, the binary vision of land cover given by the instruments of observation and which distinguishes between a desirable status (non-artificialised areas) and another which should be combated (artificialised areas) appears too simplistic to efficiently answer to the variety of concerns expressed at the scale of the EU as a whole. As a consequence, these findings suggest that policymakers in the different member states should adopt a nuanced perspective with regard to the results of the comparative European studies concerning land take, despite their usefulness in depicting the big trends. A purely quantitative approach to the analysis of land-use dynamics cannot capture, alone, the diversity and complexity of the challenges of each territory.
Notes
1. Through the use and fragmentation of land, the habitat of animals and plants as well as the recreational areas for people, who have to cover ever greater distances to reach Nature in the weekends, is reduced.
References
- Abelson, P. (1997). House and land prices in Sydney from 1931 to 1989. Urban Studies, 34, 1381–1400. doi:10.1080/0042098975475
- Acosta, R. (1994). Politiques foncières comparées: Belgique (43 pp.). Paris: Ed. Adef.
- Batista E Silva, F., Lavalle, C., & Koomen, E. (2012). A procedure to obtain a refined European land use/cover map. Journal of Land Use Science, 8(3), 255–283. doi:10.1080/1747423X.2012.667450
- Bhatta, B. (2010). Analysis of urban growth and sprawl from remote sensing data. Advances in geographic information science (172 pp.). Berlin: Springer-Verlag.
- Bieling, C., Plieninger, T., & Schaich, H. (2013). Patterns and causes of land change: Empirical results and conceptual considerations derived from a case study in the Swabian Alb, Germany. Land Use Policy, 35, 192–203. doi:10.1016/j.landusepol.2013.05.012
- Bundesregierung. (2002). Unsere Strategie für eine Nachhaltige Entwicklung. Retrieved from http://www.bundesregierung.de/Content/DE/_Anlagen/Nachhaltigkeit-wiederhergestellt/perspektiven-fuer-deutschland-langfassung.pdf?__blob=publicationFile&v=2
- Camagni, R., Gibelli, M. C., & Rigamonti, P. (2002). Urban mobility and urban form: The social and environmental costs of different patterns of urban expansion. Ecological Economics, 40, 199–216. doi:10.1016/S0921-8009(01)00254-3
- Castree, N., & Braun, B. (2001). Social nature: Theory, practice and politics (249 pp.). Malden: Wiley-Blackwell.
- Commissariat général au développement durable. (2011). L’artificialisation des sols s’opère aux dépens des terres agricoles (4 pp.). Paris: Ministère de l’écologie, du développement durable, des transports et du logement.
- De Decker, P. (2008). Facets of housing and housing policies in Belgium. Journal of Housing and the Built Environment, 23(3), 155–171. doi:10.1007/s10901-008-9110-4
- De Decker, P., & Dewilde, C. (2010). Home-ownership and asset-based welfare: The case of Belgium. Journal of Housing and the Built Environment, 25(2), 243–262. doi:10.1007/s10901-010-9185-6
- Decoville, A., Durand, F., Sohn, C., & Walther, O. (2013). Comparing cross-border metropolitan integration in Europe: Towards a functional typology. Journal of Borderlands Studies, 28, 221–237. doi:10.1080/08865655.2013.854654
- Decoville, A., Feltgen, V., & Durand, F. (2013). La cohésion territoriale, quels enjeux ? Report for the Ministry for Sustainable Development. Luxembourg. Retrieved from http://www.statistiques.public.lu/fr/actualites/territoire/territoire-climat/2014/06/20140602/20140602.pdf
- Demeritt, D. (2002). What is the ‘social construction of nature’? A typology and sympathetic critique. Progress in Human Geography, 26(6), 767–790. doi:10.1191/0309132502ph402oa
- Descartes, R. (1637). Discours de la méthode. 6e partie (168 pp.). Paris: Bibliothèque de la Pléiade, Gallimard.
- Diaz-Pacheco, J., & Gutiérre,z, J. (2014). Exploring the limitations of CORINE land cover for monitoring urban land-use dynamics in metropolitan areas. Journal of Land Use Science, 9(3), 243–259. doi:10.1080/1747423X.2012.761736
- Dubois, O. (2005). Le rôle des politiques publiques dans l’éclatement urbain: l’exemple de la Belgique. Développement Durable Des Territoires. doi:10.4000/developpementdurable.747.
- Dupuy, G. (2006). La dépendance à l’égard de l’automobile (96 pp.). Paris: La Documentation française.
- European Commission. (1999). ESDP – European spatial development perspective. Towards balanced and sustainable development of the territory of the European Union. Luxembourg: Official Publications of the European Communities.
- European Commission. (2006). Mapping guide for a European Urban Atlas. 31 p. Retrieved from http://www.eea.europa.eu/data-and-maps/data/urban-atlas/mapping-guide/urban_atlas_2006_mapping_guide_v2_final.pdf/download
- European Commission. (2011a). Roadmap to a Resource efficient Europe. Communication from the Commission to the European Parliament, the Council, the European economic and social committee and the committee of the regions, Brussels, 26 pp. Retrieved from http://ec.europa.eu/environment/resource_efficiency/pdf/com2011_571.pdf
- European Commission. (2011b). Report on best practices for limiting soil sealing and mitigating its effects. DG Environment, Authors: Prokop G., Heide Jobstmann H., Schönbauer A., 226 pp.
- European Environment Agency. (2006). Urban sprawl in Europe. The ignored challenge (57 pp.). Luxembourg: European Environment Agency. Publication Office of the European Union.
- European Environment Agency. (2010). The European environment. State and outlook. Land use (49 p.). Copenhagen: European Environment Agency. Publications office of the European Environment Agency.
- Eurostat (2013a). LUCAS. The EU’s land use and land cover survey. Eurostat compact guides. Retrieved from epp.eurostat.ec.europa.eu/cache/ITY_OFFPUB/KS-03-13-587/EN/KS-03-13-587-EN.PDF
- Eurostat. (2013b). Buildings, roads and other artificial areas cover 5% of the EU. Newsrelease 254. Retrieved from http://epp.eurostat.ec.europa.eu/cache/ITY_PUBLIC/5-25102013-AP/EN/5-25102013-AP-EN.PDF
- Eurostat. (2013c). LUCAS 2012. Instruction for surveyors. Technical document, 74 p.
- Fischer, B., Jöst, F., Klauer, B., & Schiller, J. (2009). Is a sustainable land-use policy in Germany possible? University of Heildelberg Discussion paper Series, 484, 1–27.
- Foley, J. A., DeFries, R., Asner, G. P., Barford, C., Bonan, G., Carpenter, S. R. … Snyder, P. K. (2005). Global consequences of land use. Science, 309(5734), 570–574. doi:10.1126/science.1111772
- France Nature Environnement. (2013). L’étalement urbain. Réflexions croisées. Eléments de definition et termes du débat (86 pp.). Paris: Veolia Environnement et France Nature Environnement.
- Gilli, F. (2009). Sprawl or reagglomeration? The dynamics of employment deconcentration and industrial transformation in greater Paris. Urban Studies, 46, 1385–1420. doi:10.1177/0042098009104571
- Grand-Duché de Luxembourg. (2010). Plan national de développement durable. Un Luxembourg durable pour une meilleure qualité de vie (86 pp.). Luxembourg: Ministère du Développement Durable et des Infrastructures.
- Haines-Young, R. (2009). Land use and biodiversity relationships. Land Use Policy, 26, S178–186. doi:10.1016/j.landusepol.2009.08.009
- Halleux, J. M. (2001). Les surcoûts de l’étalement urbain. Etudes Foncières, 94, 8–21.
- Halleux, J.-M., Marcinczak, S., & Van Der Krabben, E. (2012). The adaptive efficiency of land use planning measured by the control of urban sprawl. The cases of the Netherlands, Belgium and Poland. Land Use Policy, 29, 887–898. doi:10.1016/j.landusepol.2012.01.008
- Howley, P., Scott, M., & Redmond, D. (2009). An examination of residential preferences for less sustainable housing: Exploring future mobility among Dublin central city residents. Cities, 26, 1–8. doi:10.1016/j.cities.2008.10.001
- Kaplan, R., & Austin, M. (2004). Out in the country: Sprawl and the quest for nature nearby. Landscape and Urban Planning, 69, 235–243. doi:10.1016/j.landurbplan.2003.09.006
- Landolt, E. (2001). Flora der Stadt Zurich (1421 pp.). Basel: Birkhauser Verlag.
- Le Goix, R. (2005). Gated communities: Sprawl and social segregation in southern California. Housing Studies, 20, 323–343. doi:10.1080/026730303042000331808
- Ministère de l’Ecologie, du Développement durable, des transports et du logement (MEDDTL). (2012). Urbanisation et consommation de l’espace, une question de mesure. La Revue, mars 2012, 106 pp.
- Ministère de l’agriculture, de l’alimentation, de la pêche, de la ruralité et de l’aménagement du territoire. (2012). CIRCULAIRE DGPAAT/SDB/C2012-3008. Commission départementale de consommation des espaces agricoles, 9 pp. Retrieved from http://circulaire.legifrance.gouv.fr/pdf/2012/02/cir_34622.pdf
- Région Wallonne. (2013). Les indicateurs clés de l’environnement Wallon 2012 (162 pp.). Namur: SPW Editions.
- Rindfuss, R. R., Entwisle, B., Walsh, S. J., An, L., Badenoch, N., Brown, D. G., … Verburg, P. H. (2008). Land use change: Complexity and comparisons’. Journal of Land Use Science, 3, 1–10. doi:10.1080/17474230802047955
- Scalenghe, R., & Marsan, F. A. (2009). The anthropogenic sealing of soils in urban areas. Landscape and Urban Planning, 90, 1–10. doi:10.1016/j.landurbplan.2008.10.011
- Siedentop, S., & Meinel, G. (2004). CORINE land cover 2000 in nation-wide and regional monitoring of urban land use and land consumption. CORINE Land Cover Workshop, Berlin. Retrieved from http://www2.ioer.de/recherche/pdf/2004_siedentop_meinel_clc.pdf
- Thomas, J. (2011). Uncontrolled land consumption versus resource saving land use in Germany. Land Tenure Journal, 1, 79–99.
- Van Den Akker, J. J. H., & Canarache, A. (2001). Two European concerted actions on subsoil compaction. Land Use and Development, 42, 15–22.
- Verburg, P. H., Ritsema Van Eck, J. R., De Nijs, T. C. M., Dijst, M. J., & Schot, P. (2004). Determinants of land-use change patterns in the Netherlands. Environment and Planning B: Planning and Design, 31, 125–150. doi:10.1068/b307
- Zoppi, C., & Lai, S. (2014). Land-taking processes: An interpretive study concerning an Italian region. Land Use Policy, 36, 369–380. doi:10.1016/j.landusepol.2013.09.011