
ABSTRACT
Land tenure and land policies influence the spatial variations of land use/cover (LULC) at any given time or place. Thus, it is important to evaluate the role of land tenure policies on land cover changes. In this study, we evaluate the utility of Landsat Thematic Mapper (TM) images in understanding the impacts of the 2000 fast track land reform (FTLR) policy on LULC in the eastern region, Zimbabwe. Landsat images for the year 1995, 2000, 2005 and 2011 were classified using traditional image classification techniques (i.e. the maximum likelihood (ML) classifier) in a geographic information system (GIS) environment. Results indicate that forested areas drastically decreased by approx. 30% between the year 2000 and 2005 (during and after the FTLR), while croplands marginally increased by (approx. 30%) the results further showed that slight increase in bare lands (degraded lands) and disturbed lands. The observed LULC changes after FTLR were mostly induced by human activities resulting from changes in land tenure. Overall, the findings of this study underscores the importance of remotely sensed data in assessing the impact of FTLR on forest resources for purposes of informed and sustainable forest management.
1. Introduction
Land tenure is one of the major factors defining patterns and changes in land use/cover (LULC) (Lambin et al., Citation2001) in Sub-Saharan Africa. Land tenure is defined as the set of rules that determine how land is used, possessed, leveraged, sold or in other ways disposed of within societies (Zikhali, Citation2008). Lack of defined tenure systems and stewardship to land associated with land reform policies are some of the driving forces (German, Schoneveld, & Mwangi, Citation2013; Kalabamu, Citation2000; Verma, Citation2014) that affects (LULC). Land reform processes specifically those meant to resettle small holder farmers have a great potential of resulting in deforestation and forest degradation. This degradation is usually induced by activities, such as logging and burning to clear the land for settlements and agricultural purposes. This is characteristic of all former colonies world and over.
Landscape fragmentation due to the clearing of forests and woodlands is a major concern as it threatens the vital ecosystems goods and services, that is carbon sequestration, sources of food and fuel, and other utility products. Fostering forest resources conservation at the same time ensuring access to land for small-holder farmers through land use policies, such as land reform has always been a challenge, specifically in countries where agriculture is the backbone of the economy. In the Lower Amazon of Brazil, Futemma and Brondizio (Citation2003) noted that land reform resulted in different systems of agricultural production ranging from intensive through extensive farming to land abandonment, increasing the rates of forest degradation. Similarly, Brogaard and Xueyong (Citation2002) pointed out that the 1978 rapid agrarian policy change of the Republic of China resulted in high landscape fragmentation, rapid changes in cropping patterns to more intense practices, overuse of chemical fertilisers, increased use of steep slopes for cropping and overgrazing of grasslands. In Southern Africa countries, such as Zimbabwe, natural changes due variations in rainfall patterns, population growth, colonial imbalances in land distribution that forced the government to introduce new tenure policies that are the prime drivers of LULC changes (Kamusoko, Aniya, Adi, & Manjoro, Citation2009). It is hypothesised that agricultural activities resulting from the land tenure changes are the principal factors that have been transforming the landscape of Zimbabwe. To ensure a sustainable management of natural resources, it is necessary to understand and quantify the processes of landscape change driven by land use policies implemented by the government.
In Zimbabwe, the implementation of land use policies as an attempt to redress the colonial imbalances in land distribution dates back in the 1970s (Thomas, Citation2003). On the other hand, Zimbabwe’s population grew exponentially after independence in 1980, especially in communal areas. Consequently, this led to a constant increase in the demand for food and agricultural land in late 1990s.
The Zimbabwean government then enacted the Land Acquisition Act in 2000 which facilitated the acquisition of pre-owned commercial farms without compensation. In 2000, the Zimbabwean government announced that 2237 farms would be added to the 804 originally planned, without compensation for redistribution to the landless people. This marked the beginning of the renowned fast track land reform (FTLR) of 2000. Approximately 80,000 families were resettled on 2.5 million ha of compulsorily acquired land by December 2000. A further 2.5 million ha was planned to be resettled by the end of 2001. It is widely known that the implementation of this land reform policy was more political rather than clearly defined, fair, environmentally conscious (Sachikonye, Citation2003). During this national exercise, land was partitioned without considering the natural resources, specifically indigenous forests. New land holders with limited skills, and environmental knowledge to practice good stewardship to environmental resources occupied the land. Due to their limited skills and environmental knowledge, poor agricultural activities were initiated. These practices resulted in the reduction of indigenous forests existing within acquired commercial farms leaving the soils unprotected. This is because some indigenous tree species are known to be durable when used for constructional purposes such as mopane (Colophosspermum mopane) trees (Matavire, Sibanda, & Dube, Citation2015).
For instance, in the south-eastern parts of Zimbabwe, much of the agricultural expansion activities were on land previously under-utilised in terms of crop farming due to the unreliable rainfall patterns (Dube, Gumindoga, & Chawira, Citation2014). The majority of the land was transferred from cattle ranching with low stocking rates and limited herding labour to a more intensive smallholder crop and livestock production. Land reform resulted in pressure on the land and often unruly environmental management practices. Natural forests reduction in these areas has been significant during the past decade, after the settlement of new farmers. As part of developing their farms, most farmers had to restart clearing large expanses of bush grazing in ranches, with limited infrastructure. Some had to relocate from areas with high population pressure, such as Masvingo and clear fields anew. As a matter of urgency, fields had to be prepared for planting, structures had to be built as cattle corralling and settlements had to be developed to accommodate the growing number of people. Natural physical processes, such as drought, global warming and climate change also contributed to land degradation in the south-eastern region of the country. Nevertheless, land reform was hypothesised to be the major driver of forest degradation and land cover changes. Elich (Citation2002) noted that cropland area increased in 2001 mainly due to expansion in the communal and resettled areas after the FTLR of 2000. Nevertheless, the extent of this degradation is not yet known.
Understanding the rate of forest loss is a crucial step in quantifying human impact on the environment. However, the inability to monitor long-term land cover changes in a consistent way is a serious limitation in our capacity to understand the driving forces and processes, such as land use policies. Remote sensing technology has emerged as the most useful data source for quantitative measurement of land cover changes at the landscape scale (Dube et al., Citation2014; Dube and Mutanga, Citation2015a, Citation2015b; Sibanda, Mutanga, Rouget, & Odindi, Citation2015). For instance, remote sensing provides a synoptic view of the earth’s surface at timely repetitive coverage (Sibanda and Murwira Citation2012b). The spectral and radiometric sensitivity of remotely sensed data that enables distinguishing phenomena on the earth’s surface makes this technique a much more robust tool suitable for assessing land use changes at regional scales. Many studies utilised remote sensing and geographic information system (GIS) techniques to model LULC from local to global scales (Carlson & Traci Arthur, Citation2000; Lambin, Geist, & Lepers, Citation2003; Lambin et al., Citation2001; Meyer & Turner, Citation1994; Ramankutty & Foley, Citation1999, Razavi, Citation2014, Shalaby & Tateishi, Citation2007; Sibanda and Murwira, Citation2012a; Zhang et al., Citation2014).
In Zimbabwe, several studies pertaining to LULC change have been conducted, for example Kamusoko & Aniya (Citation2007, Citation2009), Mapaure and Campbell (Citation2002) Mapedza, Wright, and Fawcett (Citation2003). However, very little has been done to assess the FTLR policy programme of 2000 as a driver of LULC change and landscape fragmentation (Kamusoko & Aniya, Citation2007; Nyelele, Murwira, Shekede, & Mugabe, Citation2014). Thus, this study seeks to integrate GISs and earth observation techniques to evaluate the effect of the FTLR policy on LULC changes in the south-eastern region of Zimbabwe. Concisely, this study tested whether there were any significant changes in the area covered by forest lands and other cover types before (1995), at inception (2000), just after (2005) and long after (2011) the implementation of the 2000 FTLR programme in Zimbabwe which resulted in changes in land tenure.
2. Materials and methods
2.1. Study area
The study was conducted in the south-eastern region of Zimbabwe (). The area has an average temperature of 28°C and receives minimum precipitation ranging between 100 and 300 mm usually varying significantly with every season. The area falls in agro-ecological region IV according to the country’s agricultural potential classification. This classification of the country into five agricultural regions is based on soil type, annual average rainfall and forest type with region (I) receiving the highest rainfall and has very fertile soils whereas region (V) has the least agricultural conducive conditions. The Masvingo area is a dry and arid area mainly suitable for extensive cattle ranching. According to Sachikonye (Citation2003) and Thomas (Citation2003) the initial spontaneous occupations of commercial farms through the land reform exercise was adjacent to overcrowded communal areas in several districts of the Masvingo region and Mashonaland east provinces of Zimbabwe.
Figure 1. South-eastern region of Zimbabwe.
2.2. Background of land tenure changes in Zimbabwe
During the pre-colonial era, the communal or traditional land tenure system was prevalent. In a traditional land tenure system, owning land was considered a birth right. The chief held responsibility of the land in trust of his people and families enjoyed the usufruct. In short, the land belonged to the community while the chief was its custodian (Mupfuvi, Citation2014). From 1890 to 1980, the new settlers colonised the country and owned over one-sixth of the land. They occupied, all the prime fertile land, displacing the previous indigenous owners (Moyana, Citation2002). The white minority comprised 3% of the population yet controlled 75% of the economically viable land while the 97% black Africans controlled only 23% of the overcrowded and unfertile land (Moyo & Yeros, Citation2007; Sachikonye, Citation2005). The fertile land was mainly used for commercial agricultural purposes. After independence, part of the land was vested in the hands of the government while the beneficiaries were only given permits to reside and work on it. The other greater portion of prime land was country wide owned by the white farmers, while the majority of the population was still limited to infertile sandy soils (Sachikonye, Citation2003). This was due to the prevalence Lancaster House constitution. The Lancaster House constitution governed the country for the first 10 years after independence which only allowed government to acquire land through the conservative means of willing-seller-willing-buyer. This approach was restrictive in that it denied government the right to purchase large tracts of land for large-scale resettlement programmes. Land that was getting to the market was mainly located in the marginal areas of the country which the settlers were disposing. This explains why 81% of the land acquired for resettlement in the first phase was in the drier agro-economic regions of the country. Furthermore, the land prices drastically increased during the late 1990s, making it a challenge for the government to acquire land (Moyo & Yeros, Citation2007). The Lancaster House Constitution ended on the 18th of April 1990. Nevertheless, the government still failed to raise adequate funds to acquire farms for resettlement. Henceforth, the Zimbabwean government implemented the Land Acquisition Act in 2000. This Act led to the acquisition of pre-owned commercial farms without compensation. As mentioned above, the FTLR was implemented in 2000; for redistribution of land ‘to the landless people’. However, it was yet to be understood how this land tenure change affected the LULC landscapes of Zimbabwe.
2.3. Remote sensing data acquisition and pre-processing
Cloud free 30 m multi-spectral Landsat Thematic Mapper (TM) covering the years 1995, 2000, 2005 and 2011 were selected and downloaded from the internet. All Landsat images were acquired on the month of January so as to ensure time and space consistence in the pattern of land use classes in question. Moreover the month of January was selected because it captured the state of the environment before the implementation of the FTLR. Landsat images were acquired from the readily available online Landsat archive the United States Geological Survey Global Visualization Viewer (GloVis) (http://glovis.usgs.gov/ weblink) free of charge.
All the ortho-rectified Landsat images were acquired in Digital Number (DN) format and were calibrated to spectral radiance units [Wm−2sr−1µm−1] using the algorithm used by Chander, Markham, and Helder (Citation2009). Conversion from DN to spectral radiance was done at band level using Envi 4.3 software based on Chander et al. (Citation2009). For this, visible and near infrared (NIR) bands in determining the areal extent of forest degradation as an aftermath of Zimbabwe’s FTLRP of 2000 in. All Landsat TM visible bands were atmospherically corrected using the Fast Line-of-sight Atmospheric Analysis of Spectral Hypercube (FLAASH) model (Felde et al., Citation2003; Kaufmann et al., Citation1997). The FLAASH model is an interface of ENVI GIS software, which is normally renowned for retrieving reflectance from multi-spectral radiance images. The FLAASH algorithm was mainly applied to 0.35 µm–2.5 µm visible region covered by Landsat bands (Kaufmann et al., Citation1997; Trishchenko, Hwang, & Li, Citation2002). This model uses the MODTRAN4 radiation transfer code (Berk et al., Citation2000) which consists of a correlated-k algorithm which largely enables precise calculation of various scattering.
2.4. Mapping areas most and least affected by the change in tenure
The Calibrated Landsat images of 1995, 2000, 2005 and 2011 were then classified in a GIS to determine the patterns in LULC changes in the south-eastern region of Zimbabwe. Images classification was conducted using the maximum likelihood (ML) algorithm in Integrated Land and Water Information System (ILWIS) 3.7.1 open source software product developed by ITC institution under the 52°North initiative (http://52north.org/communities/ilwis). ML classification assumes that spectral values of training pixels are statistically distributed according to a multi-variate normal (Gaussian) probability density function. Prior to image classification, using ML, a sample set was generated based on the number of land cover classes proposed. In this study, seven land cover classes, namely: bare land, fields, grasslands, woodland, riparian vegetation and water were generated. Considering that satellite images used in this study were acquired in January, land cover signatures of classes, such as grasslands could be distinguished from those of bare lands (which in this study refers to non-vegetated areas). Grasses green up faster at the beginning of the rainy season (i.e. January) easing their discrimination from bare lands which are usually bare from disturbances due to human activities. Moreover bare lands can be discriminated from the fields as they have a different tone and irregular shape when compared to fields. Classification results were assessed for accuracy using ground control points (GCPs) derived from aerial photographs covering the area of interest acquired 1995 as well as high resolution SPOT dataset embedded on the Google domain. The SPOT satellite images on Google Earth domain have a fine spatial resolution of 2.5 m from the panchromatic band (Knorn et al., Citation2009) while the aerial photographs had a spatial resolution of 5 m (Baudron, Corbeels, Andersson, Sibanda, & Giller, Citation2011). At these spatial resolutions fields could be clearly identified based on their texture and shape (Baudron et al., Citation2011) facilitating the classification process as well as the accuracy assessment procedure. Kappa classification accuracies of 73%, 70%, 76% and 69% were obtained for the year 1995, 2000, 2005 and 2011 image classification results, respectively. Other than this study, data derived from Google Earth was has been used in other classification studies (Baudron et al., Citation2011; Knorn et al., Citation2009; McInnes, Vigiak, & Roberts, Citation2011; Seutloali, Beckedahl, Dube, & Sibanda, Citation2015). For example, Seutloali et al. (Citation2015) used Google Earth derived data to distinguish and assess road-related gully erosion in the Eastern Cape province of South Africa. Knorn et al. (Citation2009), on the other hand, used Google Earth derived data to train their classification algorithm as well as for testing the accuracy of their land cover classification of the Carpathians in central Europe using Landsat satellite images.
To demonstrate the effect of FTLR on LULC, we identified and distinguished areas (farms) that were most affected and those that were least affected by FTLR, for comparison purposes. These farms were chosen so as to enhance the distinction and evaluation of land cover changes induced by natural ecological processes (i.e. hydrological droughts) from those induced anthropogenic activities. To derive farm boundaries of areas that were least and most affected, we acquired 1:50,000 cadaster maps from the surveyor general. The map was georeferenced to WGS UTM zone 36 south based on the affine transformation to a root mean square error of less than half a pixel in a GIS environment. Consequently, the boundaries of farms that were least and most affected were identified and digitalised into polygons in GIS environment. These all farm boundaries were cross checked using the national land use map. These polygons or least and most farms affected by FTLR were then overlaid with the classification products of the five satellite images representing the conditions before (1995), at the inception (2000) just after inception (2005) and long after the inception of the FTLR in Zimbabwe. The area occupied by each of the land cover types aforementioned was then calculated in GIS environment for the five time periods. The areas occupied by different land cover types in 1995, 2000, 2005 and 2011 (for both the most affected and least affected areas) were tested for significant differences (α at 0.05) using the MacNemar’s test of proportions in S-Splus software.
We graphically illustrated significant differences using bar graphs with error bars. The error bars denoted the upper and the lower confidence intervals for proportions of each land cover type per year. The error bars were interpreted as explained in literature (Cumming & Finch, Citation2005, Masocha, Citation2010; Payton, Greenstone, & Schenker, Citation2003). For instance, if the error bars were overlapping they denoted no significant differences while those that were not overlapping illustrated significant differences (Cumming & Finch, Citation2005; Kalinowski, et al., Citation2003; Masocha, Citation2010). Above all, we tested for significant differences between and within land cover types between 1995, 2000, 2005 and 2011 using the MacNemar test of proportions. Consequently, the change in the area occupied by a certain land cover type for both the most affected and less affected areas was calculated. As aforementioned, the changes in the areas occupied by various land cover types in the portions of the study area that were least affected by the changes in land tenure were attributed to natural ecosystem process while the changes in areas occupied by different land cover types in this study were representative of the LUC induced by anthropogenic activities brought about by the change in land tenure. To establish the changes induced by anthropogenic activities from those induce by natural ecosystem processes, the changes in the areas occupied by land cover types in less affected areas were derived by subtracting those of less affected areas from the spatial extent changes of the most affected areas. These were then presented graphically.
3. Results
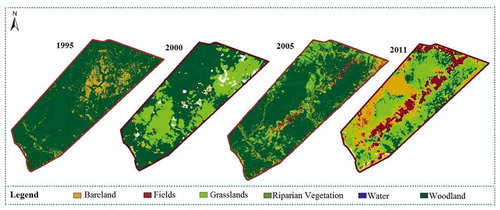
The results of the classified maps for the period before inception ((a) 1995), slightly before inception ((b) 2000), just after inception ((c) 2005) and long after the inception of FTLR ((d) 2011) are shown in . It can be noted that prior to the enactment of land reform in 1995 (), the area was mainly covered by woodlands and some small portions of bare lands. Then during the period prior to the implementation of the FTLR in 2000 the dominant cover type were the woodlands although there were slight changes of the areas that were mainly occupied by woodlands into grasslands. A distinction between the grasslands and woodlands was clearly defined and distributed evenly throughout the study area save for the eastern portion (). A matrix of bare land, grassland, disturbed land and fields can be observed in the eastern portion of the study area. It can be observed that the eastern portion of the study area dominated by fields prior (in 1995) to the FTLR (). Moreover, at the enactment of the FTLR in 2000, fields and bare land were still associated with anthropogenic activities limited to the eastern side of the study area. However, illustrates a rapidly changed landscape with more grasslands replacing the fields and other bare lands in the eastern section of the study area.
Figure 2. Land cover types (a) earlier (1995), (b) before (2000), (c) after (2005) and (d) long after (2011) the FTLR of 2000 in the south-eastern part of Zimbabwe.
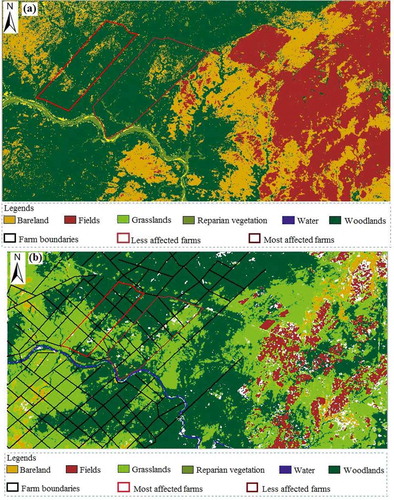
Figure 2. (Continued).
The spatial distribution of woodlands in the south-eastern region of Zimbabwe was further fragmented into relatively smaller patches after FTLR (2005) (). Although the significant portions of fields and bare lands were evident in the western portion of the study area, there is evidence of an increase in the areas covered by fields and bare land cover types in a west ward direction replacing woodlands. Long after the FTLR (2011), a marginal foot print of agricultural activities can be observed in the areas that were previously covered by woodlands. Similarly, the spatial distribution of the bare areas inversely increased after the FTLR (). The spatial distribution of croplands proportionally increased in spatial extent towards a north westerly direction after FTLR. Likewise, the areas under grasslands rapidly increased in 2011 while the area occupied by woodlands drastically decreased. The area occupied by riparian vegetation was also rapidly reduced, whereas areas under sand inversely increased illustrating a reduction in the area occupied by water. After the change in land tenure, fragmentation generally increased as shown in resulting in matrices of bare, grassland and field patches across the study area.
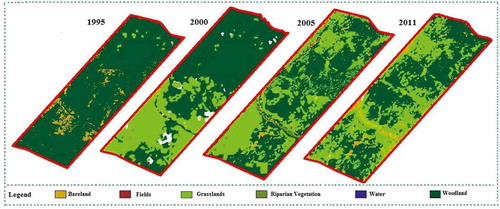
The areas that were least affected by the FTLR programme show big intact patches occupied by woodlands in 1995 as well as evenly distributed small patches of bare land and grasslands prior to changes in land tenure (). At the inception of the FTLR in 2000, the woodlands and bare lands were replaced by the grasslands which rapidly increased. On the other hand, after the FTLR (2005), the woodlands were gradually reduced into a tree-grassland matrix. Long after (2011), the FTLR land cover landscape in the least affected areas was characterised by a fair reduction in the size of woodlands in the study area. Inversely, the spatial distribution of grassland relatively increased resulting in a matrix of slightly bigger patches of woodlands and numerous grassland spots across the least affected areas. Also, drastic changes of woodlands to grasslands can be observed in the southern part of the areas that were least affected by FTLR between 1995 and 2000 when compared to other sections of this area.
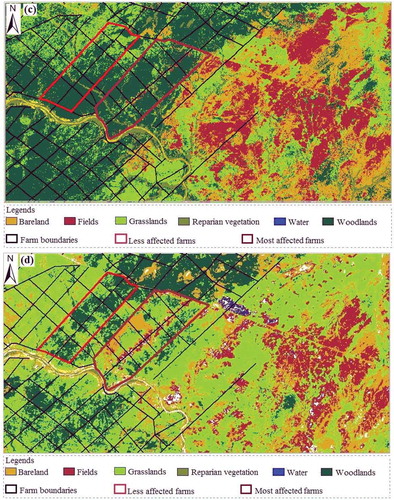
Figure 3. Spatial distribution of different land cover types in farms that were least affected by the change in land tenure. Above (a) represents the least affected farms in 2000 while (b) represents least affected farms after the FTLR in 2011.
The areas that were most affected by land tenure changes of 2000 exhibited a high areal coverage of woodlands and a fair distribution of minute bare lands in 1995. Slightly before the FTLR in 2000, the areas that were previously occupied by woodlands were transformed into grasslands. It is of great interest to note that prior to the change in tenure (1995 to 2000), no anthropogenic activities were prevalent in the areas that were most affected by FTLR (). Immediately after the FTLR in 2005, islands of agricultural activities can be observed () occupying the areas that were under woodlands. Moreover, in 2005 grasslands were replaced by wooded grasslands classified in this study as woodlands. Few relatively smaller bare land patches were also evident in 2005, after the implementation of the FTLR, fairly distributed in the northern parts of the most affected areas of Masvingo. However, long after the implementation of the FTLR in 2011 () the land cover landscape was mainly characterised by a rapid increase in spatial distribution of bare land and field patches. It can also be observed that the previous woodlands and grasslands were replaced by a matrix of fairly small patches dominated by bare land and croplands.
Figure 4. Spatial distribution of different land cover types in farms that were most affected by the change in land tenure from 1995 to 2011.
Significant differences (p < 0.05) were observed between the areas occupied by the five land cover types as well as within each land cover type long before (1995), and prior (2000), just after (2005) and long after (2011) the implementation of the 2000 FTLR in Masvingo district (). In 1995 and 2000 prior to the FTLR, the dominant land cover type was the woodland followed by grasslands. After the FTLR in 2005 and 2011, the dominant land cover types were the grasslands followed by cultivation and bare lands. However the areas occupied by riparian vegetation and water did not significantly change before, after and long after (2011) the FTLR in this study (see ). Although, the areas occupied by riparian vegetation did not exhibit any significant change in the most affected areas, it is much more fragmented into matrices by sand.
Figure 5. Significant differences (p < 0.05) amongst and within the areas occupied by the six land cover types across the study area before (2000) and long after (2011) the FTLR based on the MacNemar’s test. Error bars denote confidence intervals at 95% (Cumming & Finch, Citation2005; Masocha, Citation2010; Payton et al., Citation2003).
The areas that were less affected by the FTLR exhibited significant differences (p < 0.05) between the area occupied by bare land, grasslands and woodlands across 1995, to 2011 after the land tenure change (). No significant differences (p > 0.05) were observed between the area occupied by fields, riparian vegetation, water and disturbed lands in before the FTLR and long after the change in tenure in 2011. In comparison, areas that were most affected by the FTLR exhibited significant differences (p < 0.05) in land cover changes between the year 2000 and 2011. For instance, areas occupied by fields, woodlands, disturbed lands, grasslands, riparian vegetation and bare areas between the year 2000 prior to the change in tenure and after its launch in 2011 were significantly different (p < 0.05) based on the MacNemar tests (). Similar to the scenario in less affected areas, no significant differences were observed in the areas occupied by water. Although areas occupied by bare land, grasslands and woodlands in the year 2000 and in 2011 after the land tenure change exhibited significant differences (p < 0.05) in both the least and most affected areas, it can be observed that the changes in area coverage in most affected areas are higher than those in less affected areas. Specifically, areas occupied by fields, woodlands, disturbed lands, grasslands and bare land marginally increased after the land tenure change ().
Figure 6. Significant differences (p < 0.05) amongst and within the areas occupied by the six land cover types before (2000) and long after (2011) the FTLR based on the MacNemar’s test. Error bars denote confidence intervals at 95% (Cumming & Finch, Citation2005; Masocha, Citation2010; Payton et al., Citation2003), (a) shows changes in areas that were least affected and (b) those that were most affected by tenure change.
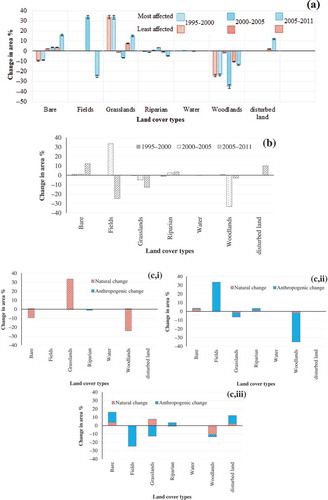
Significant differences (p < 0.05) were observed in testing whether the changes that occurred between the least affected and the most affected areas after the FTLR (). Specifically, gradual changes in land cover types of less >12% can be observed between 1995 and 2000 and in 2005 to 2011. Conversely, a dramatic decrease in the woodlands with a magnitude of 30% can be observed in coupled by a phenomenal increase in the amount of land occupied by fields with a magnitude of 30%. In further investigating the effect of changes in tenure on the land cover changes in the eastern parts of Zimbabwe, results of the present study show that the magnitude of change induced by natural changes which may include droughts ecosystem-related issues were phenomenally higher than those induced by anthropogenic activities between 1995 and 2000 ().
Figure 7. Change in the area occupied by each land cover type in the south-eastern region of Zimbabwe in areas that were (a) least affected as well as most areas before and after the land tenure change, (b) percentage changes per land cover change after the land tenure change between 1995 to 2000, 2000 to 2005 and 2005 to 2011, (c) the differences in between the areal extent induced by natural and anthropogenic activities in between (i) 1995 to 2000, (ii) 2000 to 2005 and (iii) 2005 to 2011.
4. Discussion
The rationale of this study was to assess the utility of earth observation technologies in quantifying the impacts of the land tenure changes of 2000 in the eastern region of Zimbabwe between 2000 and 2011. Results of this study have therefore demonstrated the strength of earth observation technologies in the form of Landsat TM dataset in quantifying and understanding the impacts of the FTLR programme in Zimbabwe between 1995 and 2011. The results of this study indicated that prior to the FTLR woodlands and forests occupied a lager spatial extent and were drastically reduced after the enactment of the FTLR in 2000. The results further indicated that the area under cropland dramatically increased soon after the FTLR. The land was not used predominantly for high intensity crop production but for low intensity cattle ranching and other uses before the FTLR. After the FTLR, the land was converted into agricultural fields predominantly with high cropping intensities. Overall, these results show that FTLR resulted in anthropogenic activities that highly reduced the forest resources to obtain material for settlements, agricultural fields, constructional materials as well as fuel wood. The World Food Programme (WFP) in Thomas (Citation2003) reported that the area planted to maize increased by 14% in 2001 mainly due to expansion in the communal and resettled areas in Zimbabwe. This explains the increase in the croplands during the period of 2000 to 2011 established in this study particularly in most affected areas. During the period of 2000 to 2011, the government of Zimbabwe provided the small holder farmers with farming implements such as seeds; fertilisers and in some cases loans. This resulted in an increase in the area put under crop cultivation and encroachment to forested areas. In a related study, Kamusoko et al. (Citation2009) showed that the LULC trends were changing greatly with forest loss in the rise even way after the FTLR as was noted in the areas most affected by FTLR this study. Kamusoko et al. (Citation2009) even predicated that if such LULC trends are to continue without holistic sustainable development measures, severe land degradation will ensue.
Results of this study also showed high changes from woodlands to grasslands in the southern section of the areas that were least affected by FTLR. These changes could be explained by factors, such as the occurrence of droughts and fires. The droughts result in more dry matter which is highly combustible while the fires, likely to be coming from human activities in the areas that are most affected by FTLR, reduce the forests and bushlands into grasslands. This phenomena is characteristic of the savanna ecosystem which renowned for being frequently engineered by fires and droughts (Higgins, Bond, & Trollope, Citation2000).
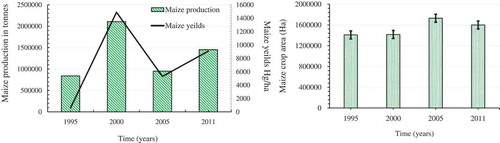
Results of this study are consistent with the statistics derived from the Food and Agriculture Organization of the United Nations Statistics Division (FAOSTAT) (http://faostat3.fao.org/download/Q/QC/E). As observed in the results of this study, FOASTAT indicated an increase in the area occupied by maize crop in 2005 after the FTLR (). However it is interesting to note that the FAOSTATS report a decline through time of in terms of maize production from 1995 to 2011. In 2000, Zimbabwe produced 2,108,110 tonnes which drastically dropped down to less 1,000,000 tonnes in 2005 and slightly increased to 1,452,000 tonnes of maize in 2011 (). This reduction is despite an increase in the area covered by crops. The statistics offered FAOSTAT also support our claim that FTLR resulted in an increase in the amount of land cover that is associated with human activities.
Figure 8. Variations in maize production yield and crop area between the period of 1995 to 2011 before (1995). The data was derived from the website of FAOSTA (http://faostat3.fao.org/download/Q/QC/E).
Results of this study also showed that the area occupied by bare land was relatively higher prior to the FTLR. This could be attributed to the fallow land abandoned after over utilising the nutrients in the soils, considering that the area under study was one of the parts of Zimbabwe that were allocated to the small holder farmers due its limited potential to crop farming activities. The soils in the area are sandy and acidic and are predominantly conducive for grasslands hence the dominant agricultural activity is livestock rearing. During the colonial era, the majority of the small holder farmers were settled in areas characterised with less fertile soils, associated with agricultural productivity, hence part of the land prior to the FTLR was bare. Bare land also increased highly long after the FTLR due to the recurring tendency of leaving fallow fields for new farm lands.
Prior to the FTLR generally the cropland occupied a relatively lower amount of area than after the implementation of FTLR. In areas that were most affected by FTLR, bare lands and croplands as well as disturbed lands occupied less area prior to changes in land tenure. Results indicate that they all increased dramatically in 2011 due to the FTLR. This can be explained by the changes in land tenure. Forests were drastically reduced during and after the FTLR through anthropogenic activities. Specifically, forests were cut to open up land for building homesteads, for constructional materials (poles, trusses, etc.) and as a source of fuel (Kamusoko & Aniya, Citation2007; Manjengwa, Citation2006). Results of this study are also consistent with those (Zembe, Mbokochena, Mudzengerere, & Chikwiri, Citation2014) who noted that FTLR brought along bad farming habits that resulted in gully erosion and vast deforestation. Furthermore, there were hydrological and agricultural droughts between 2000 and 2011 which resulted in significant changes in forests densities as was noted in the results of this study.
Although evaluating the socio-economic impacts of the FTLR was beyond the scope of this manuscript, literature shows that the land reform of 2000 in Zimbabwe was generally successful (Chaumba, Scoones, & Wolmer, Citation2003). This is because food production increased after the FTLR based on the FAO statistics used in this study. According to Hoogeveen and Kinsey (Citation2001), land reform beneficiaries got four times revenue from their crops more than those who did not benefit. However, in this study it is difficult to rate the success of land reform in Masvingo because the area is dry and prone to frequent droughts. In 2001 to 2003, the annual rainfall decreased from approximately 1200 mm to about 600 mm in 2003 (Richardson, Citation2007). Droughts hamper the agricultural productivity and the major objective of the land reform exercise. The FAO statistics showed both an increase in land under cultivation, but more importantly, an increase in yields during the last time period. This could be attributed to better methods of farming by the newly resettled farmers as well as increases in annual rainfall. Generally the results of this study suggest that in spite of the unpleasant way the FTLR was perceived to have been conducted, land reform was not completely unsuccessful. The increases in the maize crop area as well as the production suggest a significant amount of food production in Zimbabwe after the FTLR. Overall, the success of land reform in alleviating poverty through agricultural production is yet to be realised in the study area (Kinsey, Citation2004).
4.1. Linkages between land cover information and effects of land reform
Socio-economic factors, such as land tenure policy changes, are some of the major elements that outline configurations and changes in land use (Futemma & Brondizio, Citation2003). Land tenure policy changes, such as the FTLR of the year 2000 in Zimbabwe, resulted in land use changes such as the fragmentation of large-scale livestock farming areas into communal/subsistence crop farming areas (Kamusoko & Aniya, Citation2007). For instance prior to the FTLR, the intact large-scale commercial livestock farms could be observed from the derived land cover information whereas soon after the FTLR, these were now fragmented into small subsistence farming areas. Also, the area occupied by the large-scale commercial livestock farms derived based on remotely sensed data was observed to be large prior to the FTLR and vice versa (Futemma & Brondizio, Citation2003; Long, Wu, Wang, & Dong, Citation2008; Müller & Sikor, Citation2006). However, land cover information provides only insight on the changes of various land cover types within a certain period of time, that is from 1995 to 2011 without a direct link with the land reform. The major limitation of this technique is that only inferences can be deduced and used to quantify the effects of land reform from the remotely sensed derived land cover information (Sikor, Müller, & Stahl, Citation2009).
5. Conclusion
The results of this study indicated that the area covered by forests deteriorated by 30% (2005–2011) while bare, disturbed, grasslands and croplands increased by 30%. Results also indicated significant forest degradation (p > 0.005) levels. From the results of this study, the radiometric, spatial and spectral resolutions of Landsat are plausible for quantifying the changes induced by changes in land tenure. Thus we conclude that remote sensing can be used to assess the impacts of land tenure and related policies on LULC changes. We recommend the use of remotely sensed data because it is available in a limited cost, it has a region view as well as repeated coverage which can will assist generating an in-depth understanding of the impact of polices such as the FTLR on the environmental resources at a large scale.
Acknowledgements
We thank NASA for providing us with the Landsat images of the area under study. We also thank anonymous reviewers for reviewing our work.
Disclosure statement
No potential conflict of interest was reported by the authors.
References
- Baudron, F., Corbeels, M., Andersson, J. A., Sibanda, M., & Giller, K. E. (2011). Delineating the drivers of waning wildlife habitat: The predominance of cotton farming on the fringe of protected areas in the Mid-Zambezi Valley, Zimbabwe. Biological Conservation, 144(5), 1481–1493. doi:10.1016/j.biocon.2011.01.017
- Berk, A. G. P. A., Acharya, P. K., Chetwynd, J. H., Bernstein, L. S., Shettle, E. P., Matthew, M. W. … Hanscom, A. F. B. (2000). MODTRAN 4 User’s Manual. MA: Air Force Res. Lab.
- Brogaard, S., & Xueyong, Z. (2002). Rural reforms and changes in land management and attitudes: A case study from Inner Mongolia, China. AMBIO: A Journal of the Human Environment, 31(3), 219–225. doi:10.1579/0044-7447-31.3.219
- Carlson, T. N., & Traci Arthur, S. (2000). The impact of land use—Land cover changes due to urbanization on surface microclimate and hydrology: A satellite perspective. Global and Planetary Change, 25(1–2), 49–65. doi:10.1016/S0921-8181(00)00021-7
- Chander, G., Markham, B. L., & Helder, D. L. (2009). Summary of current radiometric calibration coefficients for Landsat MSS, TM, ETM+, and EO-1 ALI sensors. Remote Sensing of Environment, 113(5), 893–903. doi:10.1016/j.rse.2009.01.007
- Chaumba, J., Scoones, I., & Wolmer, W. (2003). From jambanja to planning: The reassertion of technocracy in land reform in south-eastern Zimbabwe? The Journal of Modern African Studies, 41(4), 533–554. doi:10.1017/S0022278X03004397
- Cumming, G., & Finch, S. (2005). Inference by eye: Confidence intervals and how to read pictures of data. American Psychologist, 60(2), 170–180. doi:10.1037/0003-066X.60.2.170
- Dube, T., Gumindoga, W., & Chawira, M. (2014). Detection of land cover changes around Lake Mutirikwi, Zimbabwe, based on traditional remote sensing image classification techniques. African Journal of Aquatic Science, 39(1), 89–95. doi:10.2989/16085914.2013.870068
- Dube, T., & Mutanga, O. (2015a). Evaluating the utility of the medium-spatial resolution Landsat 8 multispectral sensor in quantifying aboveground biomass in uMgeni catchment, South Africa. ISPRS Journal of Photogrammetry and Remote Sensing, 101, 36–46. doi:10.1016/j.isprsjprs.2014.11.001
- Dube, T., & Mutanga, O. (2015b). Investigating the robustness of the new Landsat-8 Operational Land Imager derived texture metrics in estimating plantation forest aboveground biomass in resource constrained areas. ISPRS Journal of Photogrammetry and Remote Sensing, 108, 12–32. doi:10.1016/j.isprsjprs.2015.06.002
- Dube, T., Mutanga, O., Elhadi, A., & Ismail, R. (2014). Intra-and-inter species biomass prediction in a plantation forest: Testing the utility of high spatial resolution spaceborne multispectral RapidEye sensor and advanced machine learning algorithms. Sensors, 14(8), 15348–15370. doi:10.3390/s140815348
- Elich, G. (2002). Zimbabwe under siege. Swans Commentary, 26. Retrieved from http://www.swans.com/library/art8/elich004.html
- Felde, G. W., Anderson, G. P., Cooley, T. W., Matthew, M. W., Adler-Golden, S. M., Berk, A., & Lee, J. (2003). Analysis of hyperion data with the FLAASH atmospheric correction algorithm. In Algorithms and Technologies for Multispectral, Hyperspectral, and Ultraspectral Imagery IX. Orlando: SPIE Aerosense.
- Futemma, C., & Brondizio, E. S. (2003). Land reform and land-use changes in the lower Amazon: Implications for agricultural intensification. Human Ecology, 31(3), 369–402. doi:10.1023/A:1025067721480
- German, L., Schoneveld, G., & Mwangi, E. (2013). Contemporary processes of large-scale land acquisition in Sub-Saharan Africa: Legal deficiency or elite capture of the rule of law? World Development, 48, 1–18. doi:10.1016/j.worlddev.2013.03.006
- Higgins, S. I., Bond, W. J., & Trollope, W. S. W. (2000). Fire, resprouting and variability: A recipe for grass–tree coexistence in savanna. Journal of Ecology, 88(2), 213–229. doi:10.1046/j.1365-2745.2000.00435.x
- Hoogeveen, J. G. M., & Kinsey, B. H. (2001). Land reform, growth and equity: Emerging evidence from Zimbabwe’s resettlement programme – A sequel. Journal of Southern African Studies, 27(1), 127–136. doi:10.1080/03057070120029536
- Kalabamu, F. T. (2000). Land tenure and management reforms in East and Southern Africa – The case of Botswana. Land Use Policy, 17(4), 305–319. doi:10.1016/S0264-8377(00)00037-5
- Kalinowski, P. (2003). Understanding confidence intervals (CIs) and effect size estimation. Obtenido de www. psychologicalscience.org: http://www.psychologicalscience.org/index.php/publications/observer/2010/april-10/understanding-confidence-intervals-cis-and-effect-size-estimation.html
- Kamusoko, C., & Aniya, M. (2007). Land use/cover change and landscape fragmentation analysis in the Bindura district, Zimbabwe. Land Degradation & Development, 18(2), 221–233. doi:10.1002/(ISSN)1099-145X
- Kamusoko, C., & Aniya, M. (2009). Hybrid classification of Landsat data and GIS for land use/cover change analysis of the Bindura district, Zimbabwe. International Journal of Remote Sensing, 30(1), 97–115. doi:10.1080/01431160802244268
- Kamusoko, C., Aniya, M., Adi, B., & Manjoro, M. (2009). Rural sustainability under threat in Zimbabwe – Simulation of future land use/cover changes in the Bindura district based on the Markov-cellular automata model. Applied Geography, 29(3), 435–447. doi:10.1016/j.apgeog.2008.10.002
- Kaufmann, Y. J., Wald, A. E., Remer, L. A., Gao, B.-C., Li, -R.-R., & Flynn, L. (1997). The MODIS 2.1-μm channel-correlation with visible reflectance for use in remote sensing of aerosol. IEEE Transactions on Geoscience and Remote Sensing, 35, 1286–1298. doi:10.1109/36.628795
- Kinsey, B. H. (2004). Zimbabwe’s land reform program: Underinvestment in post-conflict transformation. World Development, 32(10), 1669–1696. doi:10.1016/j.worlddev.2004.06.005
- Knorn, J., Rabe, A., Radeloff, V. C., Kuemmerle, T., Kozak, J., & Hostert, P. (2009). Land cover mapping of large areas using chain classification of neighboring Landsat satellite images. Remote Sensing of Environment, 113(5), 957–964. doi:10.1016/j.rse.2009.01.010
- Lambin, E. F., Geist, H. J., & Lepers, E. (2003). Dynamics of land-use and land-cover change in tropical regions. Annual Review of Environment and Resources, 28(1), 205–241. doi:10.1146/annurev.energy.28.050302.105459
- Lambin, E. F., Turner, B. L., Geist, H. J., Agbola, S. B., Angelsen, A., Bruce, J. W. … Xu, J. (2001). The causes of land-use and land-cover change: Moving beyond the myths. Global Environmental Change, 11(4), 261–269. doi:10.1016/S0959-3780(01)00007-3
- Long, H., Wu, X., Wang, W., & Dong, G. (2008). Analysis of urban-rural land-use change during 1995–2006 and its policy dimensional driving forces in Chongqing, China. Sensors, 8(2), 681–699. doi:10.3390/s8020681
- Manjengwa, J. (2006). Natural resource management and land reform in southern Africa. No. 15 in Occasional Paper Series, Commons Southern Africa. Cape Town: Centre for Applied Social Sciences and Programme for Poverty, Land and Agrarian Studies, University of the Western Cape.
- Mapaure, I. N., & Campbell, B. M. (2002). Changes in miombo woodland cover in and around Sengwa Wildlife Research Area, Zimbabwe, in relation to elephants and fire. African Journal of Ecology, 40(3), 212–219. doi:10.1046/j.1365-2028.2002.00355.x
- Mapedza, E., Wright, J., & Fawcett, R. (2003). An investigation of land cover change in Mafungautsi Forest, Zimbabwe, using GIS and participatory mapping. Applied Geography, 23(1), 1–21. doi:10.1016/S0143-6228(02)00070-X
- Masocha, M. (2010). Savanna aliens. Enschede: International Institute for Geo-Information Science & Earth Observation.
- Matavire, M. M., Sibanda, M., & Dube, T. (2015). Assessing the aftermath of the fast track land reform programme in Zimbabwe on land-use and land-cover changes. Transactions of the Royal Society of South Africa, 70(2), 181–186. doi:10.1080/0035919X.2015.1017865
- McInnes, J., Vigiak, O., & Roberts, A. M. (2011). Using Google Earth to map gully extent in the West Gippsland region (Victoria, Australia). In Chan, F., Marinova, D. and Anderssen, R. S. (Eds.), MODSIM2011, 19th international congress on modelling and simulation (pp. 3370–3376). Perth: Modelling and Simulation Society of Australia and New Zealand. Retrieved from http://www.mssanz.org.au
- Meyer, W. B., & Turner, I. B. L. (1994). Changes in land use and land cover: A global perspective, Cambridge University Press.
- Moyana, H. V. (2002). The political economy of land in Zimbabwe, Mambo Press.
- Moyo, S., & Yeros, P. (2007). The radicalised state: Zimbabwe’s interrupted revolution. Review of African Political Economy, 34(111), 103–121. doi:10.1080/03056240701340431
- Müller, D., & Sikor, T. (2006). Effects of postsocialist reforms on land cover and land use in south-eastern Albania. Applied Geography, 26(3–4), 175–191. doi:10.1016/j.apgeog.2006.09.002
- Mupfuvi, B. M. (2014). Land to the people: Peasants and nationalism in the development of land ownership structure in Zimbabwe from pre-colonialism to the unilateral declaration of independence (UDI) period, University of Salford.
- Nyelele, C., Murwira, A., Shekede, M. D., & Mugabe, P. H. (2014). Woodland fragmentation explains tree species diversity in an agricultural landscape of Southern Africa. Tropical Ecology, 55(3), 365–374.
- Payton, M. E., Greenstone, M. H., & Schenker, N. (2003). Overlapping confidence intervals or standard error intervals: What do they mean in terms of statistical significance? Journal of Insect Science, 3(34), 1–6. doi:10.1673/031.003.3401
- Ramankutty, N., & Foley, J. A. (1999). Estimating historical changes in global land cover: Croplands from 1700 to 1992. Global Biogeochemical Cycles, 13(4), 997–1027. doi:10.1029/1999GB900046
- Razavi, B. S. (2014). Predicting the trend of land use changes using artificial neural network and Markov chain model (case study: Kermanshah City). Research Journal of Environmental and Earth Sciences, 6(4), 215–226.
- Richardson, C. J. (2007). How much did droughts matter? Linking rainfall and GDP growth in Zimbabwe. African Affairs, 106(424), 463–478. doi:10.1093/afraf/adm013
- Sachikonye, L. (2005). The land is the economy: Revisiting the land question. African Security Review, 14(3), 31–44. doi:10.1080/10246029.2005.9627368
- Sachikonye, L. M. (2003). From ‘growth with equity’ to ‘fast-track’ reform: Zimbabwe’s land question. Review of African Political Economy, 30(96), 227–240. doi:10.1080/03056244.2003.9693496
- Seutloali, K. E., Beckedahl, H. R., Dube, T., & Sibanda, M. (2015). An assessment of gully erosion along major armoured-roads in south-eastern region of South Africa: A remote sensing and GIS approach. Geocarto International, 31(2), 225–239. doi:10.1080/10106049.2015.1047412
- Shalaby, A., & Tateishi, R. (2007). Remote sensing and GIS for mapping and monitoring land cover and land-use changes in the Northwestern coastal zone of Egypt. Applied Geography, 27(1), 28–41. doi:10.1016/j.apgeog.2006.09.004
- Sibanda, M., & Murwira, A. (2012a). Cotton fields drive elephant habitat fragmentation in the Mid Zambezi Valley, Zimbabwe. International Journal of Applied Earth Observation and Geoinformation, 19, 286–297. doi:10.1016/j.jag.2012.05.014
- Sibanda, M., & Murwira, A. (2012b). The use of multi-temporal MODIS images with ground data to distinguish cotton from maize and sorghum fields in smallholder agricultural landscapes of Southern Africa. International Journal of Remote Sensing, 33(16), 4841–4855. doi:10.1080/01431161.2011.635715
- Sibanda, M., Mutanga, O., Rouget, M., & Odindi, J. (2015). Exploring the potential of in situ hyperspectral data and multivariate techniques in discriminating different fertilizer treatments in grasslands. Journal of Applied Remote Sensing, 9(1), 096033–096033. doi:10.1117/1.JRS.9.096033
- Sikor, T., Müller, D., & Stahl, J. (2009). Land fragmentation and cropland abandonment in Albania: Implications for the roles of state and community in post-socialist land consolidation. World Development, 37(8), 1411–1423. doi:10.1016/j.worlddev.2008.08.013
- Thomas, N. H. (2003). Land reform in Zimbabwe. Third World Quarterly, 24(4), 691–712. doi:10.1080/0143659032000105821
- Trishchenko, A. P., Hwang, B., & Li, Z. (2002). Atmospheric correction of satellite signal in solar domain: Impact of improved molecular spectroscopy. In Twelfth ARM Science Team Meeting Proceedings. St. Petersburg, FL: ARM.
- Verma, R. (2014). Land grabs, power, and gender in east and Southern Africa: So, what’s new? Feminist Economics, 20(1), 52–75. doi:10.1080/13545701.2014.897739
- Zembe, N., Mbokochena, E., Mudzengerere, F. H., & Chikwiri, E. (2014). An assessment of the impact of the fast track land reform programme on the environment: The case of Eastdale Farm in Gutu district, Masvingo. Journal of Geography and Regional Planning, 7(8), 160–175. doi:10.5897/JGRP2013.0417
- Zhang, Z., Wang, X., Zhao, X., Liu, B., Yi, L., Zuo, L. … Hu, S. (2014). A 2010 update of national land use/cover database of China at 1: 100000 scale using medium spatial resolution satellite images. Remote Sensing of Environment, 149, 142–154. doi:10.1016/j.rse.2014.04.004
- Zikhali, P. (2008). Fast track land reform, tenure security, and investments in Zimbabwe. Sweden: Göteborg University.