
ABSTRACT
Urban area expansion is happening at much faster rates in Asian and African cities than elsewhere in the world. This study uses multi-temporal Landsat images to map the urban extent of six small to large cities in West Africa at four different time steps from the early 1970s–2010. The selected cities are Kumasi of Ghana, Daloa of Cote d’Ivoire, Abuja and Kano in Nigeria, Kindia of Guinea, and Ouagadougou of Burkina Faso. All cities revealed significant urban growth in both urban area and population; however, it was apparent that there was a lot of variability in urban area development. Exponential urban growth rates in the cities were measured as ranging between 0.026 and 0.077, with allometric scaling factors matching those of other countries.
1. Introduction
Urban area expansion is one of the most powerful anthropogenic forces changing the earth’s surface (Cui & Shi, Citation2012; Dawson, Hall, & Barr et al., Citation2009). Such expansion is associated with several interconnected but distinct processes such as an increase in population concentration and extensive alteration of the landscape due to infrastructure development (McDonnell & Pickett, Citation1990). However, literature treats urbanization differently depending on contexts (Marcotullio & Solecki, Citation2013; Satterthwaite, McGranahan, & Tacoli, Citation2010; Seto et al., Citation2013; Tisdale, Citation1942). For example, some studies limit urbanization to just the movement of people from rural to urban areas with population growth equating to urban migration (DESA/UN, Citation2011) while others argue that urbanization encompasses processes that cover some aspect of a region’s population, economy, or built infrastructure (Seto, Fragkias, Güneralp, & Reillyl, Citation2011). In this research, we view urbanization as a process in which built infrastructures expand, effectively changing the earth’s surface from one land cover or land use type to urban land use.
There is no doubt that population growth is one of the most important drivers of urban area expansion. Since 2010, more people live in urban than in rural areas around the world (DESA/UN, Citation2011). It is expected that by 2050 more than 60% of the global population will live in urban areas (DESA/UN, Citation2011). However, the urban growth rate differs markedly across the world. On the one hand, the population of many of the countries in Europe, Latin America, and North America is mostly urban. On the other hand, the majority of the population in countries in Africa and Asia (except China) remains mostly rural (Cui & Shi, Citation2012; DESA/UN, Citation2011; Seto et al., Citation2013). In the coming decades, major changes in the urban population are projected to take place in developing countries of Africa and Asia (DESA/UN, Citation2011; Satterthwaite et al., Citation2010), likely altering the landscapes greatly.
Historically, urban hubs have been the center of economic and social development but urbanization has also negatively affected the Earth’s environment (Marcotullio & Solecki, Citation2013; Rodríguez & Martine, Citation2008; Satterthwaite et al., Citation2010; Tisdale, Citation1942). As urban centers grow, the increasing concentration of people and economic activities demand further development of housing and public infrastructures changing the urban landscape (Thapa & Murayama, Citation2009). Several studies have investigated impacts of such change in urban landscape on the biota and physical environment (Alberti, Citation2005; Kalnay & Cai, Citation2003; Lambin et al., Citation2001; Marcotullio & Solecki, Citation2013; McDonnell & Pickett, Citation1990; Satterthwaite et al., Citation2010; Tian, Jiang, Yang, & Zhang, Citation2011). One serious impact of urban development is the land use and land cover (LULC) change in and around the urban centers including encroachment on croplands (Tian et al., Citation2011). LULC changes associated with urban development are considered one of the most disturbing processes and are the cause of changes in mesoscale weather patterns, water resources, and biodiversity (Alberti, Citation2005; Kalnay & Cai, Citation2003; Liu, Wang, & Long, Citation2010; McDonnell & Pickett, Citation1990). There is also evidence of changes in composition and structure of ecological communities associated with urban land use (Posa & Sodhi, Citation2006; Sadler, Small, Fiszpan, Telfer, & Niemela, Citation2006). Therefore, it is of particular importance to study urban land use expansion.
There are many urban growth studies around the world using remote sensing data (Attua & Fisher, Citation2011; Brinkmann, Schumacher, Dittrich, Kadaore, & Buerkert, Citation2012; Forkuor & Cofie, Citation2011; Kamh, Ashmawy, Kilias, & Christaras, Citation2012; Vermeiren, Van Rompaey, Loopmans, Serwajja, & Mukwaya, Citation2012; Linard, Tatem, & Gilbert, Citation2013; Mundia & Aniya, Citation2005; Seto et al., Citation2011; Wania, Kemper, Tiede, & Zeil, Citation2014; Weng, Citation2012). But the number of studies varies across the regions of the world. Seto et al. (Citation2011) performed a meta-analysis of studies that monitored changes in urban land-use using remote sensing for the period between 1988 and 2008. They listed 326 case studies around the world meeting their criteria. The majority of the studies were carried out in China, North America, Europe, and South West Asia, and only 29 studies addressed urban expansion in Africa (Seto et al., Citation2011). Yeboah (Citation2000, Citation2003) also mentions that urban expansion in Africa has not been adequately studied. Increasing availability of remotely sensed data in combination with easier access to advanced computer technology have driven an increase in the number of studies that focus on the expansion of urban and peri-urban areas in Africa (Attua & Fisher, Citation2011; Brinkmann et al., Citation2012; Forkuor & Cofie, Citation2011; Kamh et al., Citation2012; Karolien et al., 2012; Linard et al., Citation2013; Wania et al., Citation2014). One of the commonalities of these studies is the use of multi-temporal Landsat imagery.
Most of the research on urban land cover change in Africa presented above has focused on individual cities. These studies have mapped the land cover for the different time periods using mainly Landsat imagery and analyzed the change in urban growth. None of the studies so far have taken a comprehensive look at urban expansion across the region of West Africa even though the region is going through an extensive transformation in terms of population growth and urbanization (AFRICAPOLIS, Citation2008; Brinkmann et al., Citation2012; Denis & Moriconi-Ebrard, Citation2009; Freire, Lall, & Leipziger, Citation2014). Empirical studies have shown that cities might be modeled by relatively simple equations despite their inherent complexity. Attempts to quantitatively scale urban areas with urban populations can be traced back to the literature in the late 1950s (Betancourt, Citation2013, Stewart & Warntz, Citation1958). Social measurements, such as wages or gross domestic production increase per capita for larger cities typically, reveal scaling factors above 1, indicating that social metrics increase more than the relative population growth. Urban volume, area, and urban infrastructure typically decrease relative to population with urban growth, resulting in sublinear scaling factors. Studies in the United States, United Kingdom, Sweden, and China have investigated such relationships (Chen, Citation2010; Nordbeck, Citation1971; Stewart & Warntz, Citation1958). So far, we have not encountered an application of urban scaling to cities in West Africa. This study evaluates growth in urban extent and urban population in multiple West African cities from the early 1970s to 2010 and is the first to our knowledge to explore urban scaling relationships in this region.
2. Materials and methods
2.1. Study area
The study area covers six cities from five countries (). The six cities represent a mix of small to large size cities in West Africa. They are from five different countries: Ghana, Cote d’Ivoire, Nigeria, Guinea, and Burkina Faso. The selected cities had populations as low as 133,500 (Daloa) to slightly more than 2 million (Kano) in 1990. The population in the cities has grown substantially for the period 1990–2010.
2.2. Data
2.2.1. Earth observation data
Landsat data was obtained from the Earth Resources Observation and Science Center (http://glovis.usgs.gov/). It is hard to find cloud free wet season imagery in the region. If there was not at least a scene without cloud cover every 4–5 years, then scenes with cloud cover up to 10% – avoiding clouds just above the city and its immediate vicinity – were acquired. Finally, we have one scene for each year for the classification. A list of Landsat scenes along with their path/rows for the selected urban centers along with the date of acquisition for this study is provided in .
Table 1. Population of selected cities, ordered by 2010 population size.
Table 2. Landsat path/rows, years of acquisition, number of scenes and sensors used in the acquisition.
2.2.2. Population data
Population data for urban areas is notoriously difficult to find, especially for earlier years. Here, we used data from the statistical services of the individual countries, as well as Geohive (http://www.geohive.com/) and City Population (http://www.citypopulation.de/), which are websites that collect population statistics from around the globe. We also used data from the Columbia Gazetteer of the World (http://www.columbiagazetteer.org). Population numbers occasionally vary widely and it is not always clear if the population statistics collected correspond directly with the urban areas mapped. We collected population statistics from all individual cities for as many years between 1973 and 2014 as were available. provides the population totals that we were able to put together.
2.3. Methods
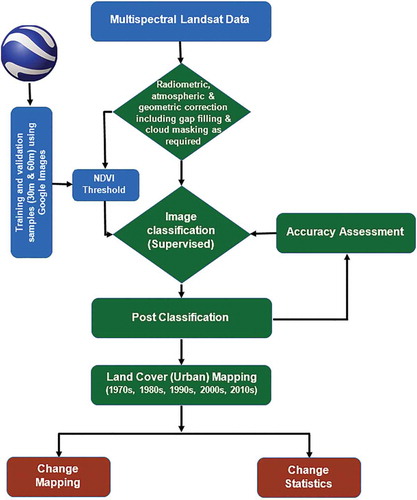
Mapping the urban area involves the following four steps: data preprocessing, image classification, accuracy assessment, and mapping the area. The process is summarized in a flow chart ().
Figure 1. Selected cities in West Africa.
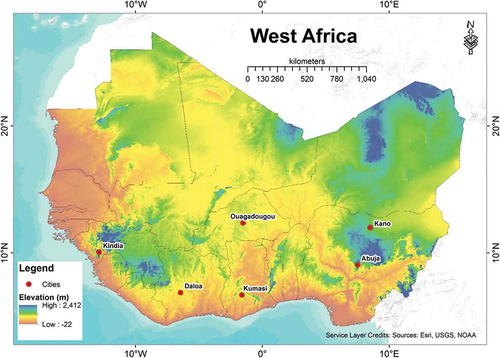
Figure 2. Flow chart of mapping and analyzing urban growth in West Africa.
2.3.1. Data pre-processing
The Landsat images for this research cover the entire period of the Landsat mission (). The selected Landsat images were radiometrically and atmospherically corrected. The Landsat MultiSpectral Scanner (MSS) images were corrected using Fast Line-of-sight Atmospheric Analysis of Spectral Hypercubes. The Landsat TM and ETM+ images were corrected using the Landsat Ecosystem Disturbance Adaptive Processing System (Masek et al., Citation2013; Vermote et al., Citation1997). Some of the images, especially images from the early 1970s, were geometrically corrected using a base map obtained from the digital chart of the world (National Imagery and Mapping Agency, Citation2000) to maintain proper alignment. Cloud cover and associated shadows were masked using an unsupervised classification technique (Irish, Barker, Goward, & Arvidson, Citation2006).
Several scenes from 2005 to 2010 from Landsat 7 were affected by the Scan Line Corrector failure. We filled the gaps using the Delaunay triangulation of surface fitting algorithm, based on the neighboring pixel values (de Berg, van Kreveld, Overmars, & Schwarzkopf, Citation2000; Lee & Schachter, Citation1980). The algorithm interpolates data creating equiangular triangles based on the values of nearest neighbors (de Berg et al., Citation2000). In this process, the assumption is that the pixels in close proximity to the gaps have similar spectral characteristics as the pixels in the gap (Chen, Zhu, Vogelmann, Gao, & Jin, Citation2011).
2.3.2. Image classification
In this study, we used the maximum likelihood classification to map the urban built-up areas. The classification process involves three steps: defining the training pixels, extraction of signatures from the identified training pixels, and classification of the image.
We collected training and validation pixels using Google Earth imagery. We selected Google Earth images because they are available at high spatial resolution and are updated regularly – every 1–3 years (Google Earth Help). Furthermore, these images are better alternatives for training and validation if the area is large and field data are hard to come by because of their accuracy (Knorn et al., Citation2009; Potere, Citation2008). For the collection of Google Earth pixels, we used the extent of the Landsat scenes that covered the selected cities as the sampling frame. We randomly collected about three thousand pixels each, at 30 m and 60 m. For each grid cell, we assigned a maximum of three dominating land cover classes from 11 possible classes () (Figure 3). We replaced pixels with poor resolution or cloud contamination. The majority of the pixels were from images acquired in 2010 or later.
Table 3. Land use/land cover class (LULC) and number of pixels from Google Earth™ images retained for training and validation.
Only pixels with 50% or more of the same land cover class were retained for training and validation. After filtering out pixels not meeting the criteria, we aggregated some of the land cover classes. We grouped buildings, paved roads, unpaved roads, and airports to a new class called impervious. Similarly, the croplands and fallow croplands were combined. Water bodies and wetlands were grouped as water. Furthermore, if there were less than 10 pixels for a certain land cover type, we dropped that land cover class during classification. The number of pixels for the six resulting land cover classes over the selected cities varied (). After filtering, the total number of pixels left for training and validation was much lower, as much as 68% less (such as in Abuja) than the originally collected three thousand pixels.
In conventional image classification techniques, the training samples are matched temporally to the image used for classification (Laborte, Maunahan, & Hijmans, Citation2010). But here we aimed to classify older images as far back as 1973. Studies have shown effective use of the Normalized Difference Vegetation Index (NDVI) (Bauer, Heinert, Doyle, & Yuan, Citation2004; Gillies, Brim Box, Symanzik, & Rodemaker, Citation2003; Masek, Lindsay, & Goward, Citation2000) to distinguish vegetated (e.g. croplands or grasslands) and non-vegetated areas (impervious surfaces urban built-ups including road or residential area). NDVI is derived from the red to near-infrared reflectance ratio (Pettorelli et al., Citation2005). So, we decided to use NDVI calculated based on the older images to select subsets of samples from . For example, to define a subset of training and validation samples for an older year, e.g.1973, the Google Earth samples were overlaid on NDVI values obtained from the Landsat scene of 1973. The samples were then filtered using the NDVI threshold as mentioned in . This approach improved the spectral separability – measured by the Jeffries-Matusita Transformed Divergence values – of the training and validation samples. Standard separability values vary from 0 to 2 with a value closer to 2 showing higher separability. The spectral separability for the training data was 1.5 or more for every image. Approximately two thirds of the pixels for each land cover class were used for training and the remaining one third of the pixels were used for validation.
Table 4. NDVI threshold used for refining ground truth pixels collected using Google Earth.
2.3.3. Accuracy assessment
The accuracy of the classifications was determined based on a confusion matrix (Congalton & Green, Citation2009) using ground truth pixels collected from Google Earth images. The overall accuracy (OA) is obtained by summing the number of correctly classified pixels and dividing by the total number of pixels while the Kappa statistic (κ) is calculated based on the percentage of agreement of pixels in the two maps (Jensen, Citation2005; Lillesand, Kiefer, & Chipman, Citation2006).
Although used widely, there are limitations in using Kappa statistics in many cases. It is primarily because of the assumption of the independence of the samples used to evaluate map accuracy (Foody, Citation2004; Pontius & Millones, Citation2011; Wilkinson, Citation2005). Therefore, in addition to Kappa, we also calculated quantity and allocation disagreements (AD) for the classified urban maps. The quantity disagreement (QD) is the amount of difference between the reference and a comparison maps due to the less than perfect match in the proportions of classes. The AD measures the imperfect match in the spatial allocation of the classes given the proportions of the classes in the reference and the comparison maps (Pontius & Millones, Citation2011).
2.3.4. Change analysis
After image classification, we categorized each pixel into either urban or non-urban. For the mapping and analysis, we created a buffer of 30 km × 30 km box containing the city and prospective area of urban built-up area expansion. The use and selection of the size of the buffer are based on the urban extent of the cities and are typical in urban extent analysis (Brinkmann et al., Citation2012; Small, Citation2005) but likely overestimate the urban area. Furthermore, to maintain consistency, it is assumed that if a pixel is classified as urban at the earlier time step then the pixel remains urban in subsequent years as conversion of urban land use is one of the most irreversible impacts of human activities (Seto et al., Citation2011; Xian et al., Citation2011). For example, if a pixel in Kumasi is identified as an urban pixel in 1973, the same pixel remains urban in 1986, 2005, and 2010. So, if a pixel is identified as urban in an early year, the pixel will continue to be carried as an urban pixel in the later years. This assumption could result in overestimation of the urban area in later years if non-urban areas are mistakenly classified as urban in earlier years.
2.3.5. Urban scaling
Attempts to quantitatively scale urban areas with urban populations can be traced back to the literature in the late 1950s (Bettencourt, Citation2013; Stewart & Warntz, Citation1958). Several empirical studies have found that a range of urban properties, including urban area, can be well described by power-law scaling relations as follows:
where Y0 and β are constants. Several studies have shown that social measurements, such as wages or gross domestic production increase per capita for larger cities (β > 1), while typically, urban volume, area, or urban infrastructure decrease with urban growth relative to population (β < 1). Here, we will establish the scaling relationship between urban population totals and urban area both for the individual West African cities, to understand how the individual cities scale when growing, and for different time periods (1980–1990, 2000s, 2010s) for which we have population and urban area values available.
3. Results
3.1. Urban built-up maps
The Kappa statistics (κ) of the urban built-up maps vary from 0.54 to 0.98 whereas the OA varies from 68% to 98% (). For year-city pairs, the κ and OA values are greater than 0.75 and 80%, respectively, except for Kumasi in 1973 (OA 75%) and 1986 (OA 68%), and Kindia in 1990 (OA 74%). Furthermore, the QD and AD, which for the majority of the urban built-up maps, are mostly less than 10%, with some exceptions. The QD shows the difference between the ground truth and classified map due to less than perfect match in the proportions of classes. The AD provides errors in spatial allocation of the classes between the ground truth and classified map.
Table 5. Accuracy assessments of classified images and total built-up area.
The reasons for errors in the classified maps could be due to the limitations in classification algorithm and errors in training samples. The accuracy of some of the older maps such as Kumasi, 1973 and 1986, Kindia 1990, Abuja 1986, and Ouagadougou 1986 was relatively poor likely due to temporal mismatch between the training sample and the images. Despite these limitations, the majority of the urban built-up maps have a fair to good accuracy.
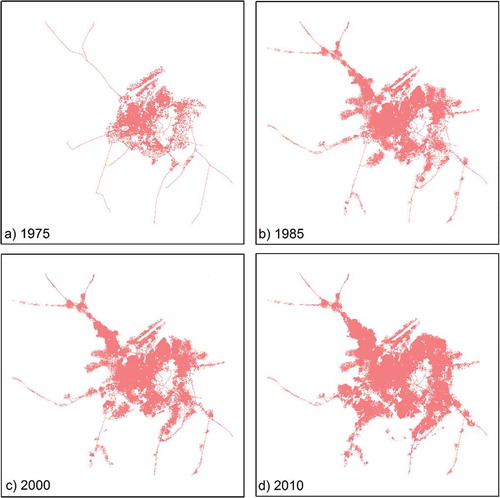
The urban built-up area in each city has grown over the past several decades (–). In general, cities expanded either along the road network or around the core city area. Kumasi primarily expanded near the road network and along the city periphery. Daloa, Kindia, and Ouagadougou grew on the city fringes rather than along the roads. Abuja and Kano, both in Nigeria, grew both within the core city area and along the roads.
Figure 3. Two data points (30 m × 30 m) collected using Google Earth. The pixel on the left panel shows a mix of land cover classes, cropland (70%) and grass and herbaceous near Abuja, Nigeria. The pixel on the right panel shows a mixed pixel with buildings (80%) and unpaved roads (20%) near Kano, Nigeria.
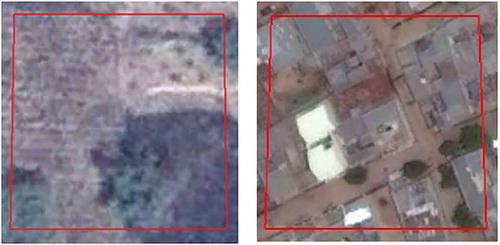
Figure 4. Urban built-up area of the city of Daloa, Cote d’Ivoire.
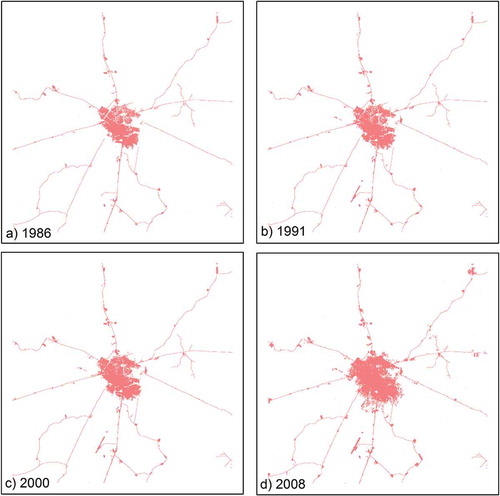
Figure 5. Urban built-up area of the city of Kindia, Guinea.
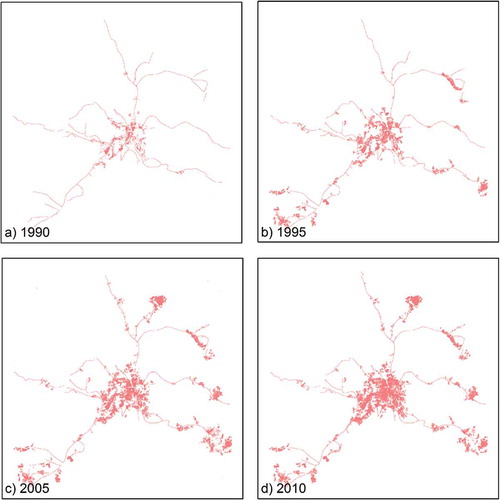
Figure 6. Urban built-up area of the city of Ouagadougou, Burkina Faso.
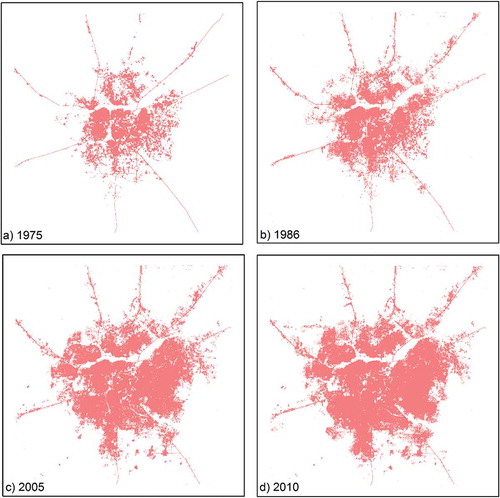
Figure 7. Urban built-up area of the city of Kumasi, Ghana.
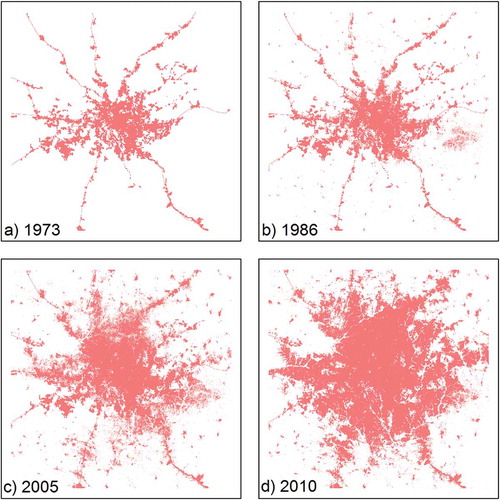
Figure 8. Urban built-up area of the city of Abuja, Nigeria.
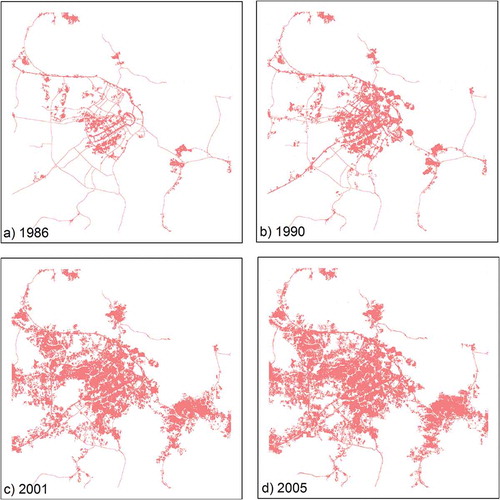
Figure 9. Urban built-up area of the city of Kano, Nigeria.
The cities of Kindia and Daloa, the smallest among the cites, have expanded the least ().
3.2. Expansion of urban-built up area
provides the total urban land area for each of the cities and shows the urban area growth since 1970. We are interested in understanding if the relation between urban area and population follows the allometric scaling law, and thus we have fitted exponential curves against the urban areas. The exponential curve fit very well for each city, with the minimum R2 at 0.85 (Kano). The exponential variable, rp, provides the relative urban area growth rate for each of the cities. The relative growth rate varied between 0.0265 (Kano) and 0.0769 (Abuja).
Figure 10. Urban area over the years since 1970 for (a) Daloa and Kindia, (b) Ougadougou and Kumasi, and (c) Abuja and Kano.
3.3. Urban scaling
Since we only have a limited number of population-urban area pairs, we summarized all available urban population and urban area estimates into three time periods: 1975–1980s, 1990–2000s, and 2005–2010 (). As would be expected from the literature, the cities reveal increasing scaling factors for later decades. The earliest years reveal a scaling factor as low as 0.5282. These early years reveal that Daloa is an outlier. If we would ignore Daloa, the scaling factor would be even lower (0.425, results not shown), the R2 also increases to 0.98 if Daloa would be ignored. The period between 1990 and the early 2000s reveals a scaling factor of 0.6576, and the last period, 2005–2010, reveals a scaling factor of 0.8481, both revealing very high R2 values.
Figure 11. Temporal scaling of the growth in urban area and population.
3.4. Urban temporal scaling
We found population data for Daloa, Abuja, and Ougadougou for four of the same years as we have urban area estimates. The other cities had 3 or fewer years with both population and area estimates, and as a result we will not analyze their temporal scaling. We provide a temporal growth report for the three cities with at least 4 years of available information. Daloa is our smallest city and reveals a scaling factor of 0.6588. The R2 for the relationship between ln(population) and ln(area) is 0.86. Abuja is a planned city in Nigeria. Abuja only really began to develop in the early 1990s and has since grown from a population of 44k (1986) to more than 2 million (2010). We have population-area pairs for 4 years: 1986, 1990, 2001, and 2005. The scale factor for Abuja was found at 0.3864, with an R2 of 0.9521. Ougadougou’s scaling factor was found to be 0.4698, with an R2 of 0.98. It turns out that Daloa’s urban area has grown much more in comparison with its population than Abuja’s area, which is very compact. Ougadougou is in between these two cities.
4. Discussion
At the global scale, there are at least 10 different land cover data sets which can be used to identify urban areas. But it is difficult to pick one data set over the others as the total urban land area among the data sets varies widely (Potere et al., Citation2009). Also, very few data sets are available for multiple years to study the growth of urban land use in an area. In addition, the resolution of global data sets varies from 300 m to 1000 m (Gong et al., Citation2013) making their usefulness limited for subnational and national level studies. Recently, Gong et al. (Citation2013) have created a global land cover map at 30 m × 30 m resolution using Landsat TM/ETM+ images. Most of the Landsat images used in Gong et al. (Citation2013) were from circa 2010.
Gong et al. (Citation2013) land cover data has an OA of about 65%. However, the user’s and producer’s accuracies for the impervious surface, which includes urban areas, are 31% and 11%, respectively. This new data set significantly underestimated urban land area in West Africa. For example, for the city of Kindia, Gong et al. (Citation2013) estimated the area of impervious surface to be only around 0.06% of the area obtained in this study. Similarly, larger cities such as Abuja and Kano were also underestimated in urban area. In Gong et al. (Citation2013), impervious area for Abuja was around 2670 ha (14%) compared to our estimate of about 19,000 ha, while it was 3450 ha (21%) for Kano compared to about 16,500 ha that we estimated in this study. This shows the limitation of image classification techniques adopted for global scale mapping when used to identify urban land use such as in Gong et al. (Citation2013).
The Lincoln Institute of Land Policy has prepared an Atlas of Urban Expansion which contains maps of 120 cities around the world for two time periods, 1990 and 2000, using Landsat MSS and TM/ETM+ images. Only five cities in the Atlas are from West Africa (Angel, Parent, Civco, & Blei, Citation2010). Ouagadougou was the only city which was part of our study as well. According to the Atlas, the urban land area in Ouagadougou was about 6660 ha in 1990 and about 14,940 ha in 2000. These values are lower than the urban built-up areas obtained in this study, which were about 11,860 ha (for 1986) and 20,410 ha (for 2005).
Ade and Afolabi (Citation2013) mapped the city of Abuja in Nigeria for three years: 1987, 1999, and 2007. According to this study, the built-up area grew from 7875 ha to 14,722 ha for the period 1987–1999. In 2007, the built-up area was found to be about 41,622 ha. Ujoh, Kwabe, and Ifatimehin (Citation2010) also investigated Abuja and found a built-up area of 3360 ha in 1987, followed by 15,440 ha in 2001 and 23,504 ha in 2006. Interestingly they found half the built-up area compared to Ade and Afolabi (Citation2013) in 1987 and 2006, but approximately the same around 2000. We found that the urban built-up area in Abuja was 4260 ha and 15,870 ha for 1986 and 2001, respectively, which matches with Ujoh et al. (Citation2010) very closely. We found 19,002 ha in 2005, which is about 20% less than what Ujoh et al. (Citation2010) found and almost 50% less than the results obtained by Ade and Afolabi (Citation2013) for 2007.
We observed discrepancies on urban area estimation for the cities in this study and previous studies done in some of the same cities. Some of the factors for such discrepancies can be attributed to factors such as ambiguity in defining an urban area and limitations of the classification algorithm and errors in training samples (Foody, Citation2002; Schneider, Friedl, & Potere, Citation2009, Citation2010). Inconsistency in defining urban area makes the comparison of urban area difficult among various previous studies.
The long-term average annual expansion of urban built-up area in the six cities is about 9.5%, which is about 4% for a sample of 30 cities used in Angel et al. (Citation2010) study. The growth could be attributed to the rise in population. But we find that the growth in physical area and population manifested differently in the six cities. Most of the cities studied here revealed a significant increase in population density, although the rates differed by city. For example, the population density increased from 44 people per hectare in 1986 for Daloa to 51 people per hectare in 2008. Abuja’s population density increased the most, from just 10 people per hectare in 1986 to more than 100 in 2005. Ougadougo also became much denser, increasing from 22 people per hectare in 1975 to more than 81 in 2010.
The urban built-up maps prepared in this study show that for the past four decades the cities in the region have experienced extensive transformations. The city centers were infilling and the fringes around the core city area were transforming to urban landscape. Another major feature of the growth was expansion along the major transportation corridors and some pockets along the road network. This pattern of growth looks similar to the urban growth reported from other cities in Africa (Abebe, Citation2013; Ade & Afolabi, Citation2013; Olayiwola & Igbavboa, Citation2014), but the rate of growth in urban built-up area varies among the cities.
Early studies found scaling exponents of 0.75 for cities in the USA, England, and Wales (Stewart & Warntz, Citation1958). Nordbeck (Citation1971) later revealed a scaling factor of 0.66 for 1800 urban areas in Sweden, which he explains as matching the theoretical value assuming that area has a dimension of 2 and population has a dimension of 3 (b = Da/Dp = 2/3). Chen (Citation2010) used 660 Chinese cities in 2005 and found a scaling factor of 0.85. He explains that this corresponds with theoretical values from simulation experiments which found that the fractal dimension of urban areas is approximately 1.701, instead of two as discussed by Nordbeck (Citation1971). Chen (Citation2010) assumes that the dimension of urban populations is 2, resulting in a scaling factor of 0.85 (1.701/2). Others investigating American cities have found similar scaling factors, e.g. 0.63 (Paulsen, Citation2012) and 0.76 (McGrath, Citation2005). Sublinear scaling factors are very common and are expected when studying how urban area scales by built-up area. In this article, we found scaling factors to increase from 0.5282 in the early years, to 0.6575 in the early 1990–2000s, to 0.8481 in the later years. Interestingly, it appears that the West African cities studied in this article revealed a very similar scaling factor in the 1990–2000s period, as the cities in Sweden in the 1960s, and American cities around the 1990s. These West African cities scaled very similarly to the urban areas in China in the later years, with a scaling factor of 0.8481 which matches the scaling factor found by Chen (Citation2010) for Chinese cities in 2005.
Besides investigating many cities of different sizes during one-time period, some authors have also plotted scaling relationships for one city over multiple years. Chen (Citation2010) investigated the relationship between urban population and built-up area in Beijing between 1991 and 2004 and found a scale factor of 1.8854, indicating that the urban area of Beijing has grown quicker than the urban population since 1991. In a follow-up study, Chen found a scale factor of 0.8605 for the growth of Xinyang between 1949 and 2004. We found much lower scaling factors for the West African cities over time, ranging from 0.3864 for Abuja to 0.6588 for Daloa, indicating that these cities grow in a much more compact manner than the Chinese cities (Chen, Citation2010, Citation2014).
It is important to realize that these exponential models only hold for a limited amount of time for cities, because they basically suggest unlimited growth. Eventually, resources will max out and cities are unable to grow further. As such, logistic growth models might be more appropriate in the long run. However, we have shown that the allometric scaling laws work very well for African cities, resulting in scaling factors similar to some of the Chinese cities.
5. Conclusions
Despite many shortcomings of remote sensing data in terms of either spectral quality and atmospheric effects or sub-pixel mixing within the urban space (Potere et al., Citation2009, Strahler et al., Citation2006), we mapped the urban built-up area in six cities of West Africa from the early 1970s to 2010 with fair accuracy.
All the West African cities that we studied here revealed a significant expansion in both urban built-up area and population. However, we found significant variability in expansion rates. We found that in general the cities were more compact in the early years than cities in the USA and China, but were very similar in later periods. As far as we are aware, this is the first study directly applying allometric scaling laws to cities in Africa.
Acknowledgments
The authors would like to thank Braden Owsley for his time editing the manuscript. We would also like to acknowledge Dr. Bret Wallach, Professor at the Department of Geography and Environmental Sustainability at the University of Oklahoma for supplying some of the city population data for this analysis. Thanks to two anonymous reviewers for their feedback/comments on the earlier versions of this paper.
Disclosure statement
No potential conflict of interest was reported by the authors.
References
- Abebe, G. A. (2013). Quantifying urban growth pattern in developing countries using remote sensing and spatial metrics: A case study in Kampala, Uganda. ( Thesis submitted to Master of Science in Geo-Information Science and Earth Observation). University of Twentee, the Netherlands, pp. 93. Retrived January, 2015, from https://www.itc.nl/library/papers_2013/msc/upm/abebe.pdf
- Ade, M. A., & Afolabi, Y. D. (2013). Monitoring urban sprawl in the Federal Capital Territory of Nigeria using remote sensing and GIS techniques. Ethiopian Journal of Environmental Studies and Management, 6(1), 82–95.
- AFRICAPOLIS. (2008). Africapolis: Urbanization trends 1950–2020: A geo-statistical approach West Africa. Agence Francaise de developpement (AFD). SEDET Developing Societies in Space and Time teams (CNRS/Université Paris Diderot) Retrieved August, 2016, from http://www.fao.org/3/contents/78f91cb9-0e55-5ab6-bd9f-445071ef6ea8/i3222e15.pdf
- Alberti, M. (2005). The effects of urban patterns on ecosystem function. International Regional Science Review, 28(2), 168–192. doi:10.1177/0160017605275160
- Angel, S., Parent, J., Civco, D. L., & Blei, A. M., (2010). Atlas of urban expansion. Cambridge MA: Lincoln Institute of Land Policy. Retrieved January, 2016, from http://www.lincolninst.edu/subcenters/atlas-urban-expansion/
- Attua, E. M., & Fisher, J. B. (2011). Historical and future land-cover change in a municipality of Ghana. Earth Interactions, 15(9), 1-26.
- Bauer, M. E., Heinert, N. J., Doyle, J. K., & Yuan, F. (2004, May). Impervious surface mapping and change monitoring using Landsat remote sensing. In American Society for Photogrammetry and Remote Sensing annual conference proceedings (Vol. 10). Denver, CO, USA, May 23-28, 2004.
- Bettencourt, L. M. (2013). The origins of scaling in cities. Science, 340(6139), 1438–1441. doi:10.1126/science.1235823
- Brinkmann, K., Schumacher, J., Dittrich, A., Kadaore, I., & Buerkert, A. (2012). Analysis of landscape transformation processes in and around four West African cities over the last 50 years. Landscape and Urban Planning, 105(1–2), 94–105. doi:10.1016/j.landurbplan.2011.12.003
- Chen, J., Zhu, X., Vogelmann, J. E., Gao, F., & Jin, S. (2011). A simple and effective method for filling gaps in Landsat ETM+ SLC-off images. Remote Sensing of Environment, 115(4), 1053–1064. doi:10.1016/j.rse.2010.12.010
- Chen, Y. (2010). Characterizing growth and form of fractal cities with allometric scaling exponents. Discrete Dynamics in Nature and Society, 2010, 1–22. Article ID 194715, 22 10.1155/2010/194715.
- Chen, Y. (2014). An allometric scaling relation based on logistic growth of cities. Chaos, Solitons & Fractals, 65, 65–77. doi:10.1016/j.chaos.2014.04.017
- Congalton, R. G., & Green, K. (2009). Assessing the accuracy of remotely sensed data: Principles and practices (2nd ed.). Boca Raton, FL: CRC Press.
- Cui, L., & Shi, J. (2012). Urbanization and its environmental effects in Shanghai, China. Urban Climate, 2, 1–15. doi:10.1016/j.uclim.2012.10.008
- Dawson, R. J., Hall, J. W., Barr, S. L., Batty, M., Bristow, A. L., Carney, S., … Köhler, J. (2009). A blueprint for the integrated assessment of climate change in cities. Tyndall Center for Climate Change Research, Working Paper, 129. pp. 26.
- de Berg, M., van Kreveld, M., Overmars, M., & Schwarzkopf, O. C. (2000). Delaunay triangulations. In Computational Geometry: Algorithms and Applications, (pp. 183–210). Berlin Heidelberg: Springer.
- Denis, E., & Moriconi-Ebrard, F. (2009). Urban growth in West Africa: From explosion to proliferation. La Chronique du CEPED, 2009. pp. 1–5. Retrieved August, 2016, from https://halshs.archives-ouvertes.fr/hal-00410475/document.
- DESA/UN. (2011). Population distribution, urbanization, internal migration and development: an international perspective, department of economic and social affairs, population division of the united nations. Retrieved from www.unpopulation.org
- Earth Resources Observation and Science Center (EROS). USGS Global Visualization Viewer. Retrieved January, 2014–July 2015, from http://glovis.usgs.gov/
- Foody, G. M. (2002). Status of land cover classification accuracy assessment. Remote Sensing of Environment, 80, 185–201. doi:10.1016/S0034-4257(01)00295-4
- Foody, G. M. (2004). Thematic map comparison: Evaluating the statistical significance of differences in classification accuracy. Photogrammetric Engineering & Remote Sensing, 70, 627–633. doi:10.14358/PERS.70.5.627
- Forkuor, G., & Cofie, O. (2011). Dynamics of land-use and land-cover change in Freetown, Sierra Leone and its effects on urban and peri-urban agriculture–a remote sensing approach. International Journal of Remote Sensing, 32(4), 1017–1037. doi:10.1080/01431160903505302
- Freire, M. E., Lall, S., & Leipziger, D. (2014). Africa’s urbanization: Challenges and opportunities. The Growth Dialogue, Working Paper No. 7, 1–30.
- Geohive. Global population statistics. Retrieved June 19, 2015–September 19, 2014, from http://www.geohive.com/
- Gillies, R. R., Brim Box, J., Symanzik, J., & Rodemaker, E. J. (2003). Effects of urbanization on the aquatic fauna of the Line Creek watershed, Atlanta—A satellite perspective. Remote Sensing of Environment, 86(3), 411–422. doi:10.1016/S0034-4257(03)00082-8
- Gong, P., Wang, J., Yu, L., Zhao, Y., Zhao, Y., Liang, L., … Chen, J. (2013). Finer resolution observation and monitoring of global land cover: First mapping results with Landsat TM and ETM+ data. International Journal of Remote Sensing, 34(7), 2607–2654. doi:10.1080/01431161.2012.748992
- Irish, R. R., Barker, J. L., Goward, S. N., & Arvidson, T. (2006). Characterization of the Landsat-7 ETM+ automated cloud-cover assessment (ACCA) algorithm. Photogrammetric Engineering & Remote Sensing, 72(10), 1179–1188. doi:10.14358/PERS.72.10.1179
- Jensen, J. R. (2005). Introductory digital image processing: a remote sensing perspective (3rd ed.). Upper Saddle River, NJ: Prentice Hall.
- Kalnay, E., & Cai, M. (2003). Impact of urbanization and land-use change on climate. Nature, 423(6939), 528–531. doi:10.1038/nature01675
- Kamh, S., Ashmawy, M., Kilias, A., & Christaras, B. (2012). Evaluating urban land cover change in the Hurghada area, Egypt, by using GIS and remote sensing. International Journal of Remote Sensing, 33(1), 41–68. doi:10.1080/01431161.2010.550331
- Knorn, J., Rabe, A., Radeloff, V. C., Kuemmerle, T., Kozak, J., & Hostert, P. (2009). Land cover mapping of large areas using chain classification of neighboring Landsat satellite images. Remote Sensing of Environment, 113(5), 957–964. doi:10.1016/j.rse.2009.01.010
- Laborte, A. G., Maunahan, A. A., & Hijmans, R. J. (2010). Spectral signature generalization and expansion can improve the accuracy of satellite image classification. Plos One, 5(5), e10516. doi:10.1371/journal.pone.0010516
- Lambin, E. F., Turner, B. L., Geist, H. J., Agbola, S. B., Angelsen, A., Bruce, J. W., … Xu, J. (2001). The causes of land-use and land-cover change: Moving beyond the myths. Global Environmental Change, 11(4), 261–269. doi:10.1016/S0959-3780(01)00007-3
- Lee, D. T., & Schachter, B. J. (1980). Two algorithms for constructing a delaunay triangulation. International Journal of Computer & Information Sciences, 9(3), 219–242. doi:10.1007/BF00977785
- Lillesand, T. M., Kiefer, R. W., & Chipman, J. W. (2006). Remote sensing and image interpretation (4th ed.). New York, NY: John Wiley and Sons.
- Linard, C., Tatem, A. J., & Gilbert, M. (2013). Modelling spatial patterns of urban growth in Africa. Applied Geography, 44, 23–32. doi:10.1016/j.apgeog.2013.07.009
- Liu, Y. S., Wang, J. Y., & Long, H. L. (2010). Analysis of arable land loss and its impact on rural sustainability in Southern Jiangsu Province of China. Journal of Environmental Management, 91(3), 646–653. doi:10.1016/j.jenvman.2009.09.028
- Marcotullio, P. J., & Solecki, W. (2013). What is a city? An essential definition for sustainability. In C.G. Boone and M. Fragkias (eds.), Urbanization and Sustainability: Linking Urban Ecology, Environmental Justice and Global Environmental Change (pp. 11-25). Springer.
- Masek, J., Lindsay, F., & Goward, S. N. (2000). Dynamics of urban growth in the Washington DC metropolitan area, 1973-1996, from Landsat observations. International Journal of Remote Sensing, 21(18), 3473–3486. doi:10.1080/014311600750037507
- Masek, J. G., Vermote, E. F., Saleous, N., Wolfe, R., Hall, F. G., Huemmrich, F., … Lim, T. K. (2013). LEDAPS calibration, reflectance, atmospheric correction preprocessing code, version 2. Model product. Oak Ridge, TN: Oak Ridge National Laboratory Distributed Active Archive Center. Retrived from http://daac.ornl.gov
- McDonnell, M. J., & Pickett, S. T. (1990). Ecosystem structure and function along urban-rural gradients: An unexploited opportunity for ecology. Ecology, 71, 1232–1237. doi:10.2307/1938259
- McGrath, D. T. (2005). More evidence on the spatial scale of cities. Journal of Urban Economics, 58(1), 1–10.
- Mundia, C., & Aniya, M. (2005). Analysis of land use/cover changes and urban expansion of Nairobi city using remote sensing and GIS. International Journal of Remote Sensing, 26(13), 2831–2849. doi:10.1080/01431160500117865
- National Imagery and Mapping Agency (2000). National Geospatial-Intelligence Agency, Retrived January, 2015, from https://www.nga.mil/
- Nordbeck, S. (1971). Urban allometric growth. Geografiska Annaler. Series B, Human Geography, 53(1), 54–67.
- Olayiwola, A. M., & Igbavboa, O. E. (2014). Land use dynamics and expansion of the built-up area in Benin City, Nigeria. Mediterranean Journal of Social Sciences, 5(20), 2506.
- Paulsen, K. (2012). Yet even more evidence on the spatial size of cities: Urban spatial expansion in the US, 1980–2000. Regional Science and Urban Economics, 42(4), 561–568. doi:10.1016/j.regsciurbeco.2012.02.002
- Pettorelli, N., Vik, J. O., Mysterud, A., Gaillard, J.-M., Tucker, C. J., & Stenseth, N. C. (2005). Using the satellite-derived NDVI to assess ecological responses to environmental change. Trends in Ecology & Evolution, 20, 503–510. doi:10.1016/j.tree.2005.05.011
- Pontius, R. G., Jr, & Millones, M. (2011). Death to Kappa: Birth of quantity disagreement and allocation disagreement for accuracy assessment. International Journal of Remote Sensing, 32(15), 4407–4429. doi:10.1080/01431161.2011.552923
- Population Statistics for Countries. Administrative areas, cities and agglomerations – interactive maps and charts Columbia Gazetteer of the world. Retrieved September, 2016, from http://www.columbiagazetteer.org
- Posa, M. R. C., & Sodhi, N. S. (2006). Effects of anthropogenic land use on forest birds and butterflies in Subic Bay, Philippines. Biological Conservation, 129(2), 256–270. doi:10.1016/j.biocon.2005.10.041
- Potere, D. (2008). Horizontal positional accuracy of Google Earth’s high-resolution imagery archive. Sensors, 8(12), 7973–7981. doi:10.3390/s8127973
- Potere, D., Schneider, A., Angel, S., & Civco, D. L. (2009). Mapping urban areas on a global scale: which of the eight maps now available is more accurate? International Journal of Remote Sensing, 30(24), 6531–6558.
- Rodríguez, J., & Martine, G. (2008). Urbanization in Latin America and the Caribbean: experiences and lessons learned. In The New Global Frontier: Urbanization, Poverty and Environment in the 21st Century, (pp. 353-367). EarthScan.
- Sadler, J., Small, E., Fiszpan, H., Telfer, M. G., & Niemela, J. (2006). Investigating environmental variation and landscape characteristics of an urban–rural gradient using woodland carabid assemblages. Journal of Biogeography, 33(6), 1126–1138. doi:10.1111/jbi.2006.33.issue-6
- Satterthwaite, D., McGranahan, G., & Tacoli, C. (2010). Urbanization and its implications for food and farming. Philosophical Transactions of the Royal Society B: Biological Sciences, 365(1554), 2809–2820. doi:10.1098/rstb.2010.0136
- Schneider, A., Friedl, M. A., & Potere, D. (2009). A new map of global urban extent from MODIS satellite data. Environmental Research Letters, 4(4), 044003. doi:10.1088/1748-9326/4/4/044003
- Schneider, A., Friedl, M. A., & Potere, D. (2010). Mapping global urban areas using MODIS 500-m data: New methods and datasets based on ‘urban ecoregions’. Remote Sensing of Environment, 114(8), 1733–1746.
- Seto, K. C., Fragkias, M., Güneralp, B., & Reilly, M. K. (2011). A meta-analysis of global urban land expansion. Plos ONE, 6(8), e23777. doi:10.1371/journal.pone.0023777
- Seto, K. C., Parnell, S., & Elmqvist, T. (2013). A global outlook on urbanization, biodiversity and ecosystem services: Challenges and opportunities. In Elmqvist, T., M. Fragkias, J. Goodness, B. Güneralp, P.J. Marcotullio, R.I. McDonald, S. Parnell, M. Schewenius, M. Sendstad, K.C. Seto, & C. Wilkinson (Eds.), Urbanization, biodiversity and ecosystem services: Challenges and opportunities: A global assessment (pp. 9–12). Springer. doi:10.1007/978-94-007-7088-1_1
- Small, C. (2005). A global analysis of urban reflectance. International Journal of Remote Sensing, 26(4), 661–681. doi:10.1080/01431160310001654950
- Stewart, J. Q., & Warntz, W. (1958). PHYSICS OF POPULATION DISTRIBUTION. Journal of Regional Science, 1(1), 99–121. doi:10.1111/jors.1958.1.issue-1
- Strahler, A. H., Boschetti, L., Foody, G. M., Friedl, M. A., Hansen, M. C., Herold, M., … Woodcock, C. E. (2006). Global land cover validation: Recommendations for evaluation and accuracy assessment of global land cover maps. European Communities, Luxembourg, 51 (GOFC-GOLD Report No. 25).
- Thapa, R. B., & Murayama, Y. (2009). Examining spatiotemporal urbanization patterns in Kathmandu Valley, Nepal: Remote sensing and spatial metrics approaches. Remote Sensing, 1(3), 534–556. doi:10.3390/rs1030534
- Tian, G., Jiang, J., Yang, Z., & Zhang, Y. (2011). The urban growth, size distribution and spatio-temporal dynamic pattern of the Yangtze River Delta megalopolitan region, China. Ecological Modelling, 222(3), 865–878. doi:10.1016/j.ecolmodel.2010.09.036
- Tisdale, H. (1942). The Process of Urbanization. Social Forces, 20(3), 311–316. doi:10.1093/sf/20.3.311
- Ujoh, F., Kwabe, I. D., & Ifatimehin, O. O. (2010). Understanding urban sprawl in the Federal Capital City, Abuja: Towards, sustainable urbanization in Nigeria. Journal of Geography and Regional Planning, 3(5), 106–113.
- Vermeiren, K., Van Rompaey, A., Loopmans, M., Serwajja, E., & Mukwaya, P. (2012). Urban growth of Kampala, Uganda: Pattern analysis and scenario development. Landscape and Urban Planning, 106(2), 199–206. doi:10.1016/j.landurbplan.2012.03.006
- Vermote, E., El Saleous, N., Justice, C. O., Kaufman, Y. J., Privette, J. L., Remer, L., … Tanré, D. (1997). Atmospheric correction of visible to middle-infrared EOS-MODIS data over land surfaces: Background, operational algorithm and validation. Journal of Geophysical Research: Atmospheres (1984–2012), 102(D14), 17131–17141.
- Wania, A., Kemper, T., Tiede, D., & Zeil, P. (2014). Mapping recent built-up area changes in the city of Harare with high resolution satellite imagery. Applied Geography, 46, 35–44. doi:10.1016/j.apgeog.2013.10.005
- Weng, Q. (2012). Remote sensing of impervious surfaces in the urban areas: Requirements, methods, and trends. Remote Sensing of Environment, 117(0), 34–49. doi:10.1016/j.rse.2011.02.030
- Wilkinson, G. G. (2005). Results and implications of a study of fifteen years of satellite image classification experiments. IEEE Transactions on Geoscience and Remote Sensing, 43, 433–440. doi:10.1109/TGRS.2004.837325
- Xian, G., Homer, C., Dewitz, J., Fry, J., Hossain, N., & Wickham, J. (2011). Change of impervious surface area between 2001 and 2006 in the conterminous United States. Photogrammetric Engineering and Remote Sensing, 77(8), 758–762.
- Yeboah, I. E. A. (2000). Structural adjustment and emerging urban form in Accra, Ghana. Africa Today, 47(2), 61–89. doi:10.1353/at.2000.0058
- Yeboah, I. E. A. (2003). Demographic and housing aspects of structural adjustment and emerging urban form in Accra, Ghana. Africa Today, 50(1), 107–119. doi:10.1353/at.2003.0070