
ABSTRACT
Laws and bylaws are regularly challenged for their effectiveness in containing urbanisation sprawl and, conversely, for the constraints they put on development projects. From a French case study, we used survival analysis to disentangle a complex mix of influences on the distribution of residential construction over a 42-year observation period at plot scale when almost everything changes simultaneously. We found that integrated laws and bylaws can slow down coastal urbanisation but do not stop it. Although land planning is becoming more effective, it still provides ample opportunity for residential development because other factors, like distance to existing infrastructure, exert a far stronger influence than the protection of coastal areas. Therefore, this article contributes to filling a knowledge gap about the founding role of public policies on land use dynamics.
Introduction
In developed countries, new residential development is related to pull factors like upward welfare, car dependency, preference for individual housing, tourism and local growth (Ewing, Citation1994).
However, without regulation, market forces and household preferences control suburbanisation processes and non-interventionism leads to various types of adverse impacts (Couch, Leontidou, & Petschel-Held, Citation2007; Ewing, Citation1994): shrinkage and fragmentation of natural and agricultural environments, pollution, landscape standardisation, functional (energy demand, congestion etc.) and societal issues (spatial segregation). These issues are exacerbated in coastal areas due to seasonal variations in the population, higher bid rent on shore land and sea views (Crawford, Citation2007) or increasing exposure to erosion and flood in the context of sea level rise (Cooper & Lemckert, Citation2012; Hunt & Watkiss, Citation2011). Furthermore, non-interventionist policies have led to privatisation of large portions of the coast by housing properties, which jeopardises subsequent land use planning, intervention or mitigation for problem-solving (Paula, Dias, Ferreira, & Morais, Citation2013; Romano & Zullo, Citation2014).
These impacts, current or anticipated, have convinced some European countries (Bordereaux, Citation2014; Gibson, Citation1999), the United States (Christie, Citation2013; Norton, Citation2005) and Australia (Gurran, Blakely, & Squires, Citation2007) to enact laws to control coastal urbanisation (Cicin-Sain & Knecht, Citation1998; Deboudt, Dauvin, & Lozachmeur, Citation2008). However, these policies are often accused of favouring urban development more than nature conservation (Geniaux, Napoléone, & Leroux, 2015; Norton, Citation2005) and addressing sectorial and local needs (e.g. risk mitigation, sanitation) at the expense of regional and comprehensive objectives (Norton, Citation2005). The effectiveness of bylaws can be challenged for their weakness or for the low level of their implementation (Negro, Lopez-Gutiérrez, Esteban, & Matutano, Citation2014; Robin & Verger, Citation1996). Moreover, the enactment of laws often occurs after the coastal land has already been urbanised (Paula et al., Citation2013; Romano & Zullo, Citation2014) and the juxtaposition of laws and jurisdictions can lead to a marked dissociation between objectives and real outcomes (Bordereaux, Citation2014).
Finally, the simultaneous and uncoordinated implementation of specific bylaws can yield unexpected (if not unwanted) impacts on real estate markets (Dachary-Bernard, Gaschet, Lyser, Pouyanne, & Virol, Citation2011; Geniaux, Ay, & Napoléone, Citation2011; Irwin & Bockstael, Citation2007) leading to counterproductive urbanisation trends. For example, rural communities close to urban centres can attempt to adopt less stringent land use policies to attract a new population, eventually fuelling urban sprawl (Munroe, Croissant, & York, Citation2005). When confined within administrative boundaries that do not adequately mimic the urban or metropolitan agglomeration, stringent environmental or land use zoning can lead to a ‘vote with our feet’ rebound, which benefits urbanisation at the outskirts and boundary spillover (Bimonte & Stabile, Citation2015; Geniaux et al., Citation2011).
This article focuses on coastal residential development in France where regulations (laws and bylaws) have been in force for decades and are regularly challenged for their effectiveness by politicians and in the press (Eymery, Citation2014). This led us to ask two research questions: (1) Are regulations effective in containing urban sprawl in coastal areas and protecting agricultural and natural land uses? (2) Conversely, are these regulations putting excessive constraints on development projects supported by local authorities and planners?
Based on a case study in a part of the French Atlantic coast (Pays de Brest in Brittany), this article uses a regression modelling of ‘time to events’ approach to assess the interaction impacts of coastal protection laws and planning bylaws (seen as treatment events) on the propensity of non-developed land plots to be built on before and after they are subject to such regulations. Whereas regulations are seldom made explicit in land use change models (An, Brown, Nassauer, & Low, Citation2011), we developed a statistical model to consider jointly the spatiotemporal evolution of residential land use growth, conservation laws and urban planning bylaws (including coastal protection) and other influence factors like accessibility, costs and demand for housing.
Management and conservation of coastal areas in France
After 1945, the management of coastal areas in France can be divided into three main periods: post-war redevelopment (up to the early seventies), emergence of environmental concerns (up to the early nineties) and land use planning integration (up to the present).
Before the 1970s, France was carrying out post-war reconstruction and was simultaneously willing to modernise its economy. The littoral areas received huge investments to develop large industrial, transport (port) and leisure (tourism) installations (Zaninetti, Citation2006). At the same time, due to a sustained demographic growth and increase in household income, single-family detached housing grew almost anarchically around villages and existing settlements (Renard, Citation1984). At the end of the period, housing development has been better structured within subdivisions developed by real-estate developers, but at the cost of lower landscape diversity (Zaninetti, Citation2006).
The growing environmental awareness of the seventies has led to the creation of nature conservation reserves and parks (Deboudt et al., Citation2008). Among such initiatives was the creation of the Conservatoire du littoral, a public administration in charge of land control of the coastal zone for nature conservation and prevention of land use change. At the same time, urban planning regulation has started within the frame of LUP (land-use plans) and UDP (urban development plans) set up after the national land use law (LUL), enacted in 1967 (Renard, Citation1984). The other main event of this period was the adoption of the Loi littoral (Coastal Law [CL]) of 1986, intended to preserve agricultural and ecological corridors and to provide buffer zones against coastal hazards. The control of urbanisation by the CL involves several principles (Bordereaux, Citation2014): (1) building is restricted in the 100-m coastal strip; (2) new extensions of urbanisation should be close (less than 200 m) to existing settlements; (3) non-urbanised corridors must be preserved between settlements and favour off-the-coast developments.
Finally, at the turn of the century, a comprehensive approach to urban and regional planning was developed with the ‘Solidarity and Urban Renewal [SUR]’ law enacted in 2000. Complemented by intersectoral policies, this was thought to have a positive impact on the management of coastal zones (Deboudt et al., Citation2008). New urbanism tools emerged like the Schéma de cohérence territoriale for master regional planning and local urbanism schemas (LUSs) at the scale of municipalities, gradually replacing the previous LUP and UDP. These new documents describe an overall planning process based on sustainable development (Pumain, Citation2004) and should be compliant with the CL principles.
However, the text of the CL is deliberately vague to enable its adaptation to the diversity of coastal landscapes in France, from the Mediterranean Sea to the Atlantic Ocean and the English Channel (Bordereaux, Citation2014). To remain effective, its principles should be integrated into bylaws as well as sectorial strategies for urbanisation, the environment, economic development etc. However, its implementation is complicated by the accumulation of regulatory instruments with conflicting goals, leading to major problems in the formulation of decision procedures (Bordereaux, Citation2014). In addition, left to the jurisdiction of municipal authorities, the regulation of coastal areas appears fragmented while weaknesses in real-estate policies have led to a lack of control of land-use evolution (Dachary-Bernard et al., Citation2011; DATAR, Citation2004).
Therefore, the assessment of the impacts of the CL is resulting in contradictory diagnoses. For instance, DIACT (Citation2007) concluded that the CL was effective in slowing down the consumption of natural areas while allowing for the economic development of coastal regions, due to its innovative principles while Faréniaux & Verlhac (Citation2008) considered that the continuous demographic pressure put on coastal areas during recent decades was detrimental to the development of planning policies in line with both urbanisation issues and nature conservation.
This research is a first step to address questions like: is urban planning more effective with respect to other policy instruments? (e.g. Bimonte & Stabile, Citation2015) and to which extent is urban planning affected by economic and social variables (i.e. growth, demography, developers’ lobby)?
Modelling the impact of regulation on the evolution of urbanisation
To assess the effectiveness of the CL, the joint evolution of urbanisation trends and its influence factors need to be analysed, considering the pace of the enactment of planning bylaws in coastal municipalities. Apart from the literature studying the law (Daligaux, Citation2003; Eymery, Citation2014), studies about the effectiveness of legislation in controlling urbanisation and land-use evolution belong to land change sciences (Muller & Munroe, Citation2014; Turner, Lambin, & Reenberg, Citation2007). They rely on statistical modelling approaches to integrate the regulation status and control influence factors of urbanisation as reported in the literature (An et al., Citation2011; Carrion-Flores & Irwin, Citation2004; Geniaux et al., Citation2011).
As regulation and these factors evolve, they change the conditions that promote (or not) urbanisation over time. Changes in regulation are made to compensate or put right the unwanted impacts of other influence factors (e.g. real-estate markets) with the objective of enhancing (or discouraging) residential development. However, analysing the impact of regulation on urbanisation leads to several methodological challenges (An & Brown, Citation2008).
From a spatial point of view, the territory should be discretised into spatial units with boundaries appropriate for modelling the ongoing processes (e.g. plots of land, municipalities) at a detailed scale where data are available. These spatial units could evolve in both their boundaries (e.g. plot subdivision, amalgamation of municipalities) and their attributes (e.g. land value, ownership) which complicates the management of evolving hierarchical spatial structures within the standard database framework needed for cross-sectional and longitudinal statistical analysis.
From a temporal point of view, changes can occur at any moment and have either an instantaneous impact (e.g. an event – plot built on) or a long-term influence over a period (e.g. change in regulation – subject to LUP) (Haase & Nuissi, Citation2010). Time resolution should be appropriate to model correctly the ongoing processes, their sequence and their combination to identify potential causes and consequences. These changes are themselves dynamic and could occur for any of the attributes in the model (e.g. land prices evolution). Moreover, attributes interact and can define endogenous evolution systems (e.g. change in accessibility leading to price evolution), which should be handled appropriately to conform to assumptions of statistical methods. Land planning regulation is a good example of endogeneity as it can influence future urbanisation while aimed at solving an urbanisation issue identified in the past.
The empirical analysis of such complexity requires longitudinal and cross-sectional databases and analytical procedures that reproduce and deal with land-use evolution processes at appropriate spatial and temporal scales.
Methodology
This section describes the study area, the data used and the methodology developed to model the impact of the CL and planning regulation instruments (UDP, LUP and LUS) in Pays de Brest. Le Berre, Maulpoix, Thériault and Gourmelon (Citation2016) reported on a previous experiment about this territory using five successive cross-sectional logistic models to analyse changes in construction levels over a 40-year period (1968–2008) in this same region.
Methodological issues
As stated by Bell and Irwin (Citation2002) and Carruthers, Hepp, Knaap and Renner (Citation2012), land plot analysis is appropriate because it is the elementary unit both for land planning, and for households’ projects. Thanks to the computerisation of the cadastre in France, this level of detail was available for this research.
Previous findings (Le Berre et al., Citation2016) showed that proximity to the sea shore was attractive for housing construction but that the attraction power in the first strip of 100 m from the sea significantly diminished after 1990 compared to the situation before 1982. As it is a requirement of the CL enacted in 1986, that supports the hypothesis that it was partly responsible for this evolution because the odds ratios of residential development simultaneously increased in the next strip (100–200 m) after 1990. These findings are in line with the French literature on coastal urbanisation (Pumain, Citation2004; Zaninetti, Citation2006) and land-use regulation (Bordereaux, Citation2014; Deboudt et al., Citation2008). However, such cross-sectional models computed using five periods (1968–1974, 1975–1982, 1983–1990, 1991–1999, 2000–2008) cannot be conclusive because they do not provide adequate temporal granularity, are adjusted separately and lack an explicit specification of the CL and planning regulation statuses at the municipality and plot level to contrast plots with and without treatment (CL and/or planning regulation). The development of a longitudinal study was suggested for further analysis and led to this article.
Specification of a longitudinal model is not straightforward because (1) several attributes and planning statuses (measured values) of plots potentially change over time; (2) due to the length of the study period, most of the parameters (coefficients) linked to potential influence factors related to land-use change are significantly different from one period to another (Le Berre et al., Citation2016), meaning that the proportional hazard (PH) assumption is in jeopardy; (3) a logistic modelling approach is clearly not appropriate because the effect of a regulation could be delayed in time, meaning that a survival framework is preferable; (4) the survival (as non-developed) of any plot at risk of construction depends on events (CL, UDP, LUP, LUS) that successively modify its regulation status (time at risk is not equivalent to treatment duration); (5) available plots may become no longer available after some protection event occurs (e.g. purchase by the Conservatoire du littoral), meaning that right censoring (Hosmer & Lemeshow, Citation1999) is needed to enable them to contribute to the survival assessment as they were at risk.
Study area and database structure
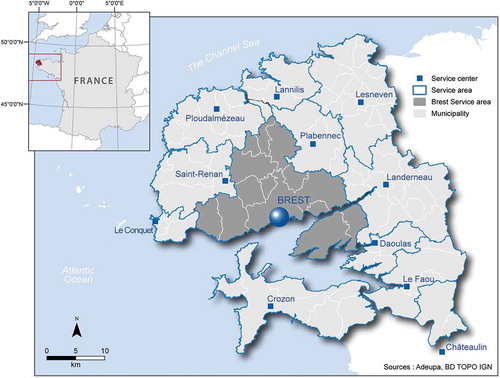
Pays de Brest is a coastal region (about 400,000 inhabitants; 89 municipalities) organised around a medium-size city (Brest) with 200,000 inhabitants. Located in Northwest France at the tip of Brittany, this metropolitan area (delimited by the labour market) includes suburban outskirts consisting of several daily-commodities service areas (). The Atlantic Ocean and English Channel sea coasts are indented and close to 400 km long. The total area is about 170,000 ha of which 95,000 are devoted to agricultural land use.
Figure 1. Pays de Brest – Urban amenities and daily-commodities service areas.
The study period begins in 1968, immediately after the enactment of the LUL, and ends in 2009 based on the availability of data up to 2010. Since the city of Brest was mostly destroyed during WW2, it was subject to a high level of reconstruction up to the mid-1960s, precluding analysis before the LUL. In France, the 1960s was characterised by the emergence of suburbanisation and urban sprawl (Robin & Verger, Citation1996) that are still ongoing. While located at the periphery of the mainland, Pays de Brest is affected by trends occurring in all the Atlantic coastal areas, which show rapid and steady residential development.
The database was originally developed by Le Berre et al. (Citation2016) following a multistage procedure. The cadastre (consisting of 415,436 land plots) provides the elementary spatial units (polygons) to record the evolution of both land use and related attributes. Statuses and events are set on a yearly basis from 1968 to 2009 (inclusive). All plots already built on in 1967 are excluded from the statistical analyses (not at risk of development) but kept in the GIS (geographical information system) database to generate spatial indicators (e.g. proximity to urbanised areas). For each plot built on between 1968 and 2009, the year of construction of single-family housing comes from the attributive part of the cadastre. Each plot is described by other attributes (e.g. area, distance to the sea). Some of these attributes are valid for the entire period (e.g. distance to the coast), while others are set on a yearly basis (e.g. distance to the nearest urbanised areas) using either linear interpolation from census data (1968, 1975, 1982, 1989, 1999, 2008) or spatial-temporal analysis in the GIS (e.g. travel time to employment centres).
The local environment of each plot is characterised by attributes known in the literature to exert an effect on the likelihood of residential development (Can, Citation1992; Des Rosiers, Thériault, Kestens, & Villeneuve, Citation2007). They are (1) Euclidean distance to the nearest plot already built on in previous years (set on a yearly basis in the GIS); (2) road distance to the nearest school (set on a yearly basis using Network Analyst in ArcGIS); (3) car travel time to Brest CBD to measure access to the job market (Network Analyst); (4) car travel time to the nearest second- and third-order urban centre including access to alternative service points and job opportunities (Network Analyst); (5) plot size as reported in the cadastre (fixed in time); (6) proportion of second homes in the municipality the previous year, which could offer an alternative to construction (yearly interpolation of figures reported in six censuses); (7) proportion of vacant houses in the municipality the previous year (yearly interpolation of 6 censuses) and (8) migration balance of the municipality during the previous year as an indicator of incoming demand (yearly interpolation of six censuses). Road distances to school and car travel time to urban centres were computed using a topological and oriented road network (built from IGN national topographic maps) with a free flow assumption, maximum allowed speed and penalties at crossings. This is legitimate as the region is remote and does not carry inter-regional traffic, meaning less road congestion most of the time.
For this article, we modelled the survival of suitable plots of land as becoming at risk of being developed for housing in 1968. Undeveloped plots in 1967 were selected further by excluding restrictive land use like cemeteries, military land, airports, sea ports, quarries, railroad infrastructure, forests, nature reserves, industrial hazard protection zones etc. Finally, 328,319 plots were deemed suitable for housing in 1968, with 44,668 of them located at less than 300 m from the shore. Further details of the data structuring are available in Le Berre et al. (Citation2016).
However, plots suitable in 1967 could later change their status because of events. The first set of events is their development for housing, the subject of this study that we modelled as a failure. Other types of events could also occur, meaning that right censoring was needed because some plots became unavailable at some point in time. Such events (mostly environment protection actions) were dated for each plot. They were related to the protection of biotopes, plots purchased by the Conservatoire du littoral, protected natural areas, water source protection buffers, national reserves, heritage sites etc. The number of suitable plots gradually fell to 237,996 in 2010. As very small and very large plots are unlikely to be developed and we did not have appropriate data about plot subdivision and consolidation over time, we restricted this study to plots between 200 and 2000 m2 (163,247 suitable plots in 1967), leading to a sample of 61,528 house-building events and 10,449 right-censored plots from 1968 to 2008 and 91,270 plots still available in 2009.
The wide format database (one row per plot) was converted into the long format (one row per plot-year combination) to allow for longitudinal analysis (Cleves, Gould, & Gutierrez, Citation2004). This yielded a dataset with 5,221,429 plot-year rows. To study the effect of laws and bylaws, each row was characterised by planning events and statuses where applicable. Planning events occurred at the municipal level at various dates and were assigned to the appropriate plot-year rows. When they occur, events change the planning status of each plot in the municipality for a given period. This status was noted for each plot-year row until the next event occurred. For the overall study period, most of the plots changed their planning status leading to several types of planning processes to be compared. Appendix 1 reports the distribution of plot-years, construction events and overall build rates (failures during the period 1968–2009) by regulation status (treatments) interacted with distance to the sea shore before and after the CL was enacted.
shows the evolution of the build rate (new houses/100,000 suitable plots) from 1968 to 2009. It reveals the impact of economic cycles (e.g. at the beginning of the 1990s). The spatial scale (plots) and temporal granularity (years) of the following analyses depend on data availability and this research largely benefited from the huge digitising effort and public dissemination policies following the European Inspire initiative.
Figure 2. Yearly build rates in Pays de Brest between 1968 and 2009 (new houses/100,000 suitable plots).
Survival assessment
provides an example of the evolution of statuses for the 8013 plots located in the first strip of 100 m along the sea coast. It displays the gradual implementation of bylaws (UDP, LUP, LUS), residential construction (build events) and right censoring (protected) at the plot level on a yearly basis. Such a graph could be constructed for any distance from the sea. However, it provides only a descriptive picture of events and statuses and does not inform about their mutual relationships because bylaw deployment (changes in treatment) compete with build events (failures) to change risk levels and the remaining number of suitable plots simultaneously.
Figure 3. Evolution of plots at 0–100 m from the sea shore according to the type of planning bylaw in the municipality.The area of selected plots ranges from 200 to 2000 m2. Smaller and larger plots are excluded from the analysis. Bylaws: UDP: urban development plan; LUP: land-use plan; LUS: local urbanism schema. None: no bylaw; built: plots used for housing; protected: unavailable plots (e.g. owned by the Conservatoire du littoral, nature reserve).
An efficient way to handle the cumulative joint evolution of built on and suitable plots is based on the survivor function :
where is the failure-time function (cumulative distribution of build events) and
is the probability that the build event (at time
) occurs after time
(years). Its density function can be used to estimate the hazard function
. The hazard rate can vary from zero (no risk of development) to infinity (certainty of construction at or before that time). This leads to the cumulative hazard function
:
In the above integral, time zero is set when the plot becomes at risk. In our case, this is 1968 but it could also be the date of any event like the enactment of the CL or the moment a plot is subject to a planning bylaw.
Kaplan and Meier (Citation1958) developed an estimator of the survivor function, which incorporates information from all available data, including censored cases, by considering survival at any point in time as steps integrating the observed and censored times (Hosmer & Lemeshow, Citation1999). shows an example of the Kaplan–Meier survivor function (equivalent to ) for suitable plots in Pays de Brest from 1968 to 2009 by distance to the sea shore. It is noteworthy that the cumulative residential development function can be obtained with
.
Figure 4. Kaplan–Meier survivor function of building land in Pays de Brest from 1968 to 2009 by distance to the sea shore (plots between 200 and 2000 m2).
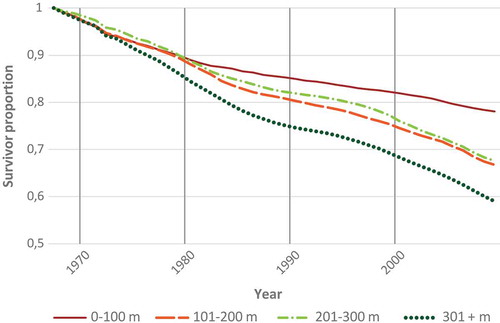
synthesises the cumulative evolution of residential construction in successive 100-m strips along the coast. It illustrates a slight but persistent decrease in built-house events in the first 100-m strip after 1980 as well as a faster decline of available plots at more than 300 m until the nineties and a slower construction rate afterwards. The intermediate strips (101–200 and 201–300 m) show an intermediate pace of development. Although it depicts the overall evolution, the Kaplan–Meier survivor function does not relate the observed rhythms of build events to planning statuses while controlling for influence factors, leading us to introduce the survival analysis.
Survival analysis
Survival analysis models ‘time to events’ (hazard and survival) assessing the impact of treatments with control of influence factors. Specifications can be parametric (theoretical distribution of failure is known) or semi-parametric like the Cox PH model (Box-Steffensmeier & Jones, Citation2004; Klein & Moeschberger, Citation2003). For this research, we used the single spell Cox PH model because we did not have any framework to choose from the theoretical hazard distributions and our data could not handle the redevelopment of existing housing plots.
In the Cox PH model, the ordered duration times are parametrised in terms of a set of covariates (plot attributes):
where is the proportional hazard of plot j being built on at time t,
is the baseline hazard of any plot to be built on at time t,
is a vector of attributes of plot j,
is a vector of coefficients for attributes and k is the length of vectors. Willing to distinguish between law and bylaw impacts and to control by other attributes and/or fixed effects based on service areas, we developed a two-step modelling approach (1) to assess the combined impact of laws and bylaws on the development of the first three 100-m strips along the coast (Equation 4 – base model) where development at more than 300 m from the shoreline is the reference and (2) to add the impact of covariates and fixed effects for each service area (Equation 5 – model with controls).
where is a vector of indicators (dummies) for the interaction between
law–bylaw statuses (seen as a set of i treatments, e.g. the UDP before the CL) and
is a scalar dummy for the distance strip to the shoreline (e.g. 0–100 m) pertaining to plot j,
is a vector of dummy indicators to identify the local service area of plot j and
is a vector of parameters for the
service areas () taking Brest (the main submarket) as the reference. Finally,
and
are vectors of parameters to estimate.
Such specification implies a PH assumption that is not met in our data because the influence factors not only change over time (time-varying covariates) but coefficients vary as well. Based on failure of PH tests (Cleves et al., Citation2004) for the entire 42-year period, Equations 4 and 5 are modified into Equations 6 and 7 to include variations in parameters over periods of time (1968–1974, 1975–1982, 1983–1990, 1991–1999 and 2000–2009). PH tests were carried out to ensure that overall departures from the PH assumption were not significant.
where is a dummy for the period including year t while
and
are period-specific parameters. Continuous variables were transformed into order indicators, combining them to achieve non-significant link tests (Cleves et al., Citation2004). Each attribute (set of indicators) was handled individually to test the PH assumption within periods and the efficiency of indicators with the link test. The same procedure was applied to the local service areas, which validated overall the appropriateness of the
periods with very few exceptions, which are reported and discussed later.
The Cox PH models use a control group (reference to plots located at more than 300 m from the sea) to assess the marginal relationship of bylaws (treatments) with concomitant changes in hazard ratios either (1) without control of covariates (base model as in Equation 6) or (2) with control of both time-varying covariates and fixed effects of location in 12 local service areas (model with time-varying covariates and parameters as in Equation 7). Indicators in Equation 7 had their parameters adjusted by period. All models were computed using Stata version 14.
Results
Evolution of residential development from 1968 to 2009
Development cycles shown in are in line with those observed in France. Economic crises (oil shocks of 1973 and 1979 and crises of 1990, 2000 and 2008) impacted residential development with a small delay caused by the duration of construction. These effects were strong for Pays de Brest whose economy was concentrated in naval repair and national defence. Resumption beginning in the nineties is related to the economic restructuring to trade, logistics and R&D, due to National and European territorial cohesion policies (Le Roy, Citation2009).
Appendix 1 distinguishes observation periods based on the main economic crises (1979 and 2000), the enactment of laws (CL in 1986 and SUR in 2000) and the application of local planning bylaws (UDP, LUP and LUS) in municipalities, considering classes of distance of suitable plots from the sea (0–100, 101–200, 201–300 and 301+ metres). Build events are compared to time at risk (plot-years) to compute a build rate (houses built per 100,000 years of observation). Considering cases with at least 1000 years, large differences (build rates from 0 to 2600) are found in this raw computation. Overall demand for new housing (build rates) fell by about 18% after the CL but decreased much more in the first strip of 100 m along the sea shore (by about 50%, from 825 to 420) suggesting a potential impact of the CL. However, it is also noteworthy that the impact of the LUP before the CL was also far lower in the strip of 0–100 m (417) than elsewhere and that the minimal build rate (330) was observed from 1986–2000 in areas governed by both the CL and LUP. Nevertheless, the construction rhythm was at its lowest during that period, preventing a definite conclusion. The Cox model handles such complexity and better understands the marginal effects of context on these variations.
provides an example of the gradual deployment of environmental conservation and the reinforcement of planning bylaws in the first strip along the coast. Each row presents the status of plots at the end of the year. Plots are deemed to have a failure when they are built on (and removed from the pool of suitable plots thereafter). Plots should be right-censored after they are protected. Finally, regulation statuses evolve as time goes by. Thus, there are two sets of competing mechanisms that protect the shoreline from urbanisation: protection initiatives (e.g. purchased by the Conservatoire du littoral) and planning laws and bylaws. To remain valid, plots should remain in the analysis before they are protected (they were at risk) but should be excluded afterwards to avoid model corruption.
Evolution of residential development close to the sea shore (survival curve)
shows the Kaplan–Meier survivor function of available suitable plots, areas from 200 to 2000 m2, by distance to the sea shore. Up to 1975, survival rates were almost equal between strips. From 1975, housing development was greatest at more than 300 m with a slower pace after 1986. The first strip (<100 m) showed the weakest development rate after 1982 while intermediate strips depicted close in-between trends.
distinguishes the evolution of suitable plots when they are subject to the LUP or LUS. Survivor functions begin in 1978 as this is the first year these bylaws appeared in Pays de Brest. Therefore, cumulative survival curves cannot be compared in value (survivor proportion), but their slope can. The overall picture is given in with plots at less than 100 m being developed less frequently than inland strips. The peak in development is at more than 300 m, but the strip of 101–200 m is second. goes further to present the survivor trends of plots located in shore municipalities where the LUP or LUS applied after the CL. It clearly shows that the first strip has a failure rate (1 − survivor) roughly equal to half that of the other distances, in line with the results of Appendix 1.
Figure 5. Kaplan–Meier survivor function of building land in municipalities with LUP or LUS from 1979 to 2009 by distance to the sea shore (plots between 200 and 2000 m2).
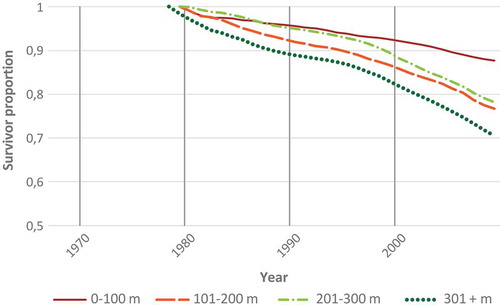
Figure 6. Kaplan–Meier survivor function of building land in coastal municipalities with LUP or LUS from 1986 to 2009 by distance to the sea shore (plots between 200 and 2000 m2).
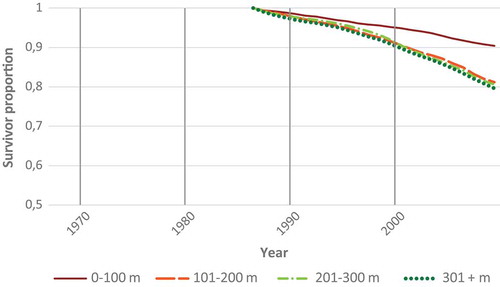
Survival curves confirm the likeliness of an effect at dates compatible with the enactment of the CL in places subject to the LUP or LUS bylaws. However, while a relationship is confirmed in the time line or in space, these curves do not explicitly assess each combination of law and bylaws with control over other influence factors and housing submarkets. This is the purpose of the next section.
Impact of laws and bylaws (Cox PH models)
Appendix 2 presents the adjustment statistics of the model specifications in Equation 6 (base model of the CL and planning bylaws – as treatments) and Equation 7 (model with time-varying covariates). (a) shows the results from Equation 6 (base model of the CL and planning bylaws). (b) and combine to present those of Equation 7 (model with time-varying covariates). To enable comparison, all suitable plots (163,247) were deemed at risk in 1968 based on their status at the end of 1967. Exit from the analysis occurred when each plot was either protected (right censoring without failure), built on (failure) or the year 2009 ended (end of observation period). This yielded a total observation duration of more than 5.2 million plot-years. From 1968 to 2009, 61,528 suitable plots were developed for housing (failures).
Table 1. Cox proportional hazard models of the impact of the Coastal Law and bylaws on the protection of the sea shore.
While differing in the number of parameters (23 vs. 203 degrees of freedom), both models are well specified (based on the link test), significant (likelihood ratio test with p < 0.0001) and the overall PH tests are not significant meaning compliance with the assumption. Both Akaike’s and Bayesian information criteria confirm the better adjustment of Equation 7 with parsimony (Appendix 2). During model computation, influence factors were added one by one (in the order they appear in ) looking at information criteria to assess improvement. Then, submarkets were added to obtain the full specification.
Table 2. Impact of the time-varying covariates and parameters between 1968 and 2009 – Equation 7.
All hazard ratios, except one, reported in the base model ((a)) are lower than 1, the reference that applies to suitable plots located at more than 300 m from the sea shore. The model was adjusted with four distance categories (1: 0–100; 2: 101–200; 3: 201–300; 4: >300 m, the reference) in interaction with eight treatments (period + law–bylaw setting).
Lower hazard ratios imply that survival is higher (failure is lower). The comparison of part (a) and (b) values in identifies important variations in both parameters and significance, which confirms the interest of the controls displayed in . One very interesting difference between the results from Equations 6 and 7 is the appearance of several hazard ratios above 1, meaning that those combinations of treatments and distance strips close to the sea have a propensity to develop faster than land at more than 300 m. Moreover, the number of significant parameters is lower meaning that the significance of the observed effect is related to controls or submarkets. Thus, (b) should be retained to discuss the significance of trends shown in survival functions.
Most of the time-varying coefficients for the control variables included in the model () are highly significant and likely reliable because PH tests are not significant for all variables, including daily-commodities service areas, as well as not being significant at the parameter level with only four exceptions during the 2000–2009 period (plot size and migration balance). Coefficients are in line with theoretical expectations and consistent with the literature review. As they are not the subject of this study, they will not be discussed in detail, except for Euclidean distances to the nearest previously built area (reference more than 300 m) because continuous urbanisation is an expected outcome of planning bylaws. Marked variations in hazard ratios by daily-commodities areas from one period to another is another important feature that indicates spatial trends in housing demand as the agglomeration develops. Hazard ratios above 1 indicate development faster than in Brest (the reference) and lower value areas represent depressed markets.
The coefficients in (b) enable the comparison of treatments in distance strips close to the sea with development of housing at more than 300 m. If treatments are effective in controlling urbanisation on the coast, we would expect residential development to be lower close to the sea. However, to have a fair assessment, we need to consider simultaneously the main historical trends and compare coefficients between strips and treatments assessing the significance of the observed differences. For example, it is not sufficient to note that the coefficient of the first strip (0.952) is lower than that of the second (1.242) and conclude that a significant push away from the shore is the effect of the UDP before the CL. Even with controls of other effects, this result could happen by chance and Wald tests are needed to draw a conclusion. presents the results of the Wald tests between the strip distances to the sea considering treatments at various periods. shows the Wald tests between pairs of treatments in the first strip to test the effectiveness of the CL and/or planning bylaws in protecting the coast. The following discussion is based on these tables to answer the research questions: (1) Are regulations effective in containing urban sprawl in coastal areas and protecting agricultural and natural land uses? (2) Conversely, are these regulations putting excessive constraints on development projects supported by local authorities and planners?
Table 3. Wald tests of equality between hazard ratios of distance strips to the sea shore in the time-varying covariate model.
Table 4. Wald tests of equality between hazard ratios of treatments at less than 100 m from the sea shore.
Discussion
Are laws and bylaws decreasing residential development close to the sea shore?
As shown in (b) and , hazard ratios (build house or failure propensity) before 1980 were significantly higher in the first 100-m strip close to the sea than in any other location and there was a significant decrease at more than 300 m. This trend relates to the strong attractiveness of building houses closer to the sea shore when regulations are not applied (Robin & Verger, Citation1996). However, the above trend significantly reverted in the first strip after 1980 and before the CL was adopted for plots without planning regulation, while municipalities ruled by the UDP showed no difference between strips except for the 101–200-m strip, which was significantly higher than the 201–300-m strip. This is consistent with the UDP objective to speed up reconstruction after the war considering previous settlement locations. The largest drop in the hazard ratio before the CL occurred in the first strip for municipalities ruled by the LUP. This leads us to infer that the principles behind the CL were gradually defined during the decade preceding it and it was mostly a national-scale codification of existing practices at the local scale. Considering that the CL is not intended to prevent any construction, but aims to control it for the protection of coastal areas, we conclude that as a stand alone, CL probably fails to achieve its goals; but if it is integrated or combined with planning bylaws, the effect is highly significant, but not definite.
The enactment of the CL did not have the dramatic impact one might expect
Up to 2000, there was no significant effect in coastal municipalities without planning regulations and hazard ratios of municipalities with the LUP after the CL (0.647) did not differ from those before it. The non-significant trend was even reversed. Looking at the results in the last period (after 2000), there was still no difference between municipalities ruled by either the LUP or LUS and former hazard ratios for similar cases. As shown in , early compliance with coast conservation principles was significantly higher in municipalities ruled by the LUP than in other places and this held from 1978 to 2009, meaning that planning bylaws could have had more impact at the local scale than national laws that depend on local regulation to deliver results. Conversely, municipalities ruled by the LUP or LUS outperformed those who were not in their effectiveness in protecting the first strip either before or after the CL. However, this was not a total ban on residential construction in the first strip and hazard ratios at half the value of inland locations can be judged as moderately effective.
Is land planning becoming more effective/restrictive?
focuses on the first strip of 100 m along the coast; similar tests were carried out for the 101–200 and 201–300-m strips where variations in hazard ratios with treatments were weaker. However, some significant exceptions appeared for plots located in the 101–300-m strip in municipalities without planning bylaws from 1980 to 1985 (higher hazard) and in the 201–300-m strip in municipalities ruled by the LUP from 1978 to 1985. No significant difference emerged after the CL except those mentioned earlier for the first strip.
Does this mean that the CL was almost ineffective? That conclusion would probably be unfair. First, notions integrated in the CL were developed during the 1970s (Prieur, Citation2005) including restrictions for construction at less than 100 m from the coast, urbanisation further inland and continuous extension of development perimeters close to existing settlements. It is thus normal to find them integrated in planning bylaws like the LUP. Second, in France, the gradual emergence of environmental concern about the coastal areas (Deboudt et al., Citation2008) during the late seventies and early eighties led to improved land management policies, as illustrated in by the rapid increase in protected plots that may partially hide the effect of the CL (Robin & Verger, Citation1996). It should also be noted that our model includes right censoring of plots purchased by the Conservatoire du littoral, which was about 23% of suitable plots in the first coastal strip. Therefore, when the CL is combined with appropriate planning bylaws and environmental laws and/or conservation initiatives, it adds rationality to the location choice of new settlements while planning bylaws are still necessary.
provides another insight as it displays the evolution of hazard ratios with the Euclidean distance of newly constructed plots from existing settlements. The reference is at locations at more than 300 m. Looking at plots very close to built areas (<100 m), three periods emerge: 1968–1974 when the hazard ratio was about 9.8, 1975–1999 (21–26) and 2000–2009 when it exceeded 50. Looking at the gradient from 0 to 300 m, there was a steep decline in hazard ratios, meaning that proximity to previous settlements matters. Proximity to infrastructure is expected to reduce the overall cost of new developments, but the fact that the difference increased over time leads us to hypothesise that better land-use planning could have a complementary effect.
These facts support the hypothesis of more stringent planning bylaws beginning in the eighties. Based on the highest hazard ratio above 50 (in 2000–2009, ) close to existing settlements, we expect that bylaws (LUS) implemented at the turn of the century could have strengthened the overall coherence of urbanisation, particularly in coastal areas (Eymery, Citation2014). However, the database did not provide sufficient number of plots to distinguish between the LUP and LUS, as the available cases were concentrated in a few municipalities.
Finally, the explanatory power of the survival model remains low, mainly because, irrespective of content, the enforcement of planning bylaws is the subject of negotiation between private promoters and municipal decision makers, both wanting to assure economic development. This prevents planning from reaching its maximum effectiveness because the optimum should include aspects of diverging private and community priorities (Bimonte & Stabile, Citation2015). Therefore, land planning is becoming increasingly effective but there is still ample opportunity for residential development, even in less suitable areas.
Benefits and limitations of the survival analysis
The survival analysis was efficient at disentangling a complex mix of influences on the distribution of residential construction over a longer observation period when almost everything changes simultaneously. This is an essential feature to compare the actual effects of laws and bylaws on the spatial distribution of new housing and thus assess their relative effectiveness in protecting the immediate sea shore and better continuity of urban developments.
But, due to data limitations, several influence factors were replaced by proxies. This is the case of the distance to Brest and second- and third-order activity centres to measure access to the job market, and of the fixed effects of local service areas to compensate for non-available land and housing prices during the study period. We assume that these service areas are good proxies of the housing sub-markets and control for spatial variations in the residential demand based on census data (second and vacant homes, migration balance).
In addition, we have no information on the housing development process itself. Is it operated by individuals (dispersed management) or contractors willing to consolidate in space to secure economies of scale? What is the effect of political orientations of local decision makers on their willingness to enact regulations and/or comply with national laws? What is the bargaining power of developers versus municipal authorities? What is the effect of the life cycle of land owners and speculation on land to sell/prices? What is the exact content of the planning bylaws? Are the same treatments poorly/highly similar between municipalities? Nevertheless, we argue that some of these questions should be kept out of a model that aims to measure their net effect on the planning–development relationship.
Finally, the model specification in this article assumes that the effect of a law and bylaw is constant within given periods (using dummies). Another specification could use time lags after a treatment has begun to assess gradual effects (using continuous functions). However, that would eventually lead to functional form specification issues as the effect of time could be non-linear. An alternative specification to the event-based model used in this article could be developed to test the overall effectiveness of laws and planning bylaws in controlling urban sprawl better. This would involve embedding Hägerstrand’s (Citation1967) spatial diffusion theory in the survival analysis framework.
Conclusion
Using a database built for a previous article (Le Berre et al., Citation2016) about urbanisation of the French Atlantic coast, we developed an original specification to model the impact of successive planning regulations on residential construction over a 42-year period using survival analysis. This specification models the explicit evolution of planning using events occurring at the municipal level to set statuses at the plot level. At the plot level, these statuses are assimilated to treatments while the model assesses the hazard ratios of failure (house built on the plot) after 1968, considering laws and bylaws (treatments) simultaneously, and location, social and economic factors known to have an impact on development. In France, a CL was enacted in 1986 to protect the sea shore and this article focuses on assessing its impact in Pays de Brest (Brittany).
The findings show that a period of non-interventionism (1968–1979) was immediately followed by a significant decrease in residential development in the first 100-m strip from the shoreline beginning in 1980, years before the CL was enacted. A former LUL (1967) seems to have had almost no immediate effect on reducing urbanisation in coastal areas. However, the rise of environmental concern at the end of the seventies led to a significant decrease in housing development in the first strip, especially in municipalities ruled by LUP. Overall, planning regulations (LUP and LUS) efficiently implemented the principles of the CL to halve the risk of residential development adjacent to the sea coast in Pays de Brest. Environmental conservation initiatives, based on the purchase of plots of land to convert into nature reserves, provided a complementary mechanism to protect coastal areas. The development of the survival model had to account for (using right censoring) this concomitant regulation process to avoid confusion with the effects of the CL and planning bylaws.
Thus, the answers to the research questions are: (1) when standing alone, the CL is probably not sufficient to slow down coastal urbanisation but when integrated or combined with appropriate planning bylaws, the effect is highly significant, but not definite; (2) land planning is becoming more effective but still allows ample opportunity for residential development, even in less suitable areas. However, other factors, like distance to existing infrastructure, exert a far stronger (economic-based) effect on improving urbanisation than the protection of coastal areas. Further analysis is needed to understand better the interaction effect between these two complementary goals of urban planning on their relative levels of achievement.
This article contributes to filling the knowledge gap reported by Dachary-Bernard et al. (Citation2011) about the founding role of public policies on land-use/value dynamics. Despite general scepticism fuelled by the multiplication of competing regulation policies (Bordereau, 2014; Norton, Citation2005), the approach we have developed can disentangle effects to assess the marginal impact of coastal planning regulations. To the best of our knowledge, survival modelling has seldom (if ever) been used to integrate successive planning bylaws in longitudinal land-use monitoring to assess their marginal impact (as a treatment) on residential development (or land-use change). The information studied in this article goes far beyond the French case and relates strongly to contemporary concerns about climate change, rising sea level (Cooper & Lemckert, Citation2012; Hunt & Watkiss, Citation2011) and ongoing coastal urbanisation (Bimonte & Stabile, Citation2015).
Acknowledgements
This work benefitted from a State subsidy managed by the Agence Nationale de la Recherche (ANR, National Agency for Research) within the framework of the ‘Investments for the Future’ programme, reference ANR-10-LABX-19-01. The authors would particularly like to thank Louis Dieumegarde of the Centre de Recherche en Aménagement et Développement (CRAD, Centre for Research on Planning and Development) at Laval University in Quebec for his contribution to the accessibility modelling (funding by FRQSC – ‘Accès à la Cité’ team). We would also like to thank the organisations that kindly agreed to provide the reference data sets used for our models: Brest Métropole Océane, ADEUPa, DDTM29 and the French Ministry of Education. Finally, we would like to thank our reviewers for helpful comments.
Disclosure statement
No potential conflict of interest was reported by the authors.
Additional information
Funding
References
- An, L., & Brown, D.G. (2008). Survival analysis in land change science: Integrating with GIScience to address temporal complexities. Annals of the Association of American Geographers, 98, 323–344. doi:10.1080/00045600701879045
- An, L., Brown, D.G., Nassauer, J.I., & Low, B. (2011). Variations in development of exurban residential landscapes: Timing, location, and driving forces. Journal of Land Use Science, 6, 13–32. doi:10.1080/1747423X.2010.500686
- Bell, K.P., & Irwin, E.G. (2002). Spatially explicit micro-level modelling of land use change at the rural–urban interface. Agricultural Economy, 27, 217–232. doi:10.1016/S0169-5150(02)00079-8
- Bimonte, S., & Stabile, A. (2015). Local taxation and urban development. Testing for the side-effects of the Italian property tax. Ecological Economics, 120, 100–107. doi:10.1016/j.ecolecon.2015.09.025
- Bordereaux, L. (2014). Seashore law: The core of French public maritime law. International Journal of Maritime and Coastal Law, 29, 402–414. doi:10.1163/15718085-12341312
- Box-Steffensmeier, J.M., & Jones, B.S. (2004). Event history modelling. A guide for social scientists. New York, NY: Cambridge University Press.
- Can, A. (1992). Specification and estimation of hedonic housing price models. Regional Sciences and Urban Economics, 22, 453–474. doi:10.1016/0166-0462(92)90039-4
- Carrion-Flores, C., & Irwin, E.G. (2004). Determinants of residential land-use conversion and sprawl at the rural-urban fringe. American Journal of Agricultural Economy, 86, 889–904. doi:10.1111/j.0002-9092.2004.00641.x
- Carruthers, J.I., Hepp, S., Knaap, G.-J., & Renner, R.N. (2012). The American way of land use: A spatial hazard analysis of changes through time. International Regional Science Review, 35, 267–302. doi:10.1177/0160017611401388
- Christie, S. (2013). Pushing the CZMA envelope: California: The first state to litigate the new federal law. Coastal Management, 41, 245–257. doi:10.1080/08920753.2013.784887
- Cicin-Sain, B., & Knecht, R.W. (1998). Integrated coastal and ocean management, concepts and practices. Washington D.C.: Island Press.
- Cleves, M.A., Gould, W.W., & Gutierrez, R.G. (2004). An introduction to survival analysis using stata. College Station, TX: Stata Press.
- Cooper, J.A.G., & Lemckert, C. (2012). Extreme sea-level rise and adaptation options for coastal resort cities: A qualitative assessment from the Gold Coast, Australia. Ocean Coastal Management, 64, 1–14. doi:10.1016/j.ocecoaman.2012.04.001
- Couch, C., Leontidou, L., & Petschel-Held, G. (2007). Urban sprawl in Europe: Landscapes, land-use change & policy, Real estate issues. Malden, MA: Blackwell-Oxford.
- Crawford, T.W. (2007). Where does the coast sprawl the most? Trajectories of residential development and sprawl in coastal North Carolina, 1971–2000. Landscape and Urban Planning, 83, 294–307. doi:10.1016/j.landurbplan.2007.05.004
- Dachary-Bernard, J., Gaschet, F., Lyser, S., Pouyanne, G., & Virol, S. (2011). L’impact de la littoralisation sur les marchés fonciers. Une approche comparative des côtes basque et charentaise. Économie Statistique, 444, 127–154. doi:10.3406/estat.2011.9647
- Daligaux, J. (2003). Urbanisation et environnement sur les littoraux : Une analyse spatiale. Rives Nord-Méditerranéennes, 15, 11–20. doi:10.4000/rives.12
- DATAR. (2004). Construire ensemble un développement équilibré du littoral. Paris: La Documentation française, DATAR. http://zonages.territoires.gouv.fr/sites/default/files/datar/datarrlittoral.pdf
- Deboudt, P., Dauvin, J.-C., & Lozachmeur, O. (2008). Recent developments in coastal zone management in France: The transition towards integrated coastal zone management (1973–2007). Ocean and Coastal Management, 51, 212–228. doi:10.1016/j.ocecoaman.2007.09.005
- Des Rosiers, F., Thériault, M., Kestens, Y., & Villeneuve, P. (2007). Landscaping attributes and property buyers’ profiles: Their joint effect on house prices. Housing Studies, 22(6), 945–964. doi:10.1080/02673030701608183
- DIACT. (2007). Bilan de la loi « Littoral » et des mesures en faveur du littoral. Paris: Ministère de l’Écologie, de l’Énergie, du Développement durable et de l’Aménagement du territoire - Secrétariat général à la mer. http://www.developpement-durable.gouv.fr/IMG/pdf/DGALN_Rapport_BLL__cle7d7512.pdf
- Ewing, R.H. (1994). Characteristics, causes, and effects of sprawl: A literature review. Environmental Urban Issues, 21, 1–15. doi:10.1007/978-0-387-73412-5_34
- Eymery, C. (2014). Du texte à la carte : Contribution de la géographie à la traduction spatiale de la “loi Littoral”. Application en Bretagne. Brest, France: Doctoral thesis in Geography, Université de Bretagne Occidentale. Retrieved from https://hal.archives-ouvertes.fr/tel-01114773
- Fareniaux, B, & Verlnac, E. (2008). Le dysfonctionnement des marchés du logement en zone touristique. Paris: Rapport pour le Conseil Général des Ponts et Chaussées (CGPC) 004983. http://www.ladocumentationfrancaise.fr/rapports-publics/084000193/
- Geniaux, G., Ay, J.-S., & Napoléone, C. (2011). A spatial hedonic approach on land use change anticipations. Journal of Regional Science, 51, 967–986. doi:10.1111/j.1467-9787.2011.00721.x
- Geniaux, G., Napoléone, C., & Leroux, B. (2015). Les effets prix de l’offre foncière. Revue d’Economie Régionale et Urbaine, 1, 273–320. doi:10.3917/reru.151.0273
- Gibson, J. (1999). Legal and regulatory bodies: Appropriateness to integrated coastal zone management. Lymington, UK: Final Report European Commission-DG XI D-2, MacAlister Elliott and Partners Ltd. http://ec.europa.eu/environment/iczm/pdf/thema_rp.pdf
- Gurran, N., Blakely, E.J., & Squires, C. (2007). Governance responses to rapid growth in environmentally sensitive areas of coastal Australia. Coastal Management, 35, 445–465. doi:10.1080/08920750701525776
- Haase, D., & Nuissi, H. (2010). Assessing the impact of land use change on transforming regions. Journal of Land Use Science, 5, 67–72. doi:10.1080/2F1747423X.2010.481074
- Hägerstrand, T. (1967). Innovation diffusion as a spatial process. Chicago: University of Chicago Press.
- Hosmer, D.W., & Lemeshow, S. (1999). Applied survival analysis. regression modeling of time to event data. New York, NY: Wiley.
- Hunt, A., & Watkiss, P. (2011). Climate change impacts and adaptation in cities: A review of the literature. Climate Change, 104, 13–49. doi:10.1007/s10584-010-9975-6
- Irwin, E.G., & Bockstael, N.E. (2007). The evolution of urban sprawl: Evidence of spatial heterogeneity and increasing land fragmentation. Proceedings of the National Academy of Science, 104, 20672–20677. doi:10.1073/pnas.0705527105
- Kaplan, E.L., & Meier, P. (1958). Nonparametric estimation from incomplete observations. Journal of the American Statistical Association, 53, 457–481. doi:10.2307/2281868
- Klein, J.P., & Moeschberger, M.L. (2003). Survival analysis. Techniques for censored and truncated data. New York, NY: Springer.
- Le Berre, I., Maulpoix, A., Thériault, M., & Gourmelon, F. (2016). A probabilistic model of residential urban development along the French Atlantic coast between 1968 and 2008. Land Use Policy, 50, 461–478. doi:10.1016/j.landusepol.2015.09.007
- Le Roy, N. (2009). Brest, de la ville militaire à la métropole occidentale de la Bretagne : Constructions politiques de territoires et productions identitaires. Brest, France: Doctoral thesis in Sociology, Université de Bretagne Occidentale.
- Muller, D., & Munroe, D.K. (2014). Current and future challenges in land use science. Journal of Land Use Science, 9(2), 133–142. doi:10.1080/1747423X.2014.883731
- Munroe, D.K., Croissant, C., & York, A.M. (2005). Land use policy and landscape fragmentation in an urbanizing region: Assessing the impact of zoning. Applied Geography, 25, 121–141. doi:10.1016/j.apgeog.2005.03.004
- Negro, V., Lopez-Gutiérrez, J.-S., Esteban, M.D., & Matutano, C. (2014). An analysis of recent changes in Spanish Coastal Law. Journal of Coastal Resources, Special Issue, 70, 448–453. doi:10.2112/SI70-076.1
- Norton, R.K. (2005). More and better local planning: State-mandated local planning in coastal North Carolina. Journal of the American Planning Association, 71, 55–71. doi:10.1080/01944360508976405
- Paula, D.P., Dias, J.M.A., Ferreira, O., & Morais, J.O. (2013). High-rise development of the sea-front at Fortaleza (Brazil): Perspectives on its valuation and consequences. Ocean Coastal Management, 77, 14–23. doi:10.1016/j.ocecoaman.2012.03.004
- Prieur, L. (2005). La loi Littoral. Paris: Voiron.
- Pumain, D. (2004). Urban Sprawl: Is there a French Case? In H.W. Richardson & C.H.C. Bae (Eds.), Urban Sprawl in Western Europe and the United States (pp. 137–157). London: Ashgate Publishing.
- Renard, J. (1984). Le tourisme: Agent conflictuel de l’utilisation de l’espace littoral en France. Norois, 121, 45–61. doi:10.3406/noroi.1984.7362
- Robin, M., & Verger, F. (1996). Under protection urbanization continues. Les Ateliers du Conservatoire du Littoral, the Annals, 96(13), 173–186.
- Romano, B., & Zullo, F. (2014). Land urbanization in central Italy: 50 years of evolution. Journal of Land Use Science, 9, 143–164. doi:10.1080/1747423X.2012.754963
- Turner, B.L., Lambin, E.F., & Reenberg, A. (2007). The emergence of land change science for global environmental change and sustainability. Proceedings of the National Academy of Science, 104, 20666–20671. doi:10.1073/pnas.0704119104
- Zaninetti, J.-M. (2006). Urban sprawl in France, a regional typology of urbanization trends and its demographics and economy background. Bulletin of Geography, 5/2006, 5–20. http://www.bulletinofgeography.umk.pl/5_2006/zaninetti.pdf
Appendix 1.
Number of available plot-years, houses built and yearly build rate (per 100,000 plot-years) by distance to the sea shore
Bylaws: UDP: urban development plan (based on post-war reconstruction); LUP: land-use plan (based on LUL); LUS: local urbanism schema (based on SUR).
Laws: LUL: land-use law enacted 30 December 1967; CL: Coastal Law enacted 3 January 1986; SUR: Solidarity and Urban Renewal (SUR) Law enacted 13 December 2000.
Note: The area of available plots ranges from 200 to 2000 m2. Smaller and larger plots are excluded from the analysis.
Appendix 2. Adjustment of Cox proportional hazard models.