
ABSTRACT
Tropical forests are under pressure from both commercial and smallholder agriculture. Forest frontiers are seeing dynamic land use changes that frequently lead to land system regime shifts, posing challenges for the sustainability of entire local social-ecological systems. Monitoring highly dynamic land use change and detecting land system regime shifts is methodologically challenging due to trade-offs between spatial and temporal data resolution. We propose an innovative approach that combines analysis of very-high-resolution satellite imagery with participatory mapping based on workshops and field walks. Applying it in Laos, Myanmar, and Madagascar, we were able to collect annual land use information over several decades. Unlike conventional land use change mapping approaches, which assess only few points in time, our approach provides information at a temporal resolution that enables detection of gradual and abrupt land system regime shifts.
Introduction
Natural forests in the tropics continue to decline, reducing the availability of forest goods and services to humans (Keenan et al., Citation2015). In many tropical countries, forest frontiers are advancing due to the expansion of commodity crops in response to global consumer demands (DeFries, Rudel, Uriarte, & Hansen, Citation2010; Van Vliet et al., Citation2012). Only in few countries, such as Madagascar, has shifting cultivation by small-scale farmers remained the main driver of deforestation (Zaehringer, Eckert, & Messerli, Citation2015). At the same time, global actors are feverishly trying to protect remaining tropical forests, as they provide important refuges for biodiversity and store significant amounts of carbon (Malhi, Gardner, Goldsmith, Silman, & Zelazowski, Citation2014). The expansion of commercial agriculture into forest frontier contexts puts pressure not only on forests but also on smallholders’ diverse land systems. By land systems we refer to the biophysical resources of the earth’s systems and the way they are shaped by the activities and processes related to human use (Verburg, Mertz, Erb, Haberl, & Wu, Citation2013). Local social-ecological systems are becoming increasingly connected with distant, local- to global-scale social-ecological systems through flows of products, information, and people, a process that land scientists have termed telecoupling (Eakin et al., Citation2014; Liu et al., Citation2013). Changes in the overall conditions of land use, for example in market prices, land use policies, prevailing development discourses, and environmental factors, cause highly dynamic land use changes in many smallholder social-ecological systems along forest frontiers. Grasping these dynamics is crucial in any effort to plan transformative action and guide land system changes towards more sustainable outcomes.
The forest frontiers of Laos, Myanmar, and Madagascar present interesting examples of increasingly telecoupled land use change processes. The three regions used to share many social-ecological characteristics, such as highly weathered nutrient-poor soils and a very humid climate that encouraged local farmers to rely on shifting cultivation for the production of subsistence rice, as well as on forest products. Meanwhile, political and economic context factors have led to very different development trajectories in the three countries, although they all share the important feature of telecoupling through feedback links between local and distant actors in land use decision-making. In all three cases, spatially distant actors and their claims on land have contributed to highly dynamic local land use change. While land use in northeastern Madagascar has been shaped by global consumer demands for cloves, vanilla, and coffee since colonial times (Danthu et al., Citation2014), Laos has experienced more recent rapid land use changes triggered by Chinese investment policies and a simultaneous governmental push for economic development and poverty alleviation over the last decade (Heinimann & Messerli, Citation2013; Lestrelin, Castella, & Bourgoin, Citation2012). In Myanmar, land use changes from subsistence to commercial agricultural production have accelerated since the country began to liberalize its economy in the late 1980s (Burnley, Gardener, & Grimsditch, Citation2017).
Regime shifts in land systems occur when land systems switch from one alternative state to another in a process that is likely to be irreversible (Müller et al., Citation2014; Ramankutty & Coomes, Citation2016). This may be the result of incremental and gradual changes; but it can also happen when socioeconomic, political, and environmental factors trigger nonlinear and abrupt changes (Dearing, Braimoh, Reenberg, Turner, & Van Der Leeuw, Citation2010; Jepsen et al., Citation2015). Monitoring highly dynamic land use changes and revealing regime shifts poses several methodological challenges related to trade-offs between spatial and temporal resolution. Multitemporal satellite imagery is only available at medium to low spatial resolution. As such imagery generally only reveals land cover (Verburg, Van De Steeg, Veldkamp, & Willemen, Citation2009), very-high-resolution satellite imagery is needed to directly infer land use. However, this kind of imagery has become available only a decade ago and is still very scarce for regions that are frequently cloud-covered, such as the humid tropics. Detecting land system regime shifts and linking dynamic changes to drivers means analyzing long-term land use change trajectories (i.e. sequences of changes from one land use to another) as well as annual change timelines. To date, there is not yet enough very-high-resolution satellite imagery available to enable such analysis. This challenge can only be overcome by means of innovative tools and methods. A participatory approach that combines remote sensing methods with local expert knowledge might provide a solution.
Participatory research methods have a long history of application in natural resource management and planning (Chambers, Citation1994; Thomas-Slayter, Citation1995). Among the most prominent of these methods is participatory mapping, which has been used in developing countries to delineate village agricultural zones (e.g. Nackoney, Rybock, Dupain, & Facheux, Citation2013), to identify sites of resource use in nature reserves (Bernard, Barbosa, & Carvalho, Citation2011; Kalibo & Medley, Citation2007), and to plan for natural resource management in community forestry sites (McCall & Minang, Citation2005). In Laos, extensive participatory land use modelling has been conducted as part of the land use planning processes for the nationwide Land Use Planning and Land Allocation program (Rigg, Citation2005). These efforts began in the early 1990s (e.g. Bourgoin, Castella, Pullar, Lestrelin, & Bouahom, Citation2012; Castella, Bourgoin, Lestrelin, & Bouahom, Citation2014; Lestrelin, Bourgoin, Bouahom, & Castella, Citation2011) and are still ongoing (Heinimann, Flint, Rasso, & Hett, Citation2016). In Madagascar, participatory mapping has been used in setting priorities for conservation and in the land titling process that was initiated through the 2005 land reform (Amelot, Citation2014; Martignac, Teyssier, Thinon, & Cheylan, Citation2011). For Myanmar, participatory mapping approaches have not been documented in the scientific literature to date, which is probably owed to the fact that the country was under an authoritarian rule for decades and research activities during that period remained scarce. Overall, participatory mapping has rarely been used to assess continuous and spatially explicit land use change trajectories in efforts to address land system regime shifts.
In light of these methodological challenges, the aim of this study was to develop a village-level participatory mapping approach capable of delivering continuous multitemporal land use information from 2000 (1990 in the case of Myanmar) to the present for eight case study landscapes in humid tropical forest frontier contexts in Laos, Myanmar, and Madagascar. The study was part of a larger six-year research project with the overall goal of devising and testing innovative strategies and institutional arrangements for securing ecosystem service flows and human well-being within and between telecoupled landscapes. The case study landscapes were therefore selected with a view to comparative analysis and generalization of telecoupling processes and their impacts in forest frontier contexts. The information collected by means of the approach presented in this paper will be used to compare and better understand land use change dynamics in these contexts and how they are linked to ongoing telecoupled land use decision-making processes. In the following sections, we introduce the case study landscapes, present the six methodological steps of our approach, and discuss its potential for detecting land system regime shifts.
Case study landscapes
The participatory mapping approach was developed in three forest frontier contexts in northwestern Laos, southern Myanmar, and northeastern Madagascar, with two case study landscapes each in Laos and Myanmar, and four case study landscapes in Madagascar (). Each case study landscape contains one to four case study villages (). By forest frontier contexts we mean zones characterized by interactions between forest-dominated and agriculture-dominated landscapes (Barney, Citation2009). Such interactions include deforestation for subsistence or large-scale agriculture, as well as the provision of forest ecosystem services. Each of our case study landscapes contains several land systems, for example shifting cultivation, commercial monoculture tree plantations, or permanent subsistence agriculture. The predominance of one or more of these land systems defines the land system regime characterizing the landscape.
Table 1. Satellite imagery used to map current land use and as a basis for the participatory mapping workshops.
Figure 1. Overview of the mapped case study landscapes in the three study regions in Madagascar, Myanmar, and Laos, with tree cover in the year 2000 (Hansen et al., Citation2013) to illustrate the humid tropical forest frontier context.
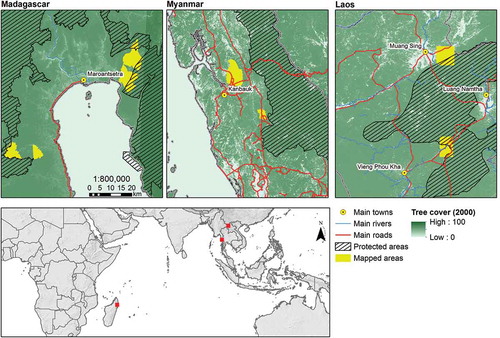
Our study region in Luang Namtha Province in northwestern Laos is part of the area formerly known as Golden Triangle and extends to the country’s borders with China and Myanmar. During the last decade, this area has experienced a huge influx of mainly Chinese investments into cash crops such as rubber, banana, cardamom, and others (Lu, Citation2017; Vongvisouk, Broegaard, Mertz, & Thongmanivong, Citation2016). This has led to highly dynamic (sometimes annual) land use change on small-scale land users’ land. The increasing commodification of agriculture also puts pressure on the biodiversity-rich tropical forest protected by the Nam Ha National Protected Area as land users seek to clear more land to plant rubber and other cash crops. One of the two case study landscapes is in Sing District, close to the Panghai border crossing with China, where large areas of individual farmers’ rubber plantations and paddy land have recently been converted to large-scale banana and sugarcane plantations. The second case study landscape lies in Viengphoukha District, along the R3 main road between Luang Namtha and Bokeo provinces and partly within the Nam Ha National Protected Area. Land users in this area still rely on shifting cultivation for rice production and grow rubber and other cash crops (e.g. cardamom) under contract farming arrangements.
The Tanintharyi region in southern Myanmar is a long and narrow area between the border with Thailand and the Andaman Sea. It has recently experienced a large increase in agricultural and infrastructural investments (Connette, Oswald, Songer, & Leimgruber, Citation2016). Agricultural investments focus mainly on the production of rubber and oil palm for export, and the largest infrastructural investments are four pipelines that transport natural gas from the ocean to Thailand. The Tanintharyi Nature Reserve protects some of the remaining forest areas. Our two case study landscapes show different levels of investment. One of them is located along a gas pipeline, whereas both have oil palm concessions. Local land users mostly grow rubber, betel nut, and cashew.
Northeastern Madagascar is a global biodiversity hotspot. It harbors the island’s largest remaining continuous humid tropical forests, which are under pressure from the ongoing expansion of subsistence agriculture. In an attempt to halt the advancing deforestation frontier, international conservation organizations and the State of Madagascar have established large protected areas for biodiversity conservation. The region’s small-scale land users practice highly diversified farming. Most of them still rely on shifting cultivation to produce subsistence rice, and the increasing pressure on land, due to various factors such as demographic changes, political marginalization, climate change impacts, volatile cash crop markets, and even conservation, leads them to expand their activities into remaining forest areas. Part of that pressure also stems from the growing international demand for high-value cash crops such as cloves and vanilla, which local land users grow in agroforestry systems to generate income (Zaehringer, Schwilch, Andriamihaja, Ramamonjisoa, & Messerli, Citation2017). Our four case study landscapes border the Masoala National Park and the Makira Natural Park, respectively.
Participatory mapping of continuous land use change trajectories in three forest frontier contexts
To overcome the challenges of documenting and understanding continuous land use change trajectories in highly dynamic tropical forest frontier contexts, we developed an innovative participatory mapping approach. The objective was to assess annual land use change between 2000 and 2017 in Laos and Madagascar and between 1990 and 2017 in Myanmar. (The starting date in Myanmar was preponed in response to prior information that important changes had started already in the 1990s.) The approach combines participatory and geocomputational steps (), which we describe in detail below.
Figure 2. Methodological overview of the proposed mapping approach, with dashed lines indicating participatory components. GIS = geographic information system.
Step 1: design of the land use categorization system
During a first field campaign in each of the three study regions, the main land use change trajectories in the respective study period were identified in a qualitative way by means of village-level focus groups with land users. Based on this information and on the requirement of comparability between the three study regions, we then developed a nested land use categorization system where shared categories applying to all three countries are further refined for each country separately (Table SI.1). Although we defined separate categories for cultivated plots and various types of fallows within shifting cultivation, our focus was on land use systems as a whole. Accordingly, for the assessment of past land use changes, the various categories of shifting cultivation plots were subsumed in a single category. In our case study landscapes in Myanmar, shifting cultivation is no longer practiced.
Step 2: object-based segmentation of high-resolution images and visual interpretation
Our participatory mapping approach requires maps showing current land use as a basis to work with. To create such maps, we used archived very-high-resolution satellite imagery or, where necessary, commissioned the acquisition of present-time very-high-resolution satellite imagery (). Due to the limited availability and extent of archived imagery for two of the case study landscapes in Madagascar, we combined two separate images from similar seasons in 2016 and 2017 to cover the whole area.
After preprocessing these very-high-resolution satellite images (pansharpening, geometric corrections, etc.), we performed an object-based segmentation in order to obtain polygons representing homogenous land use categories. This was done using the multiresolution segmentation tool available in the eCognition software (eCognition, Citation2017). The segmentation parameters (spectral band weights, scale, shape, and compactness) were systematically tested to find the best segmentation output for the purpose of subsequent visual interpretation and classification of the land uses in our images. The parameter settings for the three study regions are provided in Table SI.2. Finally, to increase the clarity of plot boundaries, we manually merged or split the polygons. We then assigned land use categories to those polygons for which this was feasible by means of visual interpretation. The other polygons were left to be categorized in the next step.
Step 3: village-level participatory mapping
The first of the three participatory steps consisted of half- to full-day workshops in each study village in the eight case study landscapes (). In Myanmar, we conducted two half-day workshops on two consecutive days in each village. The main goals of each workshop were: (1) to delineate village boundaries and label the main geographical features of the given case study landscape; (2) to verify the land use categories shown on the current land use map; and (3) to document spatially explicit local knowledge about the land use trajectories of the different sections (e.g. slopes, valleys, large plains with paddy fields) of the study landscape.
Table 2. Overview of methods applied in the different countries and case study landscapes.
For the mapping workshops, we printed the satellite images in color and with a metric grid onto A0-format paper. The scale was 1:10,000 for the study landscapes in Madagascar and Myanmar, and 1:15,000 for the study landscapes in Laos. In the case of Madagascar, available ancillary data such as Hansen’s 2000–2015 deforestation data (Hansen et al., Citation2013), a map with hill shading based on the 12-m-resolution digital elevation model provided by the German Aerospace Center’s TanDEM-X satellite (DLR, Citation2017), and other available very-high-resolution satellite images were printed onto A3 sheets with the same metric grid and scale as the satellite image prints (Table SI.3). In Laos, in addition to global deforestation data (Hansen et al., Citation2013), we used available very-high and medium resolution satellite imagery as ancillary data. No ancillary data were used in Myanmar. All printed satellite images were covered with transparent A3 sheets for workshop participants to draw and write on using waterproof felt pens.
In each village, we first contacted the village authorities, explained the methodology, and asked them to invite participants to the workshop. Participants were sought among middle-aged to elderly land users who were knowledgeable about both current land use in the area and land use change trajectories since at least 2000. As we assumed that information about past land uses is relatively objective, we did not require participant groups to be representative of the local population in terms of their socio-economic or gender characteristics. The number of participants per village ranged between three and 14 (in Myanmar). The higher number of participants in Myanmar can be explained by the fact that research activities by foreigners at the village level are still a new experience and therefore attract the interest of many local land users. Eventually this effect wore off, however, so that the number of active participants ended up being comparable to those in the workshops elsewhere. The workshops were held in schools or village meeting halls. They were moderated by local PhD students and/or research assistants in the respective local language. The information was recorded directly on the map (see below), in hand-written notes, and in audio recordings.
After an initial discussion on the workshop aims, participants identified key landscape elements (e.g. streams and rivers, mountains, valleys) on the base maps and labelled them with their local names. This crucial step facilitates the geolocation of specific features when talking about land use and land use change and enhances the participants’ ability to discuss their ideas with the moderators.
For each clearly distinguishable land use category in the image, participants then confirmed or corrected the current land use and the polygon boundaries, indicating changes on a transparent sheet. To investigate land use change in the different sections of the overall landscape (e.g. slopes, valleys, large plains with paddy fields), we asked participants about previous land uses in each section and the year in which the land use had changed. The moderator recorded this information on colored sticky notes (one color per land use category) and attached them to the respective polygons on the transparent sheet. In some cases, referring to past political or natural events (e.g. change of government, cyclone, flood) helped land users to remember when certain land use changes had happened. Especially in Madagascar, pointing out the previous location of the forest frontier or resorting to Hansen et al.’s (Citation2013) annual deforestation data provided further clues as to when certain changes had happened. As soon as the land use changes in a specific section of the landscape had been established back to the year 2000 (1990 in Myanmar), we would move on to the next section. Once this procedure was completed for all sections of the landscape, the moderator would close the discussion by wrapping up the information contributed by the participants and by asking whether any of them were willing to join the researchers on the subsequent field walks ().
Figure 3. Implementation of the participatory mapping workshops and field walks in (a) Madagascar, (b) Laos, and (c) Myanmar.
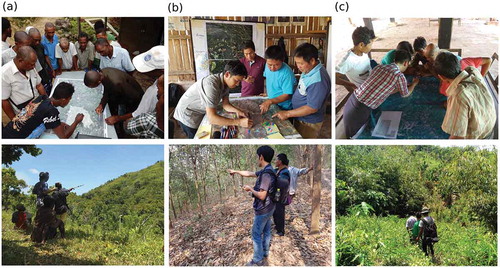
Step 4: field walks for enhanced spatialization
The second participatory step consisted of field walks with land users with the aim of improving the spatialization of land use changes on the satellite images. Field walk participants were identified at the end of each mapping workshop. In Laos, after having conducted the workshop in the village of Nammy, we learned that part of the land in the satellite imagery was managed by land users from the neighboring village of Namdetmai; for this reason, we additionally carried out field walks with land users from that village. Before each field walk, participants and researchers jointly identified a feasible route that would cross all different land use categories in sections of the case study landscape where dynamic changes had occurred. In Madagascar the field walks were done on foot, whereas in Myanmar and particularly in Laos the relatively good condition of the paths sometimes enabled the use of motorbikes. The researchers carried along A3 printouts of the current land use map resulting from the object-based segmentation (Step 2) and corrections made during the workshop (Step 3). Moreover, each polygon in the map had been labelled with a unique identifier. For each polygon for which no past land use information was available from the workshop, the researchers registered the coordinates by means of a GPS device, took geolocated pictures in all four cardinal directions, and noted the current land use as well as previous land uses and years of change in a table. In Laos, all information collected during the field walks, including pictures and coordinates, was registered and synchronized online using a smartphone application that had been programmed specifically for this purpose using the CommCare software (Dimagi, Citation2002). Due to limited mobile coverage and power supply, this solution was not feasible in Madagascar and Myanmar, where information was recorded on paper or in audio files. In total, researchers and participants conducted between 110 and 401 km of field walks in each of the three countries.
The time required to implement Steps 3 and 4 differed from country to country. In Madagascar, fieldwork was conducted from October to December 2016, during which time we implemented four focus group discussions and 104 km of field walks, and from August to November 2017, when we completed the remaining 298 km of field walks. In the other two countries, fieldwork took considerably less time, mainly because the case study landscapes there are much more accessible than those in Madagascar. In Laos, 6 workshops and 110 km of field walks were conducted in February and March 2017, and in Myanmar, 2 workshops and 159 km of field walks were implemented during one week in March 2017 and one week in May 2017. In both countries it was possible to use motorbikes for the field walks; moreover, the case study landscapes in Myanmar were much smaller than those in the other two countries.
Step 5: data transfer into a geographic information system
Finally, the temporally dense land use information gained during the two participatory steps (Step 3 and Step 4) had to be transferred into a geographic information system. The first thing to be entered into the system was the geometry of current land use resulting from the geocomputational image segmentation (Step 2) and the mapping workshop (Step 3). The information about past land uses gained during the mapping workshop (Step 3) and the field walks (Step 4) was then attributed to these polygons; if the geometry had been different in the past, the polygons were split accordingly. This process resulted in a layer of polygons with the land use for each polygon and year listed in the attribute table. By extracting the land use information for all polygons for each year, we were able to generate individual land use maps for each year between 2000 (or 1990 in the case of Myanmar) and 2017. In the case of Madagascar, the maps contained between 2,501 polygons in Morafeno and 11,598 polygons in Mahalevona. In Laos, the map of the Oudomsin case study landscape contained 2,934 polygons and that of Prang 3,291 polygons. Considerably fewer but larger polygons were obtained in Myanmar, where the case study landscapes are less fragmented, with larger units having the same combination of mixed agricultural uses. The map of Hein Ze consists of only 203 polygons, and that of Ein Da Rar Zar of 620 polygons (). The total mapped area per case study landscape ranged between 1,400 ha in Hein Ze, Myanmar, and 7,200 ha in Oudomsin, Laos. The differences in the overall mapped areas result from differences in the spatial extent of land use activities in the various case study villages.
Table 3. Total number of polygons, average size of polygons, and overall area mapped per case study landscape.
Step 6: feedback workshops
In an upcoming next step, we will feed the outputs and related insights back to the participants in an additional workshop in each of the case study villages. By doing so, we aim to foster social learning among participants regarding the main land use change trajectories in the case study landscapes. According to Reed et al. (Citation2010), social learning occurs when individuals gain a new level of understanding by interacting with each other in a social network; stakeholder participation alone does not imply social learning. In our cases, social learning will be of benefit especially with a view to potential future participatory land use planning and land zoning efforts. Such efforts have become a common planning tool in Laos in recent years. They might gain in importance in Myanmar and Madagascar, too, given the increasing expansion of cash crops in Myanmar and of protected areas in Madagascar.
Visualization of land system change
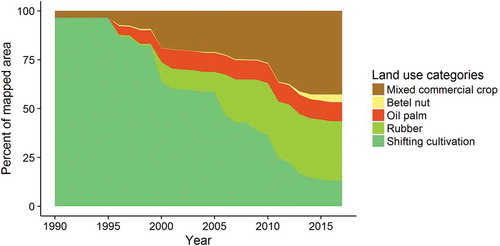
The main output of Steps 1–6 of this approach were eight interactive maps showing annual land use between 2000 (or 1990 in the case of Myanmar) and 2017 for each of the case study landscapes in the three countries. The maps can be viewed like a slideshow, enabling viewers to watch land uses change from one year to the next like in a time-lapse film. Figure (see http://bit.ly/2j5X2dv) shows the map of the Hein Ze case study landscape in Myanmar as an example. A second output were graphs for each case study landscape that show how the shares of the different land uses in the overall landscape changed over time. shows such a graph for the case study landscape of Hein Ze (Myanmar) as an example. The graph illustrates in an accessible way how the land system changed between 1990 and 2017. In 1990, almost the entire case study landscape of 1,431 ha had consisted of shifting cultivation for rice production, with only a small share of mixed crop plantations (including betel nut, rubber, cashew, and other crops). Burmese private investors introduced oil palm monocultures in 1996 and 2001, while rubber plantations strongly increased in area from the year 2000 onwards. This was likely due to a combination of factors, including an increase in rubber trade between Myanmar and China (Woods, Citation2012), a growing rubber price (FAO, Citation2017), and improved availability of rubber seedlings in the area. Another increase took place after 2012, as a result of the Farmland Law passed in that year (The Republic Union of Myanmar, Citation2012). According to this law, villagers had to prove that they were cultivating cleared land in order to register it as private land and prevent outside actors from acquiring it; many villagers did this by establishing rubber plantations. By 2017, the case study landscape was dominated by mixed commercial crop and monoculture rubber plantations, with smaller areas of oil palm and betel nut. The shifting cultivation areas shrank from over 90% to about 10% of the case study area between 1996 and 2017. This is an example of a land system regime shift triggered by economic and policy factors which took place gradually over the course of twenty years.
Figure 4. Land use transitions in Hein Ze (Myanmar) from 1990 to 2017, shown as changes in the shares of the different land uses in the overall landscape (1,431 ha) over time.
Overcoming the trade-off between spatial and temporal resolution to enable land system regime shift detection
In the preceding sections of this paper, we have presented an innovative approach to overcoming the challenges of mapping annual land use change over extended periods of time in highly dynamic forest frontier contexts. In view of the rapid decline of biodiversity-rich forests and the expansion of commodity agriculture in many of the world’s tropical regions, this approach provides a timely tool to closely monitor such phenomena at the local scale. While participatory mapping and geographic information systems have been employed in developing countries to support land use planning and ecosystem services assessment (Bourgoin & Castella, Citation2011; Bourgoin et al., Citation2012), they have hardly been used to map annual land use change over multiple decades. Our innovative approach has enabled us to create detailed land use maps for every year since 2000 (1990 in the case of Myanmar) in our case study landscapes. We see four distinct features of the approach that justify its application.
The first feature relates to current methodological challenges in detecting land systems by means of remote sensing. Common remote sensing methods to map land use change imply a trade-off between spatial and temporal resolution. For one thing, very-high-resolution satellite imagery has only become widely available in the last decade, which hampers the investigation of local-scale land use changes in earlier periods. Medium-resolution data, which dates further back in time, is not detailed enough to enable direct inferences about land use (Verburg et al., Citation2009). In addition, frequent cloud cover over tropical regions further reduces the number of useable images of these regions. Our approach only requires a current high-resolution image of the study area (which for most case study landscapes we obtained by commissioning its acquisition by the Pléiades satellites). By combining this with land users’ knowledge about the land use history of their surroundings, we were able to overcome the trade-off between spatial and temporal resolution. As the approach is time intensive, especially in remote areas like northeastern Madagascar, where all field walks had to be carried out on foot, it is only suitable for relatively small case study landscapes (< 100 km2). However, to date no other approach is capable of generating information about past annual changes in land use (as opposed to land cover).
Secondly, the aim of our study was to develop an approach capable of providing information on land use transitions that could then be linked with information on land use decision-making processes. Such information must enable a good understanding of what kinds of land use transitions occurred in a given landscape, whereas the exact spatial boundaries of individual plots or the exact year of change are less important. This means that the information on land use categories per plot and on land use transitions in the observed period needs to be as accurate as possible, whereas spatial accuracy is less relevant. A classical remote sensing accuracy assessment (Congalton & Green, Citation2008) of our approach is not feasible, as evaluating accuracy at the level of land use (as opposed to land cover) would require very-high-resolution imagery for the entire period of interest; such imagery simply does not exist. At the level of land cover, we used global annual forest change data (Hansen et al., Citation2013) to confirm abrupt land use changes (forest to non-forest) indicated by land users. This revealed that participants were often strikingly accurate in recalling the temporal and spatial details of past changes in the landscapes studied. The fact that many participants had held plots or had worked in different areas of the case study landscapes throughout their life guaranteed that each of the workshops yielded knowledge about virtually the entire landscape. Moreover, participants often had overlapping knowledge about the same areas, which prompted exchange between them, further improving the accuracy of the final land use change information collected. However, the limited time available for each workshop was a major constraint on fully exploiting and grasping this invaluable knowledge. This is why the extended field walks for in-depth plot-level change assessment in areas identified as critical were a necessary further step in this approach: they enabled longer discussions with individual land users. By combining these two participatory methods, we aimed to strike a balance between spatial coverage of the case study landscapes and detail of the land use change information gathered, with respect to both accurate dating of land use changes and accurate documentation of the spatial scale at which these dynamics took place. In terms of outputs, the graphs visualizing land use transitions as changes in the shares of different land uses in a landscape are a promising tool to inform current scientific discourses on topics such as forest transitions (Kozak & Szwagrzyk, Citation2016; McConnell, Viña, Kull, & Batko, Citation2015; Meyfroidt & Lambin, Citation2011) and agricultural intensification (Phelps, Carrasco, Webb, Koh, & Pascual, Citation2013; Tscharntke, Klein, Kruess, Steffan-Dewenter, & Thies, Citation2005; Turner & Ali, Citation1996).
Thirdly, the continuous time lines of land use change make it possible to identify ruptures and to link them to specific drivers and events. This is crucial in any attempt to gain a better understanding of so-called land system regime shifts (Müller et al., Citation2014; Ramankutty & Coomes, Citation2016), especially in the context of telecoupled land use decision-making (Eakin et al., Citation2014; Friis & Nielsen, Citation2017). So far, empirical analyses of land system regime shifts have been based on stakeholder narratives alone, without including spatially explicit information (Jepsen et al., Citation2015), or have analysed spatially explicit information only at few points in time (Li, Fassnacht, Storch, & Bürgi, Citation2017). By providing annual spatially explicit land use data over multiple decades, our approach makes it possible to detect regime shifts happening in a matter of few years, many of which would be left undetected using other approaches due to the coarse temporal resolution of the data produced. In the Myanmar case presented in the visualization example in the previous section, the land system regime shift happened gradually over the course of 20 years. By contrast, in one of our case study landscapes in Laos, two drastic land use changes occurred within only five years: In 2013, local land users leased irrigated paddy land to Chinese investors for intensive banana cultivation (Friis & Nielsen, Citation2017). After an uproar in civil society over the large amounts of agrochemicals applied in these plots, the Lao government banned the leasing of land for intensive banana cultivation in April 2017 (Diplomat, Citation2017). As banana investors abandoned their plantations, other Chinese investors stepped in, offering contract farming schemes for the production of sugarcane. Banana plantations are currently being uprooted, and farmers are switching to sugarcane. The large-scale ploughing has destroyed the boundary markers of the previous rice paddies, and as a result many land users are no longer able to clearly identify their fields. This, along with various other social-ecological impacts of these recent land use changes, makes it highly unlikely that this community will ever go back to the previous land use system, indicating an abrupt and substantial land system regime shift. These examples show that our approach is an appropriate means to detect both gradual and abrupt regime shifts in a given land system.
Lastly, the participatory components of this approach have two major advantages: Although this was not a deliberate goal, besides capturing local people’s knowledge about the land use history of their surroundings, the workshops and field walks also encouraged individual social learning among participants (Reed et al., Citation2010). In Laos, two participants who led us up a steep ridge in the middle of extended rubber plantations were surprised to see to what extent the landscape had changed since they had last visited this place a few years before. And in one of the case study landscapes in Myanmar, after the first day of the participatory mapping workshop some of the participants came back with sketch maps of land use changes they had drawn out of their own initiative to support the mapping process (Schneider, Lundsgaard-Hansen, Vongvisouk, & Zaehringer, Citation2017). Such processes prepare the way for future participatory land use planning exercises (Heinimann et al., Citation2016), which offer considerable potential for transformations towards sustainable development. Nevertheless, as is common in participatory workshop situations, power dynamics between individuals with different statuses in terms of age (e.g. elders and younger individuals in Madagascar) or political position (e.g. communist party members and non-members in Laos) influenced which participants made their voices heard during the workshops (Chambers, Citation2006). While there is no straightforward way to address this sensitive issue, the moderators tried to subtly encourage less empowered individuals to voice their ideas. Remarkably, no women participated in the workshops in any of the three countries, even though they were invited; they justified this by saying they were less knowledgeable about the area’s land use history than men. Even though the participation of women would have been desired, especially with a view to including them into social learning processes, in practical terms this was very difficult to achieve. Women have a unique perspective on land and relate to land differently than men (Baker, Cullen, Debevec, & Abebe, Citation2015; International Fund for Agricultural Development, Citation2009; Rocheleau, Thomas-Slayter, & Edmunds, Citation1994). They usually also have different access to and ownership of land (McCall, Citation2003), which can lead to different outcomes in a participatory mapping exercise (Christie & Luebbering, Citation2011). In our approach, given that the land use categories had already been defined before the workshops and we only elicited information about their occurrence in space and time, the omission of women in the workshops likely did not affect the map outcomes in a systematic way, but it may have reduced precision for certain plots. We will try to mitigate this issue during Step 6 of our approach, presentation of the land use change maps to villagers in feedback workshops. As these workshops will simultaneously be used to discuss the impacts of the observed land use changes on human well-being, they might attract more women than the participatory mapping workshops, enabling us to tease out their ideas. When it comes to the actual planning of future land use, however, women and villagers from a range of social positions will by all means have to be encouraged to take an active role in the process from the very beginning (Bourgoin et al., Citation2012).
Testing the approach in three different countries has also revealed a number of challenges regarding its implementation. The participatory mapping workshops were not equally successful in all three countries. In Madagascar, finding motivated participants turned out to be extremely difficult. This seems to be due mainly to the history of research and development interventions in our study areas. Several projects have conducted numerous workshops over the last decades, but few have ever come back to share the results; this is likely to have caused research fatigue among the local population (Jagger, Duchelle, Dutt, & Wyman, Citation2011). Once interested participants had been found, it turned out that in most cases their interest dwindled after a couple of hours, making it difficult to cover the complex land use change histories of all sections of the landscape. Accordingly, the team of researchers had to rely heavily on the information collected during the field walks, which made the field walks even more time-consuming than they already would have been, as they had to be conducted on foot in very rugged terrain. In Laos, on the other hand, it was challenging to elicit information on shifting cultivation activities, especially if they had been or were taking place in the Nam Ha protected area. This can be explained by the long history of authorities trying to suppress this land use system and resettling shifting cultivators to lowland villages. The use of annual deforestation data provided by Hansen et al. (Citation2013) allowed us to verify the information provided by the participants and to amend it if necessary. In Myanmar, the main difficulty pertained to the fact that a large part of the landscape is dominated by mixed land use systems, which made it difficult to distinguish between plots. As a result, the maps of the Myanmar case study landscapes ended up having a lower spatial resolution than the maps from Madagascar and Laos.
Conclusion
In this paper, we proposed a participatory approach to mapping continuous land use change trajectories over fairly long periods at the village level. Our approach, which includes workshops and field walks, is suited to provide temporally dense information about land use and its changes over an extended period of one to several decades. The approach makes it possible to overcome the trade-off between spatial and temporal resolution that is inherent to common remote sensing methods. The participatory components of the approach not only serve to elicit local land users’ vast knowledge on past land use changes, but also trigger individual social learning and prepare the way for future land use planning efforts. Compared to conventional approaches to land cover or land use change mapping, which assess the information at one, two, or maybe three discrete points in time, the proposed approach has one great advantage: It enables the identification of potential land system regime shifts at any specific time within the period analyzed. Such information is highly valuable, as it may help to identify links between certain types of regime shifts and specific drivers of change, both within and beyond the local context. Understanding the causes of land system regime shifts is particularly important because such regime shifts frequently come with changes in the functioning of entire social-ecological systems. In the forest frontier landscapes of Laos, Myanmar, and Madagascar, where the land claims of actors from multiple scales cause pronounced trade-offs between increasing agricultural production and conserving biodiversity and ecosystem services, such knowledge is crucial in supporting transformations towards more sustainable future land governance.
Supplemental_material.docx
Download MS Word (31.2 KB)Acknowledgments
The authors would like to thank the DigitalGlobe Foundation for providing the QuickBird 2 satellite imagery used as ancillary data in the Madagascar case studies. We also thank the German Aerospace Center for providing the TanDEM-X digital elevation model data (© DLR, Citation2017) employed in this research. This research was supported by the Swiss Programme for Research on Global Issues for Development (r4d programme), which is funded by the Swiss National Science Foundation (SNSF) and the Swiss Agency for Development and Cooperation (SDC), under grant number 400440 152167. We are grateful to Lara Lundsgaard-Hansen for her valuable feedback on the Myanmar case study and to Christoph Bader for the online visualization of Figure (see http://bit.ly/2j5X2dv). We thank Marlène Thibault for copyediting the manuscript.
Supplementary data
Supplemental data for this article can be accessed here.
Disclosure statement
No potential conflict of interest was reported by the authors.
Additional information
Funding
Related Research Data
References
- Amelot, X. (2014). Cartographie participative pour le développement local et la gestion de l’environnement à Madagascar : Empowerment, impérialisme numérique ou illusion participative? L’Information Géographique, 77(4), 47–67.
- Baker, T.J., Cullen, B., Debevec, L., & Abebe, Y. (2015). A socio-hydrological approach for incorporating gender into biophysical models and implications for water resources research. Applied Geography, 62, 325–338.
- Barney, K. (2009). Laos and the making of a ‘relational’ resource frontier. Geographical Journal, 175(2), 146–159.
- Bernard, E., Barbosa, L., & Carvalho, R. (2011). Participatory GIS in a sustainable use reserve in Brazilian Amazonia: Implications for management and conservation. Applied Geography, 31(2), 564–572.
- Bourgoin, J., & Castella, J.-C. (2011). “PLUP FICTION”: Landscape simulation for participatory land use planning in Northern Lao PDR. Mountain Research and Development, 31(2), 78–88.
- Bourgoin, J., Castella, J.-C., Pullar, D., Lestrelin, G., & Bouahom, B. (2012). Toward a land zoning negotiation support platform: “Tips and tricks” for participatory land use planning in Laos. Landscape and Urban Planning, 104(2), 270.
- Burnley, J., Gardener, D., & Grimsditch, M. (2017). Whose crops, at what price? Agricultural investment in Myanmar (Oxfam Discussion Paper) (p. 48). Oxford, UK: Oxfam GB for Oxfam International.
- Castella, J.-C., Bourgoin, J., Lestrelin, G., & Bouahom, B. (2014). A model of the science–Practice–Policy interface in participatory land-use planning: Lessons from Laos. Landscape Ecology, 29(6), 1095–1107.
- Chambers, R. (1994). The origins and practice of participatory rural appraisal. World Development, 22(7), 953–969.
- Chambers, R. (2006). Participatory mapping and geographic information systems: Whose map? Who is empowered and who disempowered? Who gains and who loses? The Electronic Journal of Information Systems in Developing Countries, 25. doi:10.1002/j.1681-4835.2006.tb00163.x
- Christie, M.E., & Luebbering, C. (2011). Women as mapmakers: Gender and empowerment in participatory mapping. Retrieved from https://vtechworks.lib.vt.edu/handle/10919/70232
- Congalton, R.G., & Green, K. (2008). Assessing the accuracy of remotely sensed data: Principles and practices. Boca Raton, USA: CRC press.
- Connette, G., Oswald, P., Songer, M., & Leimgruber, P. (2016). Mapping distinct forest types improves overall forest identification based on multi-spectral landsat imagery for Myanmar’s Tanintharyi Region. Remote Sensing, 8(11), 882.
- Danthu, P., Penot, E., Ranoarisoa, K.M., Rakotondravelo, J.C., Michel, I., Tiollier, M., & Jahiel, M. (2014). The clove tree of Madagascar, a success story with an unpredictable future. Bois Et Forets Des Tropiques, 320(320), 83–96.
- Dearing, J., Braimoh, A., Reenberg, A., Turner, B., & Van Der Leeuw, S. (2010). Complex land systems: The need for long time perspectives to assess their future. Ecology and Society, 15(4). doi:10.5751/ES-03645-150421
- DeFries, R.S., Rudel, T., Uriarte, M., & Hansen, M. (2010). Deforestation driven by urban population growth and agricultural trade in the twenty-first century. Nature Geoscience, 3(3), 178–181.
- Dimagi, I. (2002). CommCare (version X.X.X) [Mobile application software]. Cambridge, MA: Dimagi, Inc. Retrieved from http://commcarehq.org
- Diplomat, P.P. (2017, April 14). What’s behind Laos’ China banana ban? Retrieved June 14, 2017, from http://thediplomat.com/2017/04/whats-behind-the-china-banana-ban-in-laos/
- DLR. (2017). TanDEM-X DEM data. Köln, Germany.
- Eakin, H., DeFries, R., Kerr, S., Lambin, E.F., Liu, J., Marcotullio, P., … Wicke, B. (2014). Significance of telecoupling for exploration of land-use change. In K.C. Seto & A. Reenberg (Eds.), Rethinking global land use in an urban era. Cambridge, MA: The MIT Press, Massachusetts Institute of Tecnology Cambridge, Massachusetts 02142.
- eCognition. (2017). Trimble geospatial. Westminster, CO, USA.
- FAO. (2017). FAOSTAT. Retrieved December 6, 2017, from http://faostat3.fao.org
- Friis, C., & Nielsen, J.Ø. (2017). On the system. Boundary choices, implications, and solutions in telecoupling land use change research. Sustainability, 9(6), 974.
- Hansen, M.C., Potapov, P.V., Moore, R., Hancher, M., Turubanova, S.A., Tyukavina, A., … Townshend, J.R.G. (2013). High-resolution global maps of 21st-century forest cover change. Science, 342(6160), 850–853.
- Heinimann, A., Flint, C., Rasso, B., & Hett, C. (2016). Putting upland agriculture on the map. The TABI experience in Laos. In M. Cairns (Ed.), Shifting cultivation policy in the Asia-Pacific Region: Trying to get it right. London: Earthscan from Routledge.
- Heinimann, A., & Messerli, P. (2013). Coping with a land-grab world: Lessons from Laos. Global Change. International Geosphere-Biosphere Programme, 80, 12–15.
- International Fund for Agricultural Development. (2009). Good practices in participatory mapping. A review prepared for the International Fund for Agricultural Development (IFAD). Rome: IFAD.
- Jagger, P., Duchelle, A., Dutt, S., & Wyman, M. (2011). Preparing for the field: Managing and enjoying fieldwork. In A. Angelsen, H.O. Larsen, J.F. Lund, C. Smith-Hall, & S. Wunder (Eds.), Measuring livelihoods and environmental dependence. methods for research and fieldwork (pp. 147–162). London, UK, and Washington, USA: Earthscan.
- Jepsen, M.R., Kuemmerle, T., Müller, D., Erb, K., Verburg, P.H., Haberl, H., … Reenberg, A. (2015). Transitions in European land-management regimes between 1800 and 2010. Land Use Policy, 49(SupplementC), 53–64.
- Kalibo, H.W., & Medley, K.E. (2007). Participatory resource mapping for adaptive collaborative management at Mt. Kasigau, Kenya. Landscape and Urban Planning, 82(3), 145–158.
- Keenan, R.J., Reams, G.A., Achard, F., De Freitas, J.V., Grainger, A., & Lindquist, E. (2015). Dynamics of global forest area: Results from the FAO Global Forest Resources Assessment 2015. Forest Ecology and Management, 352, 9–20.
- Kozak, J., & Szwagrzyk, M. (2016). Have there been forest transitions? Forest transition theory revisited in the context of the modifiable areal unit problem. Area, 48(4), 504–512.
- Lestrelin, G., Bourgoin, J., Bouahom, B., & Castella, J.-C. (2011). Measuring participation: Case studies on village land use planning in northern Lao PDR. Applied Geography, 31(3), 950–958.
- Lestrelin, G., Castella, J.-C., & Bourgoin, J. (2012). Territorialising sustainable development: The politics of land-use planning in Laos. Journal of Contemporary Asia, 42(4), 581–602.
- Li, L., Fassnacht, F.E., Storch, I., & Bürgi, M. (2017). Land-use regime shift triggered the recent degradation of alpine pastures in Nyanpo Yutse of the eastern Qinghai-Tibetan Plateau. Landscape Ecology, 32(11), 2187–2203.
- Liu, J., Hull, V., Batistella, M., DeFries, R., Dietz, T., Fu, F., … Li, S. (2013). Framing sustainability in a telecoupled world. Ecology and Society, 18(2), 26.
- Lu, J.N. (2017). Tapping into rubber: China’s opium replacement program and rubber production in Laos. The Journal of Peasant Studies, 1–22. doi:10.1080/03066150.2017.1314268
- Malhi, Y., Gardner, T.A., Goldsmith, G.R., Silman, M.R., & Zelazowski, P. (2014). Tropical Forests in the Anthropocene. Annual Review of Environment and Resources, 39(1), 125–159.
- Martignac, C., Teyssier, A., Thinon, P., & Cheylan, J.-P. (2011). SIG participatifs et développement. L’expérience de la réforme foncière malgache. Revue Internationale De La Géomatique, 1, 73-97.
- McCall, M.K. (2003). Seeking good governance in participatory-GIS: A review of processes and governance dimensions in applying GIS to participatory spatial planning. Habitat International, 27(4), 549–573.
- McCall, M.K., & Minang, P.A. (2005). Assessing participatory GIS for community-based natural resource management: Claiming community forests in Cameroon. Geographical Journal, 171(4), 340–356.
- McConnell, W.J., Viña, A., Kull, C., & Batko, C. (2015). Forest transition in Madagascar’s highlands: Initial evidence and implications. Land, 4(4), 1155–1181.
- Meyfroidt, P., & Lambin, E.F. (2011). Global forest transition: Prospects for an end to deforestation. Annual Review of Environment and Resources, 36(1), 343–371.
- Müller, D., Sun, Z., Vongvisouk, T., Pflugmacher, D., Xu, J., & Mertz, O. (2014). Regime shifts limit the predictability of land-system change. Global Environmental Change, 28, 75–83.
- Nackoney, J., Rybock, D., Dupain, J., & Facheux, C. (2013). Coupling participatory mapping and GIS to inform village-level agricultural zoning in the Democratic Republic of the Congo. Landscape and Urban Planning, 110, 164–174.
- Phelps, J., Carrasco, L.R., Webb, E.L., Koh, L.P., & Pascual, U. (2013). Agricultural intensification escalates future conservation costs. Proceedings of the National Academy of Sciences, 110, 7601–7606.
- Ramankutty, N., & Coomes, O. (2016). Land-use regime shifts: An analytical framework and agenda for future land-use research. Ecology and Society, 21(2). doi:10.5751/ES-08370-210201
- Reed, M., Evely, A.C., Cundill, G., Fazey, I.R.A., Glass, J., Laing, A., & Stringer, L. (2010). What is social learning? Ecology and Society, 15. doi:10.5751/ES-03564-1504r01
- The Republic Union of Myanmar. Pyidaungsu Hluttaw/The Farmland Law. (2012). Yangon, Myanmar: The Republic Union of Myanmar.
- Rigg, J. (2005). Living with Transition in Laos: Market Intergration in Southeast Asia. London and New York: Routledge.
- Rocheleau, D., Thomas-Slayter, B., & Edmunds, D. (1994). Gendered resource mapping: Focusing on women’s spaces in the landscape. Retrieved from https://vtechworks.lib.vt.edu/handle/10919/68994
- Schneider, F., Lundsgaard-Hansen, L., Vongvisouk, T., & Zaehringer, J.G. (2017). Impacts of social learning in transformative research. Retrieved May 17, 2017, from https://i2insights.org/2017/05/16/social-learning-impacts/
- Thomas-Slayter, B. (1995). A brief history of participatory methodologies. In R. Slocum, L. Wichart, D. Rocheleau, & B. Thomas-Slayter (Eds.), Power, process and participation: Tools for change (pp. 9–17). London, UK: Intermediate Technology Publications.
- Tscharntke, T., Klein, A.M., Kruess, A., Steffan-Dewenter, I., & Thies, C. (2005). Landscape perspectives on agricultural intensification and biodiversity – Ecosystem service management. Ecology Letters, 8(8), 857–874.
- Turner, B.L., & Ali, A.M.S. (1996). Induced intensification: Agricultural change in Bangladesh with implications for Malthus and Boserup. Proceedings of the National Academy of Sciences, 93(25), 14984–14991.
- Van Vliet, N., Mertz, O., Heinimann, A., Langanke, T., Pascual, U., Schmook, B., & Ziegler, A.D. (2012). Trends, drivers and impacts of changes in swidden cultivation in tropical forest-agriculture frontiers: A global assessment. Global Environmental Change, 22, 418–429.
- Verburg, P.H., Mertz, O., Erb, K.-H., Haberl, H., & Wu, W. (2013). Land system change and food security: Towards multi-scale land system solutions. Current Opinion in Environmental Sustainability, 5, 494–502.
- Verburg, P.H., van de Steeg, J., Veldkamp, A., & Willemen, L. (2009). From land cover change to land function dynamics: A major challenge to improve land characterization. Journal of Environmental Management, 90(3), 1327–1335.
- Vongvisouk, T., Broegaard, R.B., Mertz, O., & Thongmanivong, S. (2016). Rush for cash crops and forest protection: Neither land sparing nor land sharing. Land Use Policy, 55, 182–192.
- Woods, K. (2012). The political ecology of rubber production in Myanmar: An overview (pp. 1–66). Yangon, Myanmar. Retreived from https://www.globalwitness.org/sites/default/files/The%20Political%20Ecology%20of%20Rubber%20Production%20in%20Myanmar%20FINAL.pdf
- Zaehringer, J.G., Eckert, S., & Messerli, P. (2015). Revealing regional deforestation dynamics in North-Eastern Madagascar—insights from multi-temporal land cover change analysis. Land, 4(2), 454–474.
- Zaehringer, J.G., Schwilch, G., Andriamihaja, O.R., Ramamonjisoa, B., & Messerli, P. (2017). Remote sensing combined with social-ecological data: The importance of diverse land uses for ecosystem service provision in north-eastern Madagascar. Ecosystem Services, 25, 140–152.