
ABSTRACT
Farm diversification is of growing importance for European farmers to stabilize and/or increase their income, especially in urban and peri-urban areas. This article identifies determinants of the uptake and intensity of on-farm non-agricultural diversification such as agritourism activities, on-farm processing and direct sales activities in the Ruhr metropolitan region in Germany based on a survey among 156 farms. We find a high share of diversified farms in the Ruhr metropolitan region, often with more than one diversification activity. Environmental, farm and farmer characteristics have distinctive effects on the farmers’ diversification decision and the farmers’ decision on the diversification intensity. Younger, risk seeking farmers with secured farm succession and less productive soils are more likely to choose on-farm non-agricultural diversification. Additionally, we find that diversification intensity is positively influenced by proximity to urban areas, as well as a specialization on high value crops and the usage of extension service consultancy.
1 Introduction
The importance of farm diversification to stabilize farm incomes and income risk has rapidly grown over the last years (European Parliamentary Research Service, Citation2016; McNamara & Weiss, Citation2005). Farm diversification can be distinguished in off-farm (e.g. off-farm labor allocation) and on-farm diversification. The latter can further be separated in on-farm agricultural diversification activities (e.g. a broadening of agricultural activities such as use of different crops and livestock production activities) and on-farm non-agricultural diversification activities. In this paper, we focus on the latter, more specifically on non-agricultural diversification activities such as agritourism activities, the provision of (e.g. social) services, equestrian businesses, as well as on-farm processing and direct sales activities.Footnote1
The uptake of on-farm non-agricultural diversification activities is particularly large in farming systems in urban and peri-urban areas (Ilbery, Citation1991; Zasada, Citation2011). This is due to the proximity to large agglomerations that influences the demand for agricultural goods and services as well as the opportunity costs of farming activities. More specifically, proximity to urban centers increases incentives to develop new activities and valorizes the multifunctional nature of agriculture due to increased demand, short supply chains, direct marketing opportunities and community supported agriculture (Heimlich & Barnard, Citation1992; Ilbery, Citation1991; Wilson, Citation2008; Zasada, Berges, Hilgendorf, & Piorr, Citation2013). In contrast, the proximity to urban centers also creates challenges for farms. For example, the increased demand for land and labor created by high population density generates high opportunity costs, due to higher wages and land prices outside agriculture, as well as increased public control due to a greater share of non-farming neighbors and their increasing awareness of the negative external effects (e.g. odor nuisance) of farming (Monaco et al., Citation2017). Thus, diversification can be a key strategy of farms situated in urbanized areas to profit from the nearby city and to evade urban pressures on primary production (Wilson, Citation2008; Zasada, Citation2011). Note that farm diversification is often characterized by a combination of multiple diversification activities (Carter, Citation1998; Haugen & Vik, Citation2008; Meraner, Heijman, Kuhlman, & Finger, Citation2015).
Beyond the decision making process at the level of the individual farm, farm diversification in peri-urban areas is considered essential from a societal point of view. For example, it contributes to the maintenance of landscapes, the socio-economic viability of a region and ecological functions, as well as environmentally sustainable forms of the provision of food and other ecosystem services (Clark, Munroe, & Mansfield, Citation2010; Heimlich & Barnard, Citation1992; Zasada, Citation2011). Thus, decisions made by farmers in urban and peri-urban areas are of outmost importance for consumers, inhabitants of urban areas and policymakers (McClintock, Citation2010). More specifically, a better understanding of drivers of farmers’ behavior enables designing more efficient policies supporting intended farm diversification processes. In addition, revealing the processes and driving forces of farm diversification and development allows an incorporation of agriculture in models of socio-spatial relationships in food systems in urban and peri-urban areas.
Early research on farm diversification by Ilbery (Citation1991) identifies extrinsic and intrinsic determinants of farm diversification. Extrinsic determinants include the farms’ location, as well as the institutional setting of the farm. Intrinsic determinants are farmer and farm household characteristics like age, education and household size. We expand these traditional determinants of farm diversification by determinants influencing the farmer’s frame of reference. The farmer’s individual frame of reference can be described as the farmer’s perceptual world establishing her/his own reality on which decisions are based on. It comprises elements such as the farmer’s norms and values, past experiences, the subjective perception of risks and risk preferences (Menapace, Colson, & Raffaelli, Citation2013; Slovic, Fischhoff, & Lichtenstein, Citation1982; van Winsen et al., Citation2014).
This paper fills gaps in the literature in different dimensions. We expand the usually taken focus on a single decision to diversify or not (see e.g. Dries, Pascucci, & Gardebroek, Citation2012; Ilbery, Citation1991; Meraner et al., Citation2015). We use a combination of dichotomous focus on the diversification decisions of farms and the intensity of diversification. This approach reflects that farms usually use combinations of different on-farm non-agricultural diversification strategies (see e.g. Meraner et al., Citation2015). To the authors knowledge, this is a unique approach in the field of on-farm non-agricultural diversification research. In addition, this study is the first to include farmers’ risk perception and risk preferences in combination with data on the farms location to explain diversification choices. Our empirical analysis addresses the ‘Ruhr Metropolis’, Germany’s largest polycentric agglomeration that consists of 53 municipalities (see also Pölling & Mergenthaler, Citation2017).
The remainder of the paper is structured as follows. The next section presents a conceptual model of farm diversification that is the basis for our empirical analysis. This is followed by a description of the data collection and case study area, including a description of all variables used. The fourth section introduces the empirical approach and the fifth section reports the estimation results. The concluding remarks and discussion are presented in the final section.
2 Conceptual model and theoretical background
Peri-urban agriculture. Peri-urban agriculture is defined by Opitz et al. (2016: 353) as ‘small- to large-scale agriculture that cultivates agricultural land predominantly at the fringes of cities. It is first and foremost economically motivated and is operated by professionals with medium to large distribution pathways from direct marketing up to global value chains.’. Urban food systems were marginalized from the perspectives of both cities and agriculture for a long time. Within urbanizing societies, food and nutrition issues are regaining importance in public and scientific discourses (Ernwein, Citation2014). Parallel to the global urban gardening movement of city dwellers with predominantly social but not commercial goals, peri-urban agriculture and regional urban food systems are research topics of increasing interest (Ernwein, Citation2014; Mougeot, Citation2000; van Veenhuizen & Danso, Citation2007; Zasada, Citation2011). Despite urbanization processes and urban encroachments agriculture with its accompanying farmland is still being a considerable land user in urban and peri-urban areas; ‘it is far more than a rural phenomenon’ (Thebo, Drechsel, & Lambin, Citation2014: 1). Thebo et al. (Citation2014) published a global map-based assessment of cropland shares situated in and around cities. Their assessment shows that six per cent of the global cropland is located within cities of at least 50,000 inhabitants. When being added by a circular buffer of 20 km around these cities, 60% of the global irrigated and 35% of the global rain fed croplands are situated within these peri-urban areas. With a view to these figures it can be concluded that the peri-urban transition zone between built-up inner-city areas and their rural hinterlands constitute an area of utmost relevance for agriculture. Typical city-adjustment strategies of peri-urban farms to take advantage of the large consumer potential and to cope with urban constraints are high-value production, product niches, short supply chains, alternative food networks, and non-agricultural diversifications (Aubry & Kebir, Citation2013; Gardner, Citation1994; Heimlich & Barnard, Citation1992; Lange, Piorr, Siebert, & Zasada, Citation2013; Zasada, Citation2011).
Farm diversification. Farm diversification can be defined in various different ways (see Meraner et al., Citation2015 for an overview on different definitions). We consider farms as diversified if farm resources (land, labor or capital) are used on the farm for activities other than production of conventional crops and livestock to generate income e.g. on-farm non-agricultural diversification (Meraner & Finger, Citation2017a). More specifically, we include: i) agritourism activities (gastronomy, accommodation, renting out facilities and recreational activities), ii) the provision of services (social services, land or forest services), iii) equestrian businesses, iv) energy production (solar, wind or biogas energy production), v) processing (plant products or animal products) and vi) direct sales activities (on-farm shop, delivery service, market stand, street stand, vending machine and party-service). The alternative strategy to ‘diversification’ is in the following called ‘no diversification’, i.e. specializing in core agricultural activities rather than diversifying away from it. Specialization can go hand in hand with expansion of the farm business, but can also relate to farm businesses that keep focusing on primary agricultural production. On-farm non-agricultural diversification is often characterized by a combination of multiple diversification activities, hence this study expands the singular decision on farm diversification by an additional decision on the farms diversification intensity (Carter, Citation1998; Haugen & Vik, Citation2008; Meraner et al., Citation2015). In our analysis, diversification intensity is defined as the number of on-farm non-agricultural diversification activities conducted on the farm holding, hence it reflects the heterogeneity of diversification activities on a single farm holding and provides a proxy for the extend of resources allocated to the non-agricultural income activities. However, as the measure of diversification intensity we use is limited to the number of non-agricultural activities performed on the farm, we cannot measure the intensity of the reallocation of farm resources.
Many studies on the farms diversification decision are conceptually based on a farm household model of optimal labor allocation. Built on an expected utility framework, farm households are assumed to maximize their utility over consumption, risk exposure and leisure time subject to time and budget constraints (Meyer, Citation2002; Weltin et al., Citation2017). However, the expected utility framework has been criticized as it fails to describe observed behavior (Kahneman & Tversky, Citation1979; Menapace et al., Citation2013; van Raaij, Citation1981). Hence there is a need to extend the traditional expected utility framework of economic decision making to include intrinsic perceptions, attitude and value settings (Slovic et al., Citation1982; van Raaij, Citation1981). Savage (1972) expands the expected utility framework by adding a subjective component to the expected utility hypothesis (i.e. subjective expected utility (SEU)). SEU theory incorporates i) the decision maker’s subjective beliefs about the probability and impact of an uncertain outcome (i.e. subjective risk perception) as well as ii) the relative risk preferences for uncertain outcomes (i.e. risk preferences) of the decision maker, evaluated via the decision maker’s utility function (Hardaker, 2006). Slovic et al. (Citation1982) refer to the above as the individual’s frame of reference. To understand the decision maker’s economic behavior, an understanding of her or his frame of reference is required because the decision maker’s perceptual world forms the basis for her or his choices. shows the theoretical framework adapted from van Raaij (Citation1981), which is the basis for the investigation of both the decision on diversification and the decision on diversification intensity.
Figure 1. Determinants influencing farmer’s diversification decision adapted from van Raaij (Citation1981).
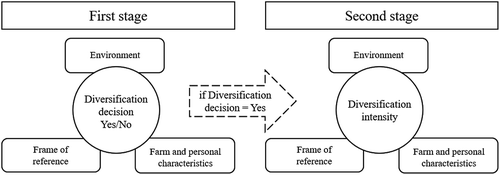
Diversification determinants. Several studies on on-farm diversification have shown the importance of the farm’s environment (e.g. proximity to urban centers, soil quality) on the economic decision making in the peri-urban context (Lovell, Citation2010; Pölling, Mergenthaler, & Lorleberg, Citation2016). Furthermore, observable farm and personal characteristics associated with on-farm non-agricultural diversification include the farm manager’s occupation, farm type, size, the farm manager’s age, education, available family workforce and succession. Besides observable characteristics and the geographical farm environment the farmer’s decision making depends on the personal frame of reference. This includes the perception of risks, farmers’ experiences with high risk situations and farmers’ risk preferences. gives an overview on the expected effects of environmental factors as well as farm and farmer characteristics on the uptake probability of non-agricultural diversification activities.
Table 1. Expected effect on on-farm non-agricultural diversification uptake.
To the authors knowledge there is no research on determinants of diversification intensity. However, we expect that similar determinants as discussed above would drive farmers’ decisions regarding the intensity of diversification activities. We here express the intensity as number of diversification activities used. Yet, we have no prior knowledge on whether the same variables matter for the uptake and intensity decision. Moreover, we have no prior knowledge whether effects have the same sign. We account for that structure in our econometric framework used. Our findings on the influence of environmental factors, farm, farmer and household characteristics on diversification intensity will add to the existing literature on the binary choice to diversify or not by expanding to a diversification portfolio.
3 Data and case study area
3.1 Case study area
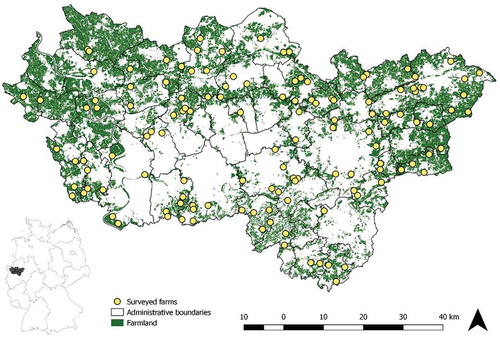
The conducted analysis covers farms located in Germany’s largest polycentric agglomeration ‘Ruhr Metropolis’. The Ruhr metropolitan area covers 53 municipalities with in total more than five million inhabitants. The average population density is above 1100 inhabitants/km2. The core zone of the Ruhr metropolitan area is densely populated and dominated by build-up areas for settlements, industries, and infrastructure, while the land use pattern becomes more heterogeneous outside of the core zone and comprises larger shares of green areas. One third of the Ruhr metropolitan area is used for farming, which is high compared to other agglomerations of the global North (Pölling et al., Citation2016). In monocentric cities, agricultural importance successively increases outwards towards the peri-urban city fringe building the transition zone to more rurally characterized areas. In contrast, farmland is contained even in the Ruhr Metropolis’ core zone due to the polycentric land use pattern. Green corridors situated between the cities’ centers are often dominated by agricultural land uses, although continuous urban encroachments reduce land resources for farming steadily. illustrates the case study area.Footnote2 Agriculture within the Ruhr metropolitan region embraces a variety of business strategies with a stronger relevance of common city-adjustments towards the central zone (Pölling et al., Citation2016). Common adjustments to the urbanized environment are high-value crop production, direct sale arrangements, and the provision of services, especially agro-tourism like equestrian services. While horse keeping is concentrating in the most densely populated center, animal breeding is only of little relevance here, but focusing on the fringe. About seven per cent of the farms market directly, but this proportion is increasing towards the central zone to more than ten per cent.
Figure 2. Map of the Ruhr metropolitan area and the location of farms with available geo data.
3.2 Data and data collection
Primary data were collected from farm managers via a self-administered web survey in spring 2016. We addressed the farm managers in the Ruhr metropolitan area via the regional chamber of agriculture (of the state North Rhine-Westphalia). We contacted all 2368 farm managers registered with the chamber of agriculture which relates to 70% of the total farm population in the area (IT.NRW, Citation2011). Before launching the web survey, we conducted 17 pre-tests with farmers and agricultural students. The first invitation to participate was sent via e-mail in the first week of March 2016; followed by a reminder two weeks later. The overall response rate was 14%, and 50% of all respondents fully completed the survey, leading to a final sample size of 156 farmers. The survey included following parts: (1) general information on the farm (full- or part-time farming, farm type, and diversification activities), (2) information on the farmer’s risk perception and risk preferences, (3) personal demographic information on the farmer and household (age, level of education, succession, household size). Additionally, publicly available geo data was added to the web survey’s primary database. This enabled us to connect the survey information with data on soil fertility.
Descriptions of all variables included in our model are provided in . The farms’ locations, especially the proximity to urban centers, can play a key role in determining farm strategies. In the peri-urban setting of our analysis, the use of usually used metrics such as distances can be misleading because all farms are close to urban centers and access of customers might strongly depend on different aspects (e.g. accessibility). To overcome this limitation, we propose to use farm manager’s self-assessment of the farms location, with respect to the degree of ‘urbaneness’. The self-assessment question ranges from zero (very rural) to 100 (very urban) in steps of one. The self-assessed distance to cities and potential customers, which might also cover relational and temporal proximity apart from spatial proximity, is a comprehensive indicator of the proximity concept.Footnote3 We follow Meraner and Finger (Citation2017a) and Huber, Flury, and Finger (Citation2015) and include the farms’ planned succession on a scale from 1 if succession is sure to −1 if succession is unsure and −2 if farm exit is planned. We chose this scale as a simpler binary variable cannot reflect those farms where succession is not relevant at the point in time we conduct the questionnaire. For instance, if farmers that just took over the business or if the possible successor is still very young. Farmers’ risk perception is measured with two sets of questions related to four main risk sources farmers are exposed to. Based on literature research as well as expert interviews, we included market and price risks, production risks, institutional risks and labor risks (Meuwissen et al., Citation2001; van Winsen et al., Citation2014). Farmers were asked to indicate the importance of each source of risk as well as the severity of the possible impact caused by the risk source using five-point Likert scales respectively (1 = ‘unimportant’ to 5 = ‘very important’ and 1 = ‘no impact’ to 5 = ‘severe impact’). Risk perception scores are calculated as an average over the probability of the occurrence of an uncertain event and the consequential negative impact (Slovic et al., Citation1982). The measure does not capture differences in the individual farms underlying objective risk exposure. However, the choice of measurement was made based on its simplicity and consequential easy understandability. We consider a relatively simple, easy to implement self-assessment task of general risk preferences on an 11-point Likert scale (Dohmen et al., Citation2011, Charness, Gneezy, and Imas, Citation2013).Footnote4
Table 2. Description of variables.
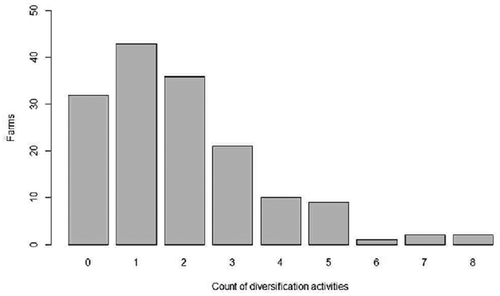
In the further analysis the probability to diversify and the diversification intensity are response variables in a two-step decision process. In the first part of the analysis the dependent variable is defined as a binomial choice between diversification and no diversification. Within our sample, 79% of all farms engage in an on-farm non-agricultural diversification activity, which tends to be higher than in the total population of all Ruhr farms.Footnote5 Generally, the sample’s high share of diversified farms is in line with other studies in European peri-urban areas (see e.g. Zasada et al., Citation2011). For the second part of the analysis, the intensity of diversification is measured as the number of on-farm non-agricultural diversification activities the farm business is engaged in.Footnote6 Farmers could choose from a set of 21 different diversification activities, namely: agritourism activities (gastronomy, accommodation, renting out facilities, recreational activities, other) social services, land or forest services, other services, equestrian business, renewable energy production, biogas production, other energy production, on-farm processing (plant products, animal products), direct marketing (on-farm shop, delivery service, market stand, street stand, vending machine, party-service, other). Intensity of farm diversification ranges in the sample from 1 (28% of all diversified farms) to 8 (1% of all diversified farms) diversification activities, on average the diversification intensity is at 1.917. shows the distribution of on-farm non-agricultural diversification intensity in our sample.
Figure 3. Distribution of on-farm non-agricultural diversification intensity.
Summary statistics are provided in (see for a correlation matrix). Note that the entire dataset is provided in an accompanying data article (Meraner, Pölling, & Finger, Citation2018).Footnote7 We find that, on average, farmers in our sample consider their location to be close to urban hubs. We find that diversified farmers consider their location on average more urban than non-diversified farms, a finding in line with findings of other research in the field (see e.g. Zasada, Citation2011). The sample’s mean soil fertility, as measured in ground points, of 56.1 is slightly above the average in the case study region of 51.3 (Bodenschätzungsgesetz – BodSchätzG, 2007, IT.NRW, Citation2011). Farms exploiting on-farm non-agricultural diversification are larger (on average 60 ha) farmland than their non-diversified counterpart (on average 41 ha). The sample’s share of farms with no off-farm activity (54%) suitably represents the region’s Agricultural Census data for the year 2010 of 52% (IT.NRW, Citation2011). Moreover, the share of high value crop farms in our sample (13%) as well as the share of intensive livestock farms (27%) is in line with Agricultural Census data (IT.NRW, Citation2011) (see ). While 60% of the diversified farms are full-time farms, this ratio reaches only about one third for the non-diversified farms. Furthermore, the Agricultural Census reveals that two thirds of the farms in the region are run by farm managers older than 45 years (IT.NRW, Citation2011). This is in line with our sample, in which the diversified farm managers are slightly younger (49 years) than the non-diversified farm managers (54 years).
Table 3. Summary statistics of explanatory variables.
Farmers in our sample perceive institutional risks to be most severe. This perception is on average higher within the group of non-diversified farmers compared to their diversified colleagues. On average, 61% of all surveyed farmer use extension service consultancy, however diversified farms use consultancy services on average more than non-diversified farms. Furthermore, we find that farmers in our sample are on average risk averse, which is in line with previous findings, e.g. by Meuwissen et al. (Citation2001) and Menapace et al. (Citation2013) as well as other recent surveys in North Rhine-Westphalia (e.g. Meraner & Finger, Citation2017b). Farmers without an on-farm non-agricultural diversification strategy are on average more risk averse than farmers engaging in diversification.
4 Econometric model specification
Reflecting the decision making process with respect to diversification (section 2), we empirically investigate two steps: i) a discrete choice to engage in on-farm diversification activities or not, ii) the choice of intensity (i.e. how many different diversification activities are carried out). We assume that the determinants at both steps do not necessarily have to be identical and equally important. Thus, instead of using, for example, a Tobit model to link these two steps, we use a hurdle model as suggested by Cragg (Citation1971) that allows the possibility that a factor has potentially different effects on the probability of a farm to diversify and the extend of diversification observed. The first step is in the Poisson hurdle model referred to as an equation of participation and the second is referred to as a model of event count that is conditioned on the outcome of the first decision (Greene, Citation2002). Based on these assumptions we define the optimal diversification outcome () as outcome of a utility maximization problem of the i-th farmer that can be described as a function of farm, farmer and environmental characteristics (Xi). The first step can be modeled as a binary choice of the farmer to diversify or not. This implies that each farmer chooses to diversify or not to diversify depending on the observed characteristics Xi. Hence the probability that the farm is diversified is given by:
Where ,
is the vector of estimated coefficients associated with the diversification decision and
is the error term. The first hurdle, estimating determinants for the farmers decision to diversify or not, was modeled using a binary probit model. The diversified farmer’s decision on how many activities to engage in can be modeled as a truncated count model with possible outcomes
ranging from minimum 1 to a maximum of K diversification activities. We assume again an underlying unobservable utility function (
) of the i-th farmer as a linear function of farm, farmer and geographical characteristics (
):
Where ,
is the vector to be estimated,
is the unobservable error term.
Error terms are assumed to be normal and independently distributed: . In order to justify these assumptions, allowing the estimation using a joint likelihood function as specified by Cragg (Citation1971), the model is tested against a specification that allows for a correlation between error terms using Vuong test (Vuong, Citation1989). Based on this test, the hypothesis that the presented hurdle model is superior could not be rejected. To estimate equations 1 and 2, we have chosen a hurdle model. It was chosen in favor of alternative models dealing with excess zeros (e.g. zero-inflated count model or Heckman model), because the nature of zeros (no diversification) is unlikely due to sampling, but represents an alternative farm management strategy. Furthermore, contrary to the alternative Tobit model, the hurdle model acknowledges that the decision to diversify and diversification intensity are determined by different processes (Ricker-Gilbert, Jayne, & Chirwa, Citation2011). This is plausible for the analysis, since factors such as risk preference affect the choice to diversify possibly different than the choice of diversification intensity. Likelihood ratio (LR) was used in χ2 tests to compare the Poisson model to the alternative negative binomial regression Model (Long, Citation1997; Zeileis, Kleiber, & Jackman, Citation2008). In addition, we checked for multicollinearity by calculating variance inflation factors,Footnote8 in addition Appendix A1 in the Appendix includes Sperman correlation coefficients for all model variables. The empirical analysis is conducted using the statistical software R (packages plyr, psych, mhurdle and lmtest are used) (R Core Team, Citation2016). All codes are available in an online Appendix.
5 Results and discussion
The results from the hurdle analysis are presented in . We find a statistically significant influence of the farms’ location on the diversification decision and diversification intensity. More specifically, soil quality influences the uptake probability of on-farm non-agricultural diversification and the farms’ proximity to an urban hub influences the farms’ diversification intensity. In other words, farms with less productive soils are more likely to choose on-farm non-agricultural diversification activities. This is in line with previous findings by for example Pfeifer, Jongeneel, Sonneveld, and Stoorvogel (Citation2009) who claim that farmers with less productive soils are in greater need of an extra source of income and are hence more likely to diversify. In addition, we find that diversification intensity is larger amongst farms that self-evaluate their location to be more urban. These farms are more likely to take advantage of the farms proximity to the city and engage in a larger portfolio of diversification activities. This in turn could point towards synergetic effects of those diversification activities performed by farmers that are located closer to urban areas (e.g. direct marketing and agritourism). However, the first step into diversification is not influenced by the proximity to urban hubs, here other factors seem to play a bigger role and necessity (driven by e.g. poor soil quality and resulting additional income needs) is more important than opportunity (driven by a large close by demand group). Similarly, farms producing high value crops such as horticulture or permanent crops are found to be more likely to engage in a larger portfolio of different diversification activities. These farm types are more likely to exploit the advantages of short supply chains, direct marketing opportunities and the increased environmental awareness of consumers regarding agricultural production in peri-urban areas (Aubry & Kebir, Citation2013; Kneafsey, Citation2010; Zasada et al., Citation2011). Additionally, farms producing high value crops with a higher probability to engage in on-farm sale activities are often combining them with gastronomy and other agritourism activities (Haugen & Vik, Citation2008; Meraner et al., Citation2015). In addition, diversification intensity is greater amongst farmers using extension service consultancy. Hence, we find evidence that a good support system and targeted information on diversification can increase diversification intensity. The regional Chamber of Agriculture North Rhine-Westphalia is offering targeted advisory services for farmers within the case study, who are willing to diversify or extent diversification. These diversification services are pooled in the chamber’s department ‘Landservice’. In line with previous research by McNamara and Weiss (Citation2005) and Barbieri and Mahoney (Citation2009), we find that with the increasing age of the main farm operator, the uptake probability of on-farm non-agricultural diversification activities decreases. Younger farmers are found to strengthen the farm business viability and shift excess labor, land and capital to on-farm diversification ventures. Older farmers on the other hand are more likely to stick to what they know or have other priorities where resources are needed (e.g. building a family or retirement). This is additionally supported by the positive effect of succession on the diversification decision. Thus, our findings support Potter and Lobley (Citation1996) life cycle theory, arguing that a successor in place motivates the farm family to build long term stability of the farm business and creating additional income for the next generation’s family. Contrarily the farmers’ age has a, although significant only at the 10% level, positive effect on diversification intensity. This could indicate that once farmer have started with one diversification activity at a young age they are more likely to expand their diversification portfolio over their lifetime and have more activities the older they get. We find that farmers with a higher level of education are less likely to start with a diversification activity. For those farmer’s opportunity costs for engaging in on-farm diversification activities are high, hence they might rather search for extra income off-farm.
Table 4. Estimation results for the double hurdle model.
Besides observable characteristics and the farms environment, we included elements of farmers’ personal frame of reference (i.e. risk perception and risk aversion). We find that the perception of risk influences the diversification intensity. Farmers’ perceiving institutional risks to be high choose smaller diversification portfolios. Many on-farm non-agricultural diversification activities are strongly depending on institutional circumstances (e.g. support for energy production using renewable sources, regulation of non-farm activities in agricultural zones), hence they are associated with higher institutional risk. Farmers who started with such an activity and who perceive institutional risks to be high might be hampered to engage in larger diversification portfolios. When analyzing the effect of high labor risk perception on the diversification intensity among farmers that have chosen to diversify, we find that high labor risk perception has a positive effect on diversification intensity. Most on-farm diversification strategies are labor intensive activities, often requiring additional hired labor, which is increasing the objective risk farms are exposed to. Our finding confirms that farms with a larger diversification portfolio also perceive risks stemming from the additional workforce employed at the farm to be higher. More risk averse farmers are found to be less likely to engage in on-farm non-agricultural diversification. This is in line with findings by Meraner and Finger (Citation2017a) who argue that very risk averse farmers choose risk management strategies related to agricultural production (e.g. diversification of agricultural activities) over on-farm non-agricultural diversification. Overall we find that risk aversion hampers the uptake of diversification activities and the size of the portfolio of diversification activities is influenced by the specific risk perception. Hence it is important to disentangle the decision process and include different elements of the farmers frame of reference.
6 Conclusion
We developed an econometric hurdle model that explains determinants firstly, of the discrete choice of adoption or non-adoption of a diversification activity and secondly, of the intensity of diversification, measured as a count of adopted on-farm non-agricultural diversification activities in the Ruhr metropolitan area.
Explaining farm diversification is particularly relevant in urban and peri-urban settings where the interrelation with non-farming actors is particularly large and thus determines farmers’ decision making process and farm structures. Our sample shows a high share of 79% of farms that are diversified. Yet, we find the diversification portfolio on average to be rather small, ranging from 1 (28% of all diversified farms) to 8 (1% of all diversified farms) diversification activities, while on average the diversification intensity is at 1.917. Thus possible synergies even though imaginable between a lot of different activities e.g. gastronomy and tourism seem to be present at some but not all farms. Despite the limitations of the sample procedure and sample’s high share of diversified farms in this study, the detected determinants provide valuable information for currently non-consumer-oriented farms to make use of market opportunities and support upscaling. Furthermore, our results are leading to the conclusion that policies, aiming at promoting farm diversification should account better for, the particular circumstances of farmers in peri-urban areas. The proximity to a large population with a demand for agricultural products and recreational areas is leading farmers to increasingly diversify in this areas, however they also face larger opportunity costs and social pressures making regular farming increasingly difficult. Policies should therefore be tailored to account for the special role of these farming systems, with respect to, but also beyond diversification decisions. However, our results should not be transferred one to one to the Ruhr Metropolis’ total population. Specific local conditions, such as land use patterns, as well as socioeconomic and sociocultural environments, go beyond the scope of this paper and highlight further research demand. In addition, policy maker need to acknowledge that diversified farms still need land to operate their business, hence farm diversification is no way out of the increasing pressure on land in and near urban centers. We use an econometric model to investigate the diversification decision and diversification intensity simultaneously, allowing for differences in the direction of the estimated effects. With this approach we could find differences in the effects of the farmers age, planned succession and perceived labor risk on diversification and diversification intensity.
Although market opportunities are essential if farmers are to diversify, this paper shows that not all farms are in a similar position to take advantage of existing opportunities. Our results lead to the conclusion that intensive livestock farms, are currently not sufficiently reached by policies supporting on-farm non-agricultural diversification activities. Policy makers aiming at supporting on-farm non-agricultural diversification should account better for the diverse resources of different farming types. In addition, we find that farms that use extension services have an increased likelihood to diversify, hence farmers could benefit from a greater support and information network through extension service consultancy. Currently the agricultural chamber’s department ‘Landservice’ is covering information and support on diversification activities for all farmers in the region. However, this service could be improved by tailoring it to the special needs of urban farmers. Like in the French region Ile-de-France where the regional Chamber of Agriculture hired specialists for diversification activities in general and more precisely for short supply food chains (Aubry & Kebir, Citation2013). In addition, a better organization of consultancy services on a regional level but also combining different regions with similar structural characteristics such as the Ruhr metropolitan region could be beneficiary to the farmers in the region.
In addition, we show that the frame of reference is important when analyzing the farmer’s diversification decision and intensity. We find that risk preferences determine diversification decisions. More specifically, risk averse farmers are less likely to engage in on-farm non-agricultural diversification activities but rather tend towards specialization strategies. We find that risk aversion effects the diversification decision negatively and risk perception affects the choice of diversification intensity. Hence it is important to disentangle the decision making process as we did in this study. However, we only include risk perception and risk preferences as components of the farmers’ frame of reference in our study. We could not elicit the farmers’ norms values and beliefs in this experimental setting hence further research is needed expanding he elements of the farmers’ frame of reference. This will help further explain the complex decision making process of on-farm risk management strategies. Our finding that risk perception acts as important driver of the diversification intensity reveals that increasing climatic and market risks coupled with an increasing likelihood of the occurrence of extreme events (e.g. due to climate change and increasing liberalization of markets) might contribute to further diversification of farms. This might create lock-in situations (e.g. Ding, Schoengold, & Tadesse, Citation2009), as the uptake of diversification often implies large and irreversible investments. We expressed diversification intensity by counting the diversification activities and alternative definitions of such intensity should account for differences of required resources, i.e. the depth of each activity. In addition, there are intrinsic motives underlying the diversification decision that could not be modeled in our approach (e.g. taste, personal preference to invite people to the farm etc.) but should be considered in future research. The uptake of diversification activities could be a first step into the leave of the agricultural sector, with possibly major implications for the provision of food and other ecosystem services from the agricultural sector (e.g. Mishra, Fannin, & Joo, Citation2014). Along these lines, the analysis of entry and exit into specific diversification activities, as well as the interrelation with off-farm risk allocation of resources should be conducted. Furthermore, farmer’s diversification decision should be analyzed using a longer run horizon making use of panel data in future research.
Acknowledgments
We thank the Chamber of Agriculture North Rhine-Westphalia for support with the survey.
Disclosure statement
No potential conflict of interest was reported by the authors.
Notes
1. The included diversification activities are: agritourism activities (gastronomy, accommodation, renting out facilities, recreational activities, other) social services, land or forest services, other services, equestrian business, renewable energy production, biogas production, other energy production, on-farm processing (plant products, animal products), direct marketing (on-farm shop, delivery service, market stand, street stand, vending machine, party-service, other).
2. Furthermore, the location of 132 surveyed farms is depicted. For 24 surveyed farmers no match with the farms exact location was possible.
3. The self-assessment measurement of proximity to urban center is positively correlated (at a 10% level of significance) with the objective distance of the farm to the nearest agglomeration larger than 100,000 inhabitants.
4. We also tested our model including results from a lottery task to elicit risk preferences, however did not get significant results. All results are available from the authors upon request.
5. Education levels are: 1 = no degree, 2 = secondary school certificate (9 years), 3 = secondary school certificate (11 years), 4 = advanced technical college certificate, 5 = high school diploma, 6 = completed vocational training, 7 = certified manager, 8 = certified agriculturist and 9 = masters certificate in agriculture.
6. The choice of other measures to approximate diversification intensity such as a diversification index over the shares of income from different income sources was also considered (see e.g. El Benni, Finger & Meuwissen, Citation2016). However, we experienced that assigning income shares to single activities was difficult or impossible for farmers in an online survey.
7. The data set was used partially in a study by Pölling et al. (Citation2017).
8. The calculated variance inflation factors are below 2 for all of the included variables in our model.
References
- Assefa, T.T., Meuwissen, M.P.M., & Oude Lansink, A.G.J.M. (2016). Price risk perceptions and management strategies in selected European food supply chains: An exploratory approach. NJAS-Wageningen Journal of Life Sciences, 15–26. doi:10.1016/j.njas.2016.11.002
- Aubry, C., & Kebir, L. (2013). Shortening food supply chains: A means for maintaining agriculture close to urban areas? The case of the French metropolitan area of Paris. Food Policy, 41, 85–93.
- Barbieri, C., & Mahoney, E. (2009). Why is diversification an attractive farm adjustment strategy? insights from texas farmers and ranchers. Journal of Rural Studies, 25, 58–66.
- Bodenschätzungsgesetz -BodSchätzG. (2007). Gesetz zur Schätzung des landwirtschaftlichen Kulturbodens. l. I S. 3150, 3176. Ed., Berlin, Germany: Bundestag der Bundesrepublik Deutschland.
- Carter, S. (1998). Portfolio entrepreneurship in the farm sector: Indigenous growth in rural areas? Entrepreneurship & Regional Development, 10(1), 17–32.
- Charness, G, Gneezy, U, & Imas, A. (2013). Experimental methods: eliciting risk preferences. Journal Of Economic Behavior & Organization, 87, 43-51. doi:
- Clark, J.K., Munroe, D.K., & Mansfield, B. (2010). What counts as farming: How classification limits regionalization of the food system. Cambridge Journal of Regions, Economy and Society, 3(2), 245–259.
- Core Team, R. 2016. “R: A language and environment for statistical computing.” Retrieved from http://www.R-project.org/.
- Cragg, J.G. (1971). Some statistical models for limited dependent variables with application to the demand for durable goods. Econometrica: Journal of the Econometric Society, 39(5), 829–844.
- Ding, Y., Schoengold, K., & Tadesse, T. (2009). The impact of weather extremes on agricultural production methods: Does drought increase adoption of conservation tillage practices? Journal of Agricultural and Resource Economics, 34(3):395–411.
- Dohmen, T., Falk, A., Huffman, D., Sunde, U., Schupp, J., & Wagner, G.G. (2011). Individual risk attitudes: Measurement, determinants, and behavioral consequences. Journal of the European Economic Association, 9(3), 522–550.
- Dries, L., Pascucci, S., & Gardebroek, C. (2012). Diversification in Italian farm systems: Are farmers using interlinked strategies? New Medit, 11(4), 7–15.
- El Benni, N., Finger, R., & Meuwissen, M. (2016). Potential effects of the Income Stabilization Tool (IST) in swiss agriculture. European Review of Agricultural Economics, 43, 475–502.
- Ernwein, M. (2014). Framing urban gardening and agriculture: On space, scale and the public. Geoforum, 56, 77–86.
- European Parliamentary Research Service. (2016). Farm diversification in the EU. In European Parliament: Briefing. Brussels, Belgium.
- Finger, R. (2016). Assessment of uncertain returns from investment in short rotation coppice using risk adjusted discount rates. Biomass and Bioenergy, 85, 320–326.
- Gardner, B.L. (1994). Commercial agriculture in metropolitan areas: Economics and regulatory issues. Agricultural and Resource Economics Review, 23(1), 100–109.
- Greene, W.H. (2002). Econometric analysis. (5 ed). Upper Saddle River USA: Pearson Education, Inc.
- Haugen, M.S., & Vik, J. (2008). Farmers as entrepreneurs: The case of farm-based tourism. International Journal of Entrepreneurship and Small Business, 6(3), 321–336.
- Heimlich, R.E., & Barnard, C.H. (1992). Agricultural adaptation to urbanization: Farm types in northeast metropolitan areas. Northeastern Journal of Agricultural and Resource Economics, 21(1), 50–60.
- Huber, R., Flury, C., & Finger, R. (2015). Factors affecting farm growth intentions of family farms in mountain regions: Empirical evidence for Central Switzerland. Land Use Policy, 47, 188–197.
- Ilbery, B.W. (1991). Farm diversification as an adjustment strategy on the urban fringe of the West Midlands. Journal of Rural Studies, 7(3), 207–218.
- IT.NRW. 2011. “Agricultural Census Data 2010.” Landesbetrieb Information und Technik Nordrhein-Westfalen Retrieved January 31, 2016, from. https://www.landesdatenbank.nrw.de/ldbnrw/online.
- Jarosz, L. (2008). The city in the country: Growing alternative food networks in Metropolitan areas. Journal of Rural Studies, 24(3), 231–244.
- Kahneman, D., & Tversky, A. (1979). Prospect theory: An analysis of decision under risk. Econometrica: Journal of the Econometric Society, 263–291. doi:10.2307/1914185
- Kneafsey, M. (2010). The region in food—Important or irrelevant? Cambridge Journal of Regions, Economy and Society, 3(2), 177–190.
- Knickel, K., Brunori, G., Rand, S., & Proost, J. (2009). Towards a better conceptual framework for innovation processes in agriculture and rural development: From linear models to systemic approaches. Journal of Agricultural Education and Extension, 15(2), 131–146.
- Knight, J., Weir, S., & Woldehanna, T. (2010). The role of education in facilitating risk-taking and innovation in agriculture. The Journal of Development Studies, 39(6), 1–22.
- Lange, A., Piorr, A., Siebert, R., & Zasada, I. (2013). Spatial differentiation of farm diversification: How rural attractiveness and vicinity to cities determine farm households’ response to the CAP. Land Use Policy, 31, 136–144.
- Long, S.J. (1997). Regression models for categorical and limited dependent variables. Vol. 7, Advanced quantitative techniques in the social sciences. Thousand Oaks, USA: SAGE Publications Inc.
- Lovell, S.T. (2010). Multifunctional urban agriculture for sustainable land use planning in the United States. Sustainability, 2(8), 2499–2522.
- McClintock, N. (2010). Why farm the city? Theorizing urban agriculture through a lens of metabolic rift. Cambridge Journal of Regions, Economy and Society, 3(2), 191–207.
- McNally, S. (2001). Farm diversification in England and Wales — What can we learn from the farm business survey? Journal of Rural Studies, 17(2), 247–257.
- McNamara, K.T., & Weiss, C. (2005). Farm household income and On-and Off-farm Diversification. Journal of Agricultural and Applied Economics, 37(1), 37–48.
- Menapace, L., Colson, G., & Raffaelli, R. (2013). Risk aversion, subjective beliefs, and farmer risk management strategies. American Journal of Agricultural Economics, 95(2), 384–389.
- Meraner, M., & Finger, R. (2017a). Risk perceptions, preferences and management strategies: Evidence from a case study using German livestock farmers. Journal of Risk Research, 1–26. doi:10.1080/13669877.2017.1351476
- Meraner, M., & Finger, R. (2017b). Data on German Farmers Risk Preference, Risk Perception and Risk Management Strategies Data in Brief, 15, 102–105.
- Meraner, M., Heijman, W., Kuhlman, T., & Finger, R. (2015). Determinants of farm diversification in the Netherlands. Land Use Policy, 42, 767–780.
- Meraner, M., Pölling, B., & Finger, R. (2018). Data on farm diversification decisions and farmers’ risk preferences in the Ruhr Metropolitan region (Germany). Data in Brief, 18, 9–12.
- Meuwissen, M.P.M., Huirne, R.B.M., & Hardaker, B.J. (2001). Risk and risk management: An empirical analysis of Dutch livestock farmers. Livestock Production Science, 69(1), 43–53.
- Meyer, J. (2002). Expected utility as a paradigm for decision making in agriculture. In R.E. Just & R.D. Pope (Eds.), AComprehensive assessment of the role of risk in U.S. agriculture (pp. 3–19). Boston USA: Springer US.
- Mishra, A.K., El‐Osta, H.S., & Sandretto, C.L. (2004). Factors affecting farm enterprise diversification. Agricultural Finance Review, 64(2), 151–166.
- Mishra, A.K., Fannin, M.J., & Joo, H. (2014). Off-farm work, intensity of government payments, and farm exits: Evidence from a National Survey in the United States. Canadian Journal of Agricultural Economics/Revue Canadienne D’agroeconomie, 62(2), 283–306.
- Monaco, F., Zasada, I., Wascher, D., Glavan, M., Pintar, M., Schmutz, U., … Sali, G. (2017). Food production and consumption: City regions between localism, agricultural land displacement, and economic competitiveness. Sustainability, 9(1), 96.
- Mougeot, L.J.A. 2000. Urban agriculture: definition, presence, potentials and risks, and policy challenges. Cities Feeding People Series Report 31. International Development Research Centre (IDCR). Retrieved from https://idl-bnc.idrc.ca/dspace/bitstream/10625/26429/12/117785.pdf.
- Pfeifer, C., Jongeneel, R.A., Sonneveld, M.P.W., & Stoorvogel, J.J. (2009). Landscape properties as drivers for farm diversification: A Dutch case study. Land Use Policy, 26(4), 1106–1115.
- Pölling, B., & Mergenthaler, M. (2017). The location matters: Determinants for “Deepening” and “Broadening” diversification strategies in ruhr metropolis’ urban farming. Sustainability, 9(7), 1168.
- Pölling, B., Mergenthaler, M., & Lorleberg, W. (2016). Professional urban agriculture and its characteristic business models in Metropolis Ruhr, Germany. Land Use Policy, 58, 366–379.
- Pölling, B., Sroka, W., & Mergenthaler, M. (2017). Success of urban farming’s city-adjustments and business models – Findings from a survey among farmers in Ruhr Metropolis, Germany. Land Use Policy, 69, 372–385.
- Potter, C., & Lobley, M. (1996). The farm family life cycle, succession paths and environmental change in Britain’s countryside. Journal of Agricultural Economics, 47(1–4), 172–190.
- Ricker-Gilbert, J., Jayne, T.S., & Chirwa, E. (2011). Subsidies and crowding out: A double-hurdle model of fertilizer demand in Malawi. American Journal of Agricultural Economics, 93(1), 26–42.
- Slovic, P., Fischhoff, B., & Lichtenstein, S. (1982). Why study risk perception? Risk Analysis, 2(2), 83–93.
- Thebo, A.L., Drechsel, P., & Lambin, E. (2014). Global assessment of urban and peri-urban agriculture: Irrigated and rainfed croplands. Environmental Research Letters, 9(11), 1–9.
- van Raaij, F.W. (1981). Economic psychology. Journal of Economic Psychology, 1(1), 1–24.
- van Veenhuizen, R., & Danso, G. 2007. Profitability and sustainability of urban and peri-urban agriculture.FAO, Agricultural Management, Marketing and Finance Occasional Paper 19. Rome.
- van Winsen, F., de Mey, Y., Lauwers, L., van Passel, S., Vancauteren, M., & Wauters, E. (2014). Determinants of risk behaviour: Effects of perceived risks and risk attitude on farmer’s adoption of risk management strategies. Journal of Risk Research, 19(1), 56–78.
- Vuong, Q.H. (1989). Likelihood ratio tests for model selection and non-nested hypotheses. Econometrica: Journal of the Econometric Society 57(2), 307–333.
- Weltin, M., Zasada, I., Franke, C., Piorr, A., Raggi, M., & Viaggi, D. (2017). Analysingbehavioural differences of farm households: An example of income diversification strategies based on European farm survey data.”. Land Use Policy, 62, 172–184.
- Wilson, G.A. (2008). From ‘weak’ to ‘strong’ multifunctionality: Conceptualising farm-level multifunctional transitional pathways. Journal of Rural Studies, 3, 367–383.
- Zasada, I. (2011). Multifunctional peri-urban agriculture - A review of societal demands and the provision of goods and services by farming. Land Use Policy, 28(4), 639–648.
- Zasada, I., Berges, R., Hilgendorf, J., & Piorr, A. (2013). Horsekeeping and the peri-urban development in the Berlin Metropolitan Region. Journal of Land Use Science, 8(2), 199–214.
- Zasada, I., Fertner, C., Piorr, A., & Nielsen, T.S. (2011). Peri-urbanisation and multifunctional adaptation of agriculture around Copenhagen. Geografisk Tidsskrift-Danish Journal of Geography, 111(1), 59–72.
- Zeileis, A., Kleiber, C., & Jackman, S. (2008). Regression models for count data in R. Journal of Statistical Software, 27(8), 1–25.
Appendix
Appendix A1. Spearman Correlation coefficients of included variables.