
ABSTRACT
This paper sought to determine how different forest management regimes influence the pattern of forest degradation at different periods in Ghana. The paper tested the hypotheses that timber production forests degrade faster than protection forests and forest degradation slows down with time. For monitoring the changes in forest cover, Landsat TM, ETM+ and Landsat 8 with a spatial resolution of 30 m were used in the mapping of land use/land cover for the periods 1990, 2000, 2010 and 2014 using supervised classification technique. The results showed that forest degradation occurred at different rates within the period and was more rapid from 1990 to 2000 than from 2000 to 2010. Protected forests and Globally Significant Biodiversity Areas (GSBAs) declined in forest quality at the same rate as timber production forests and did not benefit from any extra protective measures. New strategies should be found to manage protection forests and GSBAs to ensure their optimum protection.
1. Introduction
Globally, increasing human population together with its attendant increasing developmental needs has resulted in a high rate of change of forests (Li, Carlson, & Lacis, Citation2013; Morris, Citation2010). This phenomenon is more pronounced in developing countries where most of the world’s tropical forest ecosystems exist (Brown, Seymour, & Peskett, Citation2008; Contreras-Hermosilla, Citation2002). Conservation and careful management of tropical forests, however, are very critical to ensure the sustainability of their resources and enhancement of their health (Addo-Fordjour & Ankomah, Citation2017). Consequently, worldwide, countries have adopted various strategies as a measure to curtail deforestation and forest degradation; and to manage and conserve tropical forests in response to human disturbance.
In Ghana, one of such strategies was to demarcate portions of forestlands for permanent reservation in order to provide better protection, conservation and management of forest resources on a sustainable basis. The idea of permanent reservation could be linked to a way of sparing some forest areas as the country goes through its own development phases, within the context of forest transitions (FT). FT theory relies on historical case studies and observes that forest resources tend to be abundant and healthy prior to economic development, but diminish and degrade as development proceeds, and then re-emerge in high-income countries (Mather & Fairbairn, Citation2000; Rudel, Citation1998). According to Mather (Citation1990), FT hypothesis predicts that there is a universal pattern in the forest cover change, and forest resources have four sequentially identifiable stages that add up to a forest transition (1) initially high forest cover and low deforestation, (2) accelerating and high deforestation, (3) slow-down of deforestation and forest cover stabilization, and (4) a period of reforestation. FT claims that forest cover eventually will be partly restored through either natural re-growth or plantations or both.
The forest reserves (FRs) and protected areas (PAs) have been put into different management regimes or working circles based on site characteristics, and are named to reflect management objectives. These working circles are generally grouped as protection, production or selection and conversion working circles and have different strategies or principles of management enlisted in forest management plans, geared towards ensuring sustainable forest and wildlife management. A forest reserve can have different working circles in it.
The permanent protection areas occupy 352,500 ha (21% of forest reserve area) and consist largely of hill sanctuaries, swamp sanctuaries, shelterbelts, intact forest sanctuaries and fire protection areas. Of this area, 69% is inaccessible for logging (except at very high cost), 16% is degraded whilst only 15% (which is protected on grounds of genetic diversity) is well stocked and accessible. As part of the protection area network, biodiversity hotspots have been given special biological protection and removed from all forms of human disturbances, and are designated as Globally Significant Biodiversity Areas (GSBAs) (Kyereh, Citation2007). Production circles or regimes cover an area of 742,600 ha representing 47% of forest reserve area and are areas rich in timber. These areas are to be logged in a sustainable manner using selective logging practices and in line with Ghana’s Manuals of Forest Harvesting Procedures (Forestry Services Division, Citation1998). This regime includes convalescence areas which cover 122,000 ha, and account for 7% of forest production reserve. These are forests temporarily withdrawn from logging due to reduced stocking but are considered capable of recovery within one felling cycle (40 years). The conversion working circle is a management category for areas where unhealthy and highly degraded portions of reserves are converted into plantations. This working circle covers 127,200 ha and accounts for about 8% of forest reserve area (Kotey et al., Citation1998). The manual of procedure (MoP) for the management of forest resources in the high forest zone of Ghana prescribes that GSBAs and Protection regimes should be managed for environmental protection and biological diversity hence no human activities that cause forest disturbance are permitted, unlike the other management regimes (Forestry Services Division, Citation1998).
To complement the efforts of the management regimes in safeguarding the country’s forest estates from deforestation and forest degradation, a number of interventions have been pursued over the years. These interventions included policy and legislative reforms which saw the 40-year felling cycle in forest reserves replaced the 15-year cycle implemented from 1971 (Baidoe, Citation1970; Parren & De Graaf, Citation1995). In addition, in 1994, a new framework for forest protection known as “coarse-grained “and ‘fine-grained’ protection was introduced for the forest reserves (FIMP, Citation1994; Hawthorne & Abu-Juam, Citation1995). This prohibited logging along watercourses, on steep slopes, in swamps, hilly areas and capped the number of trees to be logged per hectare, depending on the ecological zone (Planning Branch, Citation1995). There was also the 1998 Timber Resources Management Regulations that banned chainsaw milling for commercial purposes (TRMR, Citation1998). Ghana again implemented the wildfire management program to reduce the incidence of wildfires in the country’s forest reserves through participatory forest management interventions (Ministry of Lands Forestry and Mines (MLFM), Citation2006). Furthermore, Ghana signed and ratified the EU FLEGT and the Voluntary Partnership Agreement (VPA) in 2009 to improve on forest governance and to place on the EU market only legal wood as a way to eliminate illegal logging (Beeko & Arts, Citation2010). Ghana has been involved in other initiatives and programs such as the REDD+ and the Forest Investment Program (FIP) (Ghana REDD+ Strategy. (GRPS), Citation2016), which aimed at reducing GHG emissions from deforestation and forest degradation while reducing poverty and conserving biodiversity. These interventions included institutional strengthening, field and community-based investments to improve forest and landscape management, capacity building, awareness creation, the establishment of a law enforcement unit to address illegal logging activities, the implementation of a stricter wood procurement policy, and consultation with stakeholders in resource management (Oduro, Mohren, Affum-Baffoe, & Kyereh, Citation2014). In spite of these strategies and interventions, there are indications that a number of illegal activities occur in many forest reserves (Addo-Fordjour & Ankomah, Citation2017; Addo-Fordjour, Rahmad, Amui, Pinto, & Dwomoh, Citation2013; Kyereh, Citation2007), resulting in forest degradation and deforestation. However, while information on deforestation in Ghana is well captured (Food and Agriculture Organization, Citation2010; Ministry of Lands and Natural Resources, Citation2011; National REDD+ Secretariat, Citation2017), that of forest degradation is scant and non-specific.
There is also little information on how forest cover loss differs among various forest management regimes and specific time periods and whether forest recovery is enhanced in certain regimes than in others. Under normal circumstances, it is expected that the rate of change in forest cover within a protection or GSBA, for example, should be slower than the changes occurring in the production zones, reasons being that protection areas and GSBAs should have limited human activities. However, the situation is likely to be more complicated than that since forest loss is often a result of changing socio-economic conditions, human values and behaviours (Bare, Kauffman, & Miller, Citation2015; Geist & Lambin, Citation2002). Awuah (Citation2015), observed that not only are local people’s forest rights occasioned by forest management regimes but their knowledge of the rights is also influenced to a large extent by the regime type. This suggests that forest management regimes exercise some complexities on forest fringe communities and perhaps on the outcome of forest management efforts as well.
An important question that remains unanswered is whether protective regimes offer better protection from deforestation and degradation than the productive regime and if the rate of forest degradation is slowing down or increasing with time. The way forest management regimes and passage of time influence trends and patterns in forest cover loss is very important because it can provide an in-depth understanding of the dynamics of forest cover loss in Ghana and call to question the strategies underlying these management regimes so as to develop appropriate strategies tailored at addressing forest quality decline in the country.
The study, therefore, sought to determine the association between forest management regimes and the pattern of forest degradation in different time periods in Ghana. The paper tested the hypotheses that timber production forests degrade faster than protection forests and forest degradation slows down with time.
2. Materials and methods
2.1 Study areas
Ghana currently has established 216 forest reserves and 21 wildlife protected reserves covering a total area of 28,302 km2 and 14,403 km2 respectively in the high forest zone (HFZ) (Ministry of Lands and Natural Resources, Citation2011). The study was conducted in four forest reserves located within four ecological zones in Ghana, namely Fure River (Wet Evergreen) (WE), Bia North Tributaries (Moist Semi-deciduous North West) (MSNW), and Tano Offin (Upland Evergreen) (UE). These three reserves are managed by the Forest Services Division (FSD), whilst the fourth reserve Bia South Tributaries (Moist Evergreen) (ME), is managed by Wildlife Division (WD) as a wildlife reserve as shown in . Further information on the various management regimes is provided in .
Table 1. Forest reserves and their associated management regimes.
Figure 1. Map of Ghana showing the study area in shewn edge green.
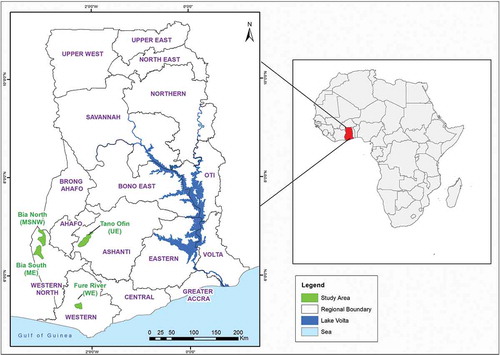
The study forest reserves (FRs) were demarcated and put under gazette between 1936 and 1940 and have since been managed as part of the forest and wildlife reserve network of the country. These FRs were selected because they possess multiple regimes thus making comparisons at the regime level simple, by avoiding the need to take account of differences in biophysical factors between regimes being compared.
2.2 Data collection
2.2.1 Determination of forest cover changes in the forest reserves
The monitoring of changes in the forest reserves was done by analysing land use/land cover for epochs 1990, 2000, 2010 and 2014. The year 1990 was chosen as the base year because Ghana had then completed a comprehensive forest inventory project between 1986–1989, in forest reserves within its high forest zone (HFZ). The results of this inventory had provided the basis for managing individual forest reserves and had provided static estimates of all commercial species in the timber production forest reserves within the country based on which the interim yield formula, minimum felling diameters and manual of procedures for managing forest reserves in Ghana were developed. General reports on the state of Ghana’s forest at the time also pointed to a good forest condition (Ghartey, Citation1992), and that Ghana was trying different strategies on how to either maintain or improve the integrity of its forest so it was considered appropriate to start monitoring changes in forest cover from that period.
2.2.1.1 Image pre-processing
Landsat TM, ETM+ and Landsat 8 with a spatial resolution of 30 m were used in the mapping of land use/land cover in the study. These datasets were downloaded from USGS Earth Resources Observation Systems Data Centre (earthexplorer.usgs.gov). Seasonal variation usually affects image selection because of dense cloud cover and the high amount of atmospheric water vapour occurring during the rainy season (Liu, Wu, Niu, & Wang, Citation2015; Senf, Pflugmacher, Wulder, & Hostert, Citation2015). These in most cases prevent the usage of wet season images since they create gaps in the classification maps, even though wet season images are often preferred as they represent the peak of the growing season with well-developed vegetation cover (greenness) (Liu et al., Citation2015; Zhu & Liu, Citation2014). Conversely, dry season (December to March) imagery is usually cloud-free and offers better contrast between senescing herbaceous vegetation and evergreen trees (Boggs, Citation2010; Luca, Domini, & Caudek, Citation2004). In Ghana, like many other tropical countries, there is clear distinction among the dry and wet season and cloud-free images are usually available from the dry season. The dates for each acquisition were chosen to be as close as possible in the same season. Images from the dry season were selected to reduce the impacts of seasonality on the forest change analysis to the extent possible. There was a maximum of 3 months’ difference (December to February) between the images across the years. This was chosen because the variation of forest cover in the High Forest Zone of Ghana is not substantially different during the season of study. It is noted that deciduousness that normally occurs in the dry season could not have confounded classification results because, most of the trees in the semi-deciduous forest are asynchronous and do not shed all their leaves before flushing new ones (Hall & Swaine, Citation1981). The images were geo-referenced to the ETM+ images to allow for accurate pixel-by-pixel comparison during the change detection analysis. The cloud-free images were converted to top of atmosphere (ToA) reflectance to reduce the effect of atmospheric conditions and to allow for multi-sensor data comparison. The boundaries of the management regimes within each reserve were used to create a subset of each of the time-series image (i.e. each management regime in a reserve had images for 1990, 2000, 2010 and 2014).
2.2.1.2 Image processing
Using prior knowledge and a brief reconnaissance survey of the study forest reserves, five broad land use land cover (LULC) classes were identified and described (). Training and validation of GPS datasets were done through field surveys in each identified LULC class in each forest reserve and 30% of the ground control points were kept aside for the accuracy assessment and not used in the classification. Secondary data from park and forest managers, historical reports for each reserve and local knowledge of the forest reserves under consideration were used to generate training and validation datasets for the historical images (i.e. 1990, 2000 and 2010). The images for each period were independently classified using a supervised technique based on the maximum likelihood algorithm (it uses a probability density function to assign a pixel to a specific class). The supervised classification was used in order to provide estimates of the changes in total LULC area for quantification and determination of the trends in different forest management regimes studied. For each period, the area of each land cover class was determined.
Table 2. Description of land cover classes.
2.2.2 Accuracy assessment
Assessment of classification accuracy of 1990, 2000, 2010 and 2014 images was carried out to determine the quality of information derived from the data. If classification data are to be useful in change detection analysis, it is essential to perform an accuracy assessment for individual classification (Owojori & Xie, Citation2005). The accuracy of the classification was determined by comparing ground samples obtained from field observations with the classified image. In all 80 validation GPS points were used in performing the accuracy assessment over the study area by generating error matrix. The comparison of reference data and classification results was carried out statistically using error matrices. Accuracy assessment for all the reserves under study was determined using Producer’s and User’s assessment. The overall accuracy, user’s and producer’s accuracies were derived. In addition, a non-parametric Kappa assessment formula was used to determine the extent of accuracy for the various land-use types. Kappa is a measure of agreement between predefined producer ratings and user-assigned ratings (Lu, Mausel, Brondízio, & Moran, Citation2004).
2.2.3 Forest management regime level analysis and statistical determination
Change detection analysis using pixel-by-pixel comparison was used to identify and quantify the transitions between the classified time-series images. Classified image for the year 1990 was compared first against 2000, and then 2010 whilst that of 2010 was compared with 2014. The change statistics showing the transition in land use between the images were derived. For analysis of the regimes, areas with the similar or same objective of management were grouped to form one regime. Protection regime therefore comprised provenance, swamps, hilly areas, wildlife sanctuary, and the wildlife-protected area, resource reserve and national park. Production regime incorporated convalescence areas as well. GSBAs did not change but stood as already indicated.
A one-way repeated measures ANOVA (Ho, Citation2006) was conducted to compare the rate of percentage cover change measured between 1990–2000, 2000–2010 and 2010–2014. Rate of percentage cover change was estimated by dividing the percentage cover change by the number of years. Mauchly’s test was used to test if the assumption of sphericity had not been violated (Ho, Citation2006). A post hoc test using LSD was also used to determine where the significant rate of change measured among the years lies. Two mixed-design (between-within subjects) ANOVA (Ho, Citation2006) was conducted to assess the: 1) impact of the three different management regimes (GSBA, Protection and Production) on rate of percentage cover change measured between 1990–2000, 2000–2010 and 2010–2014 and 2) impact of two different institutional jurisdictions (FSD and WD) on rate of percentage cover change measured between 1990–2000, 2000–2010 and 2010–2014. Mixed-design ANOVA compares the means obtained from between groups manipulated (in our case management regimes and different institutional jurisdictions) over a repeated measure variable (Time period) (Ho, Citation2006; Field 2007).
3. Results
3.1 Accuracy assessment
The overall classification accuracy for the images in the various years as well as detailed statistics for the various image classification for the under listed reserves are presented in . The overall accuracies for the classified images of the forest reserves were 86.5% for Fure River, 86.9% for Bia North, 78.57% for Bia South and 87.8% for Tano Offin. The overall Kappa statistics of the classified images for the various forest reserves were as follows: Fure River: 0.82, Bia North: 0.84 Bia South: 0.75 and Tano Offin: 0.85. However, the overall classification accuracy for image classifications, verified using an independent data set of 80 points, was above 87% with a kappa statistics of 81.4% for all the years, indicating confidence in the analysis.
Table 3. Accuracy (in percentages) of classified images of the land cover types for the periods in the five forest reserves in Ghana.
3.2. Patterns of land cover change in the forest reserves
The classified land use/land cover change (LULC) maps for the various forest reserves for the years 1990, 2000, 2010 and 2014 are found in Appendices 1–4. The classification results for 1990, 2000, 2010 and 2014 are summarized into tables and figures. Forest cover distribution shows how forest cover change occurred during a particular period. Land cover in 1990 was used as a baseline to compare how land cover types changed over the years between 2000 and 2010 and how they stood as of 2014.
3.2.1 Land cover type (class) trend dynamics
It was observed generally that the highest loss of closed canopy forest was between 1990 and 2000. The annual rate of closed canopy loss between 1990 and 2000 was 1.56%. Between 2000 and 2010, the rate was down to 0.5% but rose marginally by 0.05% from 2010 to 2014 ().
Table 4. Changes in LULC from 1990 to 2014 for Bia North, Bia South, Tano Offin and Fure River forest reserves.
presents the overall change in land cover between 1990 and 2014 for all the forest reserves across the various management regimes.
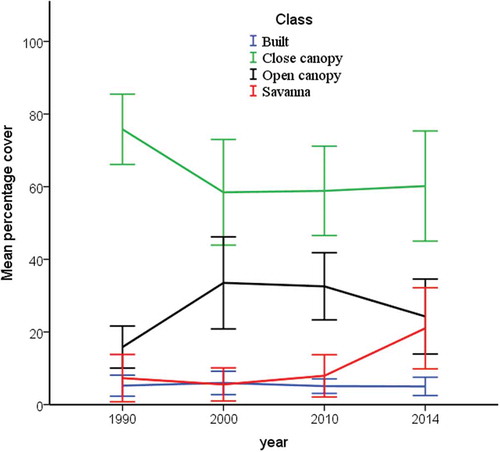
Correspondingly, this loss of closed canopy forest cover resulted in an open canopy forest gain within the same period between 1990 and 2000. The open canopy forest experienced a sharp increase in the area before showing a decreasing trend between 2000–2014 (). The mean proportion of land occupied by the open canopy forest, which was 12.1% in 1990, rose to 27.9% in 2014 indicating a 15.8 percentage point increase of the area occupied by open canopy forest. Some open canopy forests areas degraded to the status of grassland and bare areas. Consequently, the change in forest cover to grassland was more pronounced between the periods 2000–2014 since there was a steady increase in the area occupied by grassland. These changes reflected in the mean area occupied by grassland as it showed an increase of 4.0 percentage points within the period 1990 to 2014. Similarly, the bare land areas showed a general steady increase of approximately 3.1 percentage points which was more than twice as much as what existed in the year 1990.
Figure 2. Percentage cover of vegetation from 1990–2014 separated by class type.
3.2.2 Forest reserve level cover change dynamics across ecological zones
The only forest that had a transition in cover was the Fure River FR in the Wet Evergreen ecological zone. Canopy closure improved by 13.1%, i.e. 2,092 ha of its open canopy forest assumed the status of closed canopy forest between the years 2010–2014.
The highest percentage loss of closed canopy forest was recorded at Tano Offin FR in the Upland Evergreen. This occurred between the period 1990 and 2000 when about 12,412.8 ha accounting for 31.5% of the closed forest changed into other land cover types. The minimum loss of closed forest (3.3%) representing 1005.8 ha was recorded for Bia South FR in the Moist Semi-deciduous between 2010 and 2014. The loss of closed canopy forest resulted in corresponding increases in the areas occupied by the open canopy forest as well as non-forest cover types. In the Bia South FR areas occupied by closed canopy forest between 1990 to 2014 degraded to the status of open canopy forest. From , it is evident that the area of closed canopy forest reduced from 29,752.92 ha in 1990 to 25,425.72 ha in 2014 representing about 4327.2 ha lost in closed canopy forest cover.
The Bia North FR showed a significant reduction in closed canopy forest cover from 23,047.20 ha representing 64.3% of the reserve in 1990 to 16,219.32 ha (45.2%) in 2000. This trend of closed canopy loss further decreased to 13,775.64 ha (38.4%) in 2014. Conversely, open canopy forest cover increased as closed canopy forest cover decreased from 7925.67 ha (22.1%) to 11,203.2 ha (31.3%) by 2014. Grasslands also increased from the initial 3785.94 ha in 1990 to 9060.75 ha in 2014 accounting for about 139% increment in the area occupied by grasslands in the Bia North FR. For the 24 years under investigation, closed canopy forest lost dominance in the Tano Offin FR reducing from 35,375.4 ha (89.7%) to 22,962.6 ha (58.2%) from 1990 to 2000. This area of closed canopy forest further reduced from 17,430.48 ha (44.2%) in 2010 to occupy 14,998.59 ha (38.0%) in 2014 (). Conversely, this resulted in an Open canopy forest cover gain from 3533.67 ha (9.0%) in 1990 to 20,433.78 ha (51.8%) in 2014. The proportion of land occupied by grasslands and built-up areas witnessed an increase from the original 0.87% in 1990 to 5.55% in 2014 for grassland and 0.49% in 1990 to 4.62% in 2014 for built-up/bare areas.
The trend was however different for the Fure River FR. From , despite a slight decrease in closed forest cover from 11,679.21 ha to 10,832.85 ha between 1990 and 2000, there was a forest cover gain of 415.17 ha between 2000 and 2010. Finally, closed canopy forest recovered to occupy a total land area of 13,339.98 ha representing 83.7% of the total reserve forest area from the initial 73.3% that was observed. The increase in closed canopy forest cover observed resulted in a decline in open forest cover and grasslands.
3.2.3 Forest cover change within forest management regimes
presents the various regimes found in the study forest reserves and the changes in their closed canopy forest cover to other land cover types observed across the various periods of study. Considering the entire period (1990–2014), the largest loss of closed canopy forest cover occurred within the Production regimes where the area occupied by this regime in Tano Offin FR lost 82.2% within the period. A greater proportion of this loss occurred within the last 4 years (2010–2014) where 60% of the cover was lost. In the same reserve, almost half (49.9%) of the protection regime’s closed canopy was lost from 1990 to 2014, whereas the GSBA lost 47.5% of its closed canopy forest to other land cover types. In Bia South, the national park (protection) had a marginal cover loss over the monitoring period with the lowest loss (1.1%) recorded in the closed canopy between 1990–2014. In contrast, the highest positive change in forest cover (17.6%) was found in the Fure River FR in a convalescence area which is part of the production regime. This regime together with the GSBA within the same forest reserve saw a transition in forest recovery that was rare during the period of study.
Table 5. Forest management regimes and changes in forest cover.
3.3. Analyzing percentage cover change across periods. Regimes and institutional jurisdictions of forests
Results from the repeated measure ANOVA indicate a non-significant Mauchly’s test [χ2(2) = 1.728, p> 0.05] implying that the assumption of sphericity had been met and therefore, the Tests of ‘Within-Subjects’ Effects can be used. The Tests of ‘Within-Subjects’ Effects show that the repeated variable (time period) is highly significant [F (2, 28) = 6.991, p< 0.05]. That is, the rate of percentage cover change differed significantly as a function of the three time periods. A post hoc test, however, showed that 2000–2010 mean rate of cover change (M = −0.155, SD = 1.353) and that for 2010–2014 (M = −0.030, SD = 2.142) did not differ significantly (P > 0.05), but were significantly (p < 0.05) less than the mean rate of change from 1990–2000 (M = −1.887, SD = 1.500)
Result of the mixed-design ANOVA used to assess the impact of the three different management regimes on rate of percentage cover over the time period indicates that the main effect comparing the three regimes [F (2, 12) = 0.677, p> 0.05] and interaction between the regime type and the time periods, [F (4, 24) = 0.438, p> 0.05] were not statistically significant. Thus, the overall trend of rate of percentage cover change observed is similar across the different regimes and that the rate of percentage cover change observed across the different time periods was not influenced by regime type ().
Table 6. Annual mean rate of cover change across management regimes and management institutions over the time periods.
The result of the mixed model ANOVA used to assess the impact of two different institutional jurisdictions (FSD and WD) on rate of percentage cover change measured between 1990–2000, 2000–2010 and 2010–2014 also showed that there was no significant interaction between the different institutions and the time periods, [F (2, 26) = 0.629, p> 0.05]. The main effect comparing the two institutions was also not significant [F (1, 13) = 0.016, p> 0.05], suggesting that the rate of change for each time period and the overall trend of rate of change do not differ between the different institutions managing the forests ().
4. Discussion
4.1 General observations on forest cover change
Results from this study showed a declining trend in closed canopy forest cover from 1990 to 2010. This means forest degradation occurred throughout the period and the results bear the semblance of patterns observed by the World Bank (Citation2004) for Ghana’s high forest zone and Addo-Fordjour and Ankomah (Citation2017), when they assessed forest cover changes in semi-deciduous forests in Ghana. With the exception of Fure River Forest Reserve, which showed signs of recovery at some stage, closed canopy forest (CCF) over the period showed a consistent reduction with a corresponding increase in the open canopy forest. This pattern of cover loss at the forest reserve level shows that the forest transition theory (FT) proposed by Mather (Citation1990) is not yet at work in these forests, Forest degradation in forest reserves in Ghana has a long history dating back to the 1980s (FAO, Citation1988; IUCN, Citation1992) and is therefore a matter of concern if the country has not yet found an effective means of stopping it.
The pattern of forest cover change observed at Fure River Forest Reserve was consistent with the FT theory where forest degradation stops at some point and is followed by aggradation or recovery. This pattern is similar to what was observed by Angelsen (Citation2007) in his policy research working paper to the World Bank and consistent with the underlying claims of the theory as reported by Rudel (Citation1998). The study did not investigate the cause of recovery; however, it was evident that this recovery was not occasioned by plantation development but through regrowth by natural regeneration. It is known that if a forest is logged carefully according to management prescriptions and illegal entries into closed compartments are avoided, then the forest can recover successfully from logging damage (Hawthorne, Citation1993). Probably this particular reserve went through such a process of careful logging followed by no further disturbance. It was also learnt that the Timber Utilization Contract (TUC) holder or concessionaire of this particular reserve employs security guards from the forest fringe communities to augment the efforts of the Forest Services Division’s (FSD) forest guards and provides informants with mobile phones to report forest offences to the company. This community motivation as acknowledged by Acheampong, Agyeman, and Amponsah (Citation2018), is effective in reducing forest degradation, an argument confirmed by this study and worth replicating in other forest fringe communities to help reverse forest degradation in Ghana.
4.2. Patterns in forest cover change across the periods
The observed pattern of forest cover change and the rate of change recorded over the time period in the current study is similar to what is reported from other studies in Ghana For example, we observed an annual average loss of 1.56% whilst FAO (Citation2011) reported 1.82% from 1990 to 2000 for the entire forest zone. A similar pattern was also observed at the forest reserve level by Asare-Kissiedu (Citation2014) for Worobong South Forest Reserve where the highest forest cover loss was observed within the period 1990–2000. Though forests and forest management have seen series of positive developments in recent decades, over the past 25 years forest cover has changed substantially. Globally, between 1990 and 2015 there was an annual net loss rate of 0.13% (FAO, Citation2016). This is lower than the Ghanaian situation and presents Ghana as having one of the highest deforestation rates globally. However, in terms of deforestation trends Ghana falls within the global pattern whereby there was a decrease in the rate of annual net loss of forest from the 1990s to 2015 as reported by FAO (Citation2016). The results supports our hypothesis that forest degradation slows down with time nonetheless, the upsurge of deforestation linked activities such as mining and cocoa expansion in Ghana recently (National REDD+ Secretariat, Citation2017) indicates that the decline in natural forest is likely to continue unless these activities can be brought under control.
4.3. Forest cover change across Management regimes
The results from the present study show that protected areas and GSBAs are degrading along the same pattern and severity as production forests. This suggests that the designation of forest reserves as protected areas or GSBA has not conferred any special protective measures on them. In fact, the findings identify a GSBA in Tano Offin FR as having lost the highest forest cover. Our result does not support our hypothesis on the differences in the rate of forest degradation between timber production forests and protection forests and is contrary to other studies (Dompka, Citation1996; Schaik, Carel, & Kramer, Citation1997) that show that there is less deforestation and forest degradation within protection regimes than in the areas surrounding them such as production regimes (Sánchez-Azofeifa, Gretchen, Pfaff, & Busch, Citation2003). Our result suggests that all the regimes may be subjected to similar land-use pressure including forest degradation agents identified in Ghana, namely, logging, wildfires, mining, illegal farming, and fuelwood harvesting (Addo-Fordjour & Ankomah, Citation2017).
Protected areas are generally believed to be the cornerstones of biodiversity conservation (Noss, Citation1996) and the safest strongholds of wilderness (Soulé & Sanjayan, Citation1998). However, this study shows that in Ghana, protected areas including GSBAs may not constitute safe strongholds for conservation and therefore the unique flora and fauna that these regimes seek to protect are at risk of being lost through habitat destruction and exploitation. These management regimes constitute the habitats for some of the category of near threatened of the IUCN Red list of threatened animals. It is therefore imperative to search for innovations that can safeguard the sustainability of these regimes.
4.4. Forest cover change and its implications for forest policy and management
The results showed that although the rate of forest cover loss declined after 2000, the general decline in forest cover persisted. Interestingly, the rate of change was not significantly different between the last two time periods, implying the reduction in forest degradation may even be uncertain. This is notwithstanding the fact that Ghana has pursued a number of interventions over the years including policy and legal reforms, institutional strengthening and international forest protocols targeted at addressing deforestation and forest degradation as well as increasing the forest resource base (Ghana REDD+ Strategy. (GRPS), Citation2016; Tropenbos International Ghana, Citation2015). In the present decade Ghana has one of the highest rates of deforestation globally with an annual rate of 2% (Food and Agriculture Organization, Citation2010), which is higher than average for Africa (0.62%) and West Africa (1.17%) and ranked sixth globally (Food and Agriculture Organization, Citation2010).
It is important to note that closed canopy forest cover changed to open canopy forest whilst shrub/grasslands expanded to become prominent land cover type within the reserves. The areas occupied by bare lands also increased steadily within the monitored period. The upsurge of shrubs/grassland in once closed canopy forest is a cause for concern as it can lead to changes in the overall forest composition, with serious implications for biodiversity, fire-vulnerability and complexity of the forest ecosystem and services (Bodin & Wiman, Citation2007; Kinzig, Ann, Pacala, & Tilman, Citation2002). Openness of the forest canopy in Ghana is noted to be associated with the invasion of non-native species most of which are pioneers and therefore more competitive in open forests (Kyereh, Agyeman, & Abebrese, Citation2014; Swaine et al., Citation1997).
Results of this study suggest that the implementation of the various management interventions has not been fully effective in reversing the rate of degradation of reserved forest areas in the high forest zone of Ghana. As indicated by Glastra (Citation1999), forest reserves are expected to experience minimal forest cover loss due to the controlled nature of human activities but as Schaik et al. (Citation1997) puts it; the problems of mismanagement and conservation politics continue to be a threat to forest reserves. In the case of Ghana, what may be necessary is to analyze the drivers of forest cover change to see how they manifest in the various management regimes so that targeted effort can be made to address them. In the 1990s Ghana’s forest management strategies were adjudged commendable and it was hopeful that Ghana was on its way to achieve sustainable forest management (Hansen & Treue, Citation2008). However, the present study and many others (Addo-Fordjour & Ankomah, Citation2017; Oduro et al., Citation2014) are pointing to a situation of serious forest degradation and deforestation that gives little hope for sustainable forest management. Already there is a prediction that Ghana’s forest would disappear in 25 years if the present rate of decline continues (Boafo, Citation2013). It is also clear from the findings at Fure Forest Reserve that, where forest management regime practices are complemented with community participation in forest monitoring and enhanced enforcement of the law, the forest cover can be maintained. Perhaps such findings if well shared could provide lessons for turning things around in the management of Ghana’s forests.
5. Conclusions
Results from the study indicated that with the exception of one forest reserve that showed signs of recovery from degradation during the period of monitoring, the other forest reserves showed continuous degradation confirming the narrative that Ghana’s forest reserves are declining in quality with time.
Forest degradation occurred at different rates within the period and was more rapid from 1990 to 2000 than from 2000 to 2010 or 2010 to 2014 a probable indication of continuous degradation but at a deceleration rate. Protected forests and GSBAs declined in forest quality at the same rate as production forests and therefore did not benefit from any extra protective measures expected of such regimes, which implied undifferentiated use of forests in spite of the restrictions and management practices. Thus, current management practices are inadequate at protecting protected areas and areas classified as GSBAs. It is recommended that to reduce forest degradation to an appreciable level, the Forestry Commission should implement its present sustainable forest management initiatives especially the Voluntary Partnership Agreement with the EU and the REDD+ strategies in a more effective way than it has done with previous forest management interventions. In addition, new strategies should be found to manage protection forests and GSBAs to ensure their optimum protection by enforcing laws and incentivizing forest fringe communities to participate in forest monitoring.
Bia_South_2014.PNG
Download PNG Image (263.8 KB)
Bia_South_2010.PNG
Download PNG Image (242.9 KB)
Bia_South_2000.PNG
Download PNG Image (274.1 KB)
Bia_South_1990.PNG
Download PNG Image (149.4 KB)
Fure_2014.PNG
Download PNG Image (425.2 KB)
Fure_2010.PNG
Download PNG Image (501.9 KB)
Fure_2000.PNG
Download PNG Image (510.4 KB)
Fure_1990.PNG
Download PNG Image (502.4 KB)
Tano_Offin_2014__2_.PNG
Download PNG Image (415.8 KB)
Tano_Offin_2010__2_.PNG
Download PNG Image (412.7 KB)
Tano_Offin_2000__2_.png
Download PNG Image (409.7 KB)
Tano_Offin_1990__2_.PNG
Download PNG Image (221.7 KB)
Bia_North__2014.PNG
Download PNG Image (427.7 KB)
Bia_North__2010.PNG
Download PNG Image (425.7 KB)
Bia_North__2000.PNG
Download PNG Image (360.4 KB)
Bia_North_1990.PNG
Download PNG Image (352.8 KB)
Disclosure statement
No potential conflict of interest was reported by the authors.
Supplementary material
Supplemental data for this article can be accessed here.
Related Research Data
References
- Acheampong, E.O., Agyeman, K.O., & Amponsah, O. (2018). The motivation for community participation in forest management: The case of Sefwi-Wiawso forest district, Ghana. International Forestry Review, 20(1), 1–17.
- Addo-Fordjour, P., & Ankomah, F. (2017). Patterns and drivers of forest land cover changes in tropical semi-deciduous forests in Ghana. Journal of Land Use Science, 12(1), 71–86.
- Addo-Fordjour, P., Rahmad, Z.B., Amui, J., Pinto, C., & Dwomoh, M. (2013). Patterns of liana community diversity and structure in a tropical rainforest reserve, Ghana: Effects of human disturbance. African Journal of Ecology, 51(2), 217–227.
- Angelsen, A. (2007). Forest cover change in space and time : Combining the Von Thunen and forest transition theories. World Bank Policy Research Working Papers 4117. World Bank, Washington, D.C. doi:10.1596/1813-9450-4117.
- Asare-Kissiedu, E. (2014). Contribution of modified taungya system to forest cover and livelihoods of forest-fringe communities. A case study of worobong south forest reserve in Ghana. University of Ghana. Retrieved from http://ugspace.ug.edu.gh/handle/123456789/8955
- Awuah, E.I. (2015). Administration of local community forest rights in the high forest zone of Ghana: The case of forest fringe communities in tano-offin forest reserve, Ashanti region. Kwame Nkrumah University of Science and Technology. Retrieved from http://ir.knust.edu.gh/bitstream/123456789/7499/1/AWUAH%2CIANEDWARD.pdf
- Baidoe, J.F. (1970). The selection system as practiced in Ghana. Commonwealth Forestry Review, 49(2), 159–165. Retrieved from: http://agris.fao.org/agris-search/search.do?recordID=GH2005100613
- Bare, M., Kauffman, C., & Miller, D.C. (2015). Assessing the impact of international conservation aid on deforestation in sub-Saharan Africa. Environmental Research Letters, 10(12), 125010.
- Beeko, C., & Arts, B. (2010). The EU–Ghana VPA: A comprehensive policy analysis of its design. International Forestry Review, 12(3), 221–230.
- Boafo, J. (2013). The impact of deforestation of forest livelihoods in Ghana. Centre for International Governance Innovation (CIGI). Retrieved from https://www.africaportal.org/publications/the-impact-of-deforestation-of-forest-livelihoods-in-ghana/
- Bodin, P., & Wiman, B.L.B. (2007). The usefulness of stability concepts in forest management when coping with increasing climate uncertainties. Forest Ecology and Management, 242, 541–552.
- Boggs, G. (2010). Assessment of SPOT 5 and QuickBird remotely sensed imagery for mapping tree cover in savannas. International Journal of Applied Earth Observation and Geoinformation : ITC Journal, 12(4), 217–224.
- Brown, D., Seymour, F., & Peskett, L. (2008). How do we achieve REDD co-benefits and avoid doing harm? In A. Angelsen (Ed.), Moving Ahead with REDD: Issues, Options and Implications (pp. 107–118). Bogor: Centre for International Forestry Research.
- Contreras-Hermosilla, A. (2002). Law compliance in the forestry sector an overview. Washington, D.C. Retrieved from http://siteresources.worldbank.org/WBI/Resources/wbi37205.pdf
- Dompka, V. (Ed.). (1996). Human population, biodiversity and protected areas: Science and policy issues. Washington, DC.: Am. Assoc. Adv. Sci.
- FAO. (1988). FAO-UNESCO soil map of the world. Revised legend. world soil resource report 60. FAO, Rome.
- FAO. (2011). State of the world’s forest 2011. Rome: Food and Agriculture Organization of the United Nations. pp. 164. ISBN 978-92-5-106750-5.
- FAO. (2016). Global forest resources assessment 2015. How are the world’s forests changing? (2nd ed.). FAO, Rome. ISBN 978-92-5-109283-5.
- FIMP. (1994). Study of the implications of the forest protection proposals, definition of scenarios (Discussion paper). Ghana: Kumasi.
- Food and Agriculture Organization. (2010). Country report-Ghana, forestry sector outlook studies-FOSA (No. WP/12). FAO, Rome.
- Forestry Services Division. (1998). Manuals of procedure for forest resource management planning in the high forest zone of Ghana. Ghana: Accra.
- Geist, H.J., & Lambin, E.F. (2002). Proximate causes and underlying driving forces of tropical deforestation tropical. BioScience, 52(2), 143–150.
- Ghana REDD+ Strategy. (GRPS). (2016). Accra. Retrieved from https://www.fcghana.org/userfiles/files/REDD+/GhanaREDD+Strategy.pdf
- Ghartey, K.K.F. (1992). Felling limit and production of under-sized logs. Paper presented at special meeting of Forestry Department working committee on felling diameter limits. Forestry Department, Kumasi, Ghana (unpublished).
- Glastra, R. (1999). Cut and run: Illegal logging and timber trade in the tropics (R. Glastra ed.), IDRC. Ottawa, Canada: Friends of the Earth International. Retrieved from https://doi.org/SD538.C87
- Hall, J.B., & Swaine, M.D. (1981). Distribution and ecology of vascular plants in a tropical rain forest. Forest vegetation in Ghana. The Hague: Dr W. Junk Publishers.
- Hansen, C., & Treue, T. (2008). Assessing illegal logging in Ghana published in International. Forestry Review, 10(4), 573–590.).
- Hawthorne, W.D. (1993). Forest regeneration after logging : Findings of a study in the Bia South Game Production Reserve Ghana (ODA forest). Great Britain: Chatham : Natural Resources Institute.
- Hawthorne, W.D., & Abu-Juam, M. (1995). Forest protection in Ghana: With particular reference to vegetation and plant species. Gland: Gland (Switzerland) IUCN/ODA. Retrieved from http://agris.fao.org/agris-search/search.do?recordID=XF2016061071
- Ho, R. (2006). Handbook of univariate and multivariate data analysis and interpretation with SPSS. Boca Raton: Chapman & Hall/CRC.
- IUCN. (1992). Protected areas of the world: A review of national systems.Afro tropical Vol. 3, lUCN. Gland, Switzerland and Cambridge, UK.: lUCN Pubhcations Services Unit.
- Kinzig, A.P., Ann, P., Pacala, S.W., & Tilman, D. (2002). The functional consequences of biodiversity : Empirical progress and theoretical extensions. Princeton University Press. Retrieved from https://www.jstor.org/stable/j.ctt24hqmf
- Kotey, N.A., Francois, J., Owusu, J.G.K., Yeboah, R., Amanor, K.S., & Antwi, L. (1998). Falling into place. Policy that Works for Forests and People Series No. 4. Ghana country study. pp. 138. Retrieved from http://agris.fao.org/agris-search/search.do?recordID=GH2005100230
- Kyereh, B. (2007). Tano Offin globally significant biodiversity area: Management plan 2007 – 2011. Forestry Commission, Accra, Ghana.
- Kyereh, B., Agyeman, V.K., & Abebrese, I.K. (2014). Ecological characteristics that enhance broussonetia papyrifera’s invasion in a semideciduous forest in Ghana. Journal of Ecosystems, (2014, 1–6.
- Li, J., Carlson, B.E., & Lacis, A.A. (2013). Application of spectral analysis techniques in the intercomparison of aerosol data: 1. An EOF approach to analyze the spatial-temporal variability of aerosol optical depth using multiple remote sensing data sets. Journal of Geophysical Research: Atmospheres, 118(15), 8640–8648.
- Liu, G., Wu, M., Niu, Z., & Wang, C. (2015). Investigation method for crop area using remote sensing sampling based on GF-1 satellite data. Transactions of the Chinese Society of Agricultural Engineering, 31(2015), 160–166.
- Lu, D., Mausel, P., Brondízio, E., & Moran, E. (2004). Change detection techniques. International Journal of Remote Sensing, 25(12), 2365–2401.
- Luca, M.D., Domini, F., & Caudek, C. (2004). Spatial integration in structure from motion. Vision Research, 44(26), 3001–3013.
- Mather, A.S. (1990). Global forest resources. Timber Press Incorporated, Rome.
- Mather, A.S., & Fairbairn, J. (2000). From floods to reforestation: The forest transition in Switzerland. Environment and History, 6(4), 399–421.
- Ministry of Lands and Natural Resources. (2011). Revised forest and wildlife policy of Ghana. Ghana Government, Accra, Ghana.
- Ministry of Lands Forestry and Mines (MLFM). (2006). National wildfire management policy, Ghana.
- Morris, R.J. (2010). Anthropogenic impacts on tropical forest biodiversity: A network structure and ecosystem functioning perspective. Philosophical Transactions of the Royal Society B: Biological Sciences, 365(1558), 3709–3718.
- National REDD+ Secretariat. (2017). Ghana’s national forest reference level. Accra, Ghana. Retrieved from https://redd.unfccc.int/files/ghana_national_reference__level_01.01_2017_for_unfccc-yaw_kwakye.pdf
- Noss, R.F. (1996). Conservation biology, values, and advocacy. Conservation Biology, 10(3), 904.
- Oduro, K.A., Mohren, G.M.J., Affum-Baffoe, K., & Kyereh, B. (2014). Trends in timber production systems in the high forest zone of Ghana. International Forestry Review, 16(3), 289–300.
- Owojori, A., & Xie, H. (2005). Landsat image-based LULC changes of San Antonio, Texas using advanced atmospheric correction and object-oriented image analysis approaches. San Antonio. Retrieved from http://citeseerx.ist.psu.edu/viewdoc/download?doi=10.1.1.438.4721&rep=rep1&type=pdf
- Parren, M.P.E., & De Graaf, N. (1995). The quest for natural forest management in Ghana, Côte d’Ivoire and Liberia. Wageningen, the Netherlands: The Tropenbos Foundation.
- Planning Branch. (1995). Manual of procedures. high forest management. Section D – Stock survey and yield allocation. Kumasi, Ghana: Author.
- Rudel, T.K. (1998). Is there a forest transition? Deforestation, reforestation, and development1. Rural Sociology, 63(4), 533–552.
- Sánchez-Azofeifa, A.G., Gretchen, D.C., Pfaff, A.S.P., & Busch, C. (2003). Integrity and isolation of Costa Rica’s national parks and biological reserves: Examining the dynamics of land-cover change. Berkeley. Retrieved from www.elsevier.com/locate/biocon
- Schaik, V., Carel, P., & Kramer, R.A. (1997). Toward a new protection paradigm. In R.A. Kramer, C. van Schaik, & J. Johnson (Eds.), Last stand: Protected areas and the defense of tropical biodiversity (pp. 212–223). New York: Oxford University Press.
- Senf, C., Pflugmacher, D., Wulder, M.A., & Hostert, P. (2015). Characterizing spectral–Temporal patterns of defoliator and bark beetle disturbances using Landsat time series. Remote Sensing of Environment, 170, 166–177.
- Soulé, M.E., & Sanjayan, M.A. (1998). Ecology-Conservation targets: Do they help?. Science, 279, 2060–2061.
- Swaine, M.D., Agyeman, V.K., Kyereh, B., Orgle, T.K., Thompson, J., & Veenendaal, E. (1997). Ecology of forest trees in Ghana. ODA, London, UK.
- TRMR. Timber resources management regulations, Pub. L. No. L.I. 1649 (1998). Retrieved from http://extwprlegs1.fao.org/docs/pdf/gha68466.pdf
- Tropenbos International Ghana. (2015). Understanding Ghana’s timber legality assurance system (pp. 25). Kumasi, Ghana: Author.
- World Bank. (2004). A better investment climate for everyone. Washington. Retrieved from http://siteresources.worldbank.org/INTWDR2005/Resources/complete_report.pdf
- Zhu, X., & Liu, D. (2014). Accurate mapping of forest types using dense seasonal Landsat time-series. ISPRS Journal of Photogrammetry and Remote Sensing, 96, 1–11.